ETHEREUM → Rally and liquidity capture. Up or down?BINANCE:ETHUSDT.P is strengthening following Bitcoin. This is a reaction to developments in the Middle East, namely Trump's comments on peace. But there are doubts...
The crypto market is reacting to the situation in the Middle East, namely Trump's statements about peace. But apart from him, no one else is talking about peace. No agreements have been reached, so the level of risk is quite high.
Another nuance hinting at the general mood in the market: 66% of the largest traders on Hyperliquid are currently shorting crypto — Cointelegraph
ETH, technically, has stopped in the trend resistance zone as part of a local rally in the Pacific session.
If there is not enough potential to break through the trend resistance and the price forms a false breakout of 2390, the local trend may continue
Resistance levels: 2433, 2475
Support levels: 2390, 2313
The inability to continue growth will confirm the fact of bearish pressure (market distrust of the bullish momentum). The past momentum, in hindsight, can be considered manipulation (liquidity capture). Consolidation below 2390 may trigger a decline.
Best regards, R. Linda!
Falling Wedge

GOLD → Risk zone 3340. Sell-off after rallyFX:XAUUSD , after breaking out of its accumulation phase, rallied towards the 3400 zone of interest, but failed to reach liquidity and reversed, selling off its gains due to economic uncertainty.
In my opinion, the market is unexpectedly subdued and has reacted very weakly to geopolitical problems in the Middle East. The market has digested the news of US airstrikes on Iranian nuclear facilities and is awaiting PMI data from the US and the eurozone, Fed statements, US GDP and other macroeconomic data. The uncertainty factor has done its job... Participants fear further escalation of the conflict, but so far Iran has refrained from taking drastic steps, which has reduced demand for gold as a safe haven asset. Geopolitics and macro statistics remain in focus.
Technically, gold is trading above 3340 (in the buy zone). A retest of the liquidity zone is possible, and if buyers keep the market above 3340-3350, the price may continue to rise.
Support levels: 3347, 3342, 3320
Resistance levels: 3366, 3396
On D1, the key level is the 3340-3347 area. At the moment, we are seeing a sell-off and a move to retest support. Accordingly, a false breakdown and price holding above 3340, followed by a change in character and a breakdown of the bullish structure, will hint at growth. But if the reaction at 3340 is weak and the market continues to storm this support, then in this case, the metal could drop to 3300
Best regards, R. Linda!

ADAUSDT → Bear market. Support breakdownBINANCE:ADAUSDT.P is in the distribution phase after exiting consolidation. The coin continues to update local lows within a downtrend.
Technically, the cryptocurrency market is in stagnation/correction, as there is no bullish driver yet. Bitcoin is currently consolidating but continues to shoot local downward impulses, which generally has a negative impact on coins.
ADA is entering a distribution phase of accumulation formed in the range of 0.62 - 0.71. If the bears keep the price below 0.62-0.6, ADA may well test the intermediate bottom of 0.5364-0.51
Resistance levels: 0.61, 0.62
Support levels: 0.5993, 0.5364
Focus on 0.61 and the local level of 0.5993. Price consolidation below this zone could confirm the bearish nature of the market, which could lead to another decline.
Best regards, R. Linda!

GOLD → Consolidation within a falling wedgeFX:XAUUSD is consolidating. A major player is gathering a trading position inside a wedge ahead of distribution. But the main question is: in which direction?
Gold lost ground again on Friday after mixed holiday trading on Thursday. Traders are waiting for new signals from the Fed and monitoring the situation in the Middle East. Interestingly, gold fell as the conflict escalated further (which is not logical overall). The dollar is in a global bearish trend, and traders are waiting for a decision from Powell (who is under pressure from Trump to cut rates).
Technically, if we look at the wedge, we can see how difficult it is for the market to move. The price is stuck inside the consolidation. The intraday movement is very short, with long tails and a very weak reaction to both false breakouts and level break. Large players are building up positions inside the current channel. This may only hint at the possibility of future implementation (distribution).
Resistance levels: 3360, 3396, 3420
Support levels: 3338, 3320, 3302
On D1 - H4, gold is in a countertrend (bullish trend) correction and is testing the trend support + 0.7 Fibo zone. Below, there are fairly strong areas of interest — 3320 and 3302 — which gold may test before rising. However, within the wedge, there is a fairly high probability of a breakout of resistance and the 3360 level, followed by a rally to the liquidity zone at 3396
Best regards, R. Linda!

ORDI/USDT – Bullish Falling Wedge Formation!!Hey Traders — if you're into high-conviction setups with real momentum, this one’s for you.
ORDI is forming a bullish falling wedge pattern and is currently consolidating near crucial support. The price is showing initial signs of breakout potential.
Here's the trade plan:
Entry: $7.20–$7.70
Targets: $9.20 / $10.50 / $11.90
Stop Loss: $6.50 (Strict)
Excellent risk-to-reward opportunity here. Keep your stops tight and manage your risk wisely.

GOLD → Continuation of the global trend... To 3350?FX:XAUUSD is testing trend support within a correction. Against a complex fundamental backdrop (the Middle East, Fed comments, Trump's desire to lower rates), the price may continue to rise.
The price of gold rose from a weekly low of $3,363 on Thursday thanks to increased demand for safe-haven assets following reports of possible US strikes on Iran. Markets are ignoring the Fed's hawkish decision to maintain its tight policy and rate forecasts. Traders are waiting for new signals from the Middle East, given the risk of increased volatility due to low liquidity in connection with the US holiday.
Technically, a bullish wedge pattern is forming as part of the correction. The breakdown of the pattern's support did not lead to a decline, but a return of prices and a breakout of resistance could trigger growth after liquidity returns.
Resistance levels: 3373, 3403, 3420
Support levels: 3349, 3320
Before growth, a retest of the trend support or the 3350 zone is possible. However, if the price goes above 3375 and the bulls hold their ground above this level, then we can expect growth to continue within the trend.
Best regards, R. Linda!

$ENS / USDT Daily Time frame, MAJOR PUMP?Chart Overview
- Pattern Identified: Falling Wedge Pattern
- A bullish reversal pattern, often appearing after a downtrend.
- Three major touchpoints on the lower trendline indicate strong support and pattern validity.
Demand Zone (Support Area)
- Marked near the current price level ($2.0309 - $2.6722)
- Price is testing this zone for the third time.
Supply Zone (Resistance Area)
- Around ($6.6529 – $9.2734)
- Multiple swing highs are plotted within or near this region, indicating strong historical resistance.
Volume Profile (Right side of chart)
- High volume node between $2.50 – $4.00 suggests price acceptance and a potential area for consolidation or resistance after breakout.
- Low volume area between $4.50 – $6.50 implies less resistance, so price might move quickly through it.
FVG (Fair Value Gaps)
- Several FVGs (imbalance zones) are highlighted.
- $3.8 – $4.05
- $5.8236 – $6.1663
- These zones often act as magnets for price, offering potential targets after breakout.
📏 Fibonacci Levels
- Pullback levels (0.28, 0.5, 0.618, 0.786) are marked.
- Price may retrace toward these areas as part of the bullish structure.
✅ Bullish Scenario
- Breakout from the falling wedge pattern.
- Price pushes into first FVG (~$3.8), then toward $5.8236 – $6.1663, eventually challenging the supply zone ($6.6529 – $9.2734)
⚠️ Risks
- If price breaks below the demand zone, it invalidates the wedge and opens room for further downside.
- Falling wedge breakouts require confirmation (e.g., daily close above wedge resistance).
📊 Summary
- Bias: Bullish if support holds and wedge breakout occurs.
- Trigger: Break and close above wedge resistance line.
- Targets: $3.8 → $5.8 → $6.1 → $9.5
- Invalidation: Daily close below the demand zone ($2.00 - $1.90)
Please note this is not financial Advice. This is just an analysis!

WIFUSDT Long Setup – Falling Wedge Breakout Incoming?Hey Traders — if you're into high-conviction setups with real momentum, this one’s for you.
WIF has been consolidating inside a falling wedge structure and is now showing signs of strength from the major horizontal support zone around $0.77. The structure is tightening, and the recent bounce from support could be the early signal of a breakout.
Here’s the trade idea:
Entry Zone: $0.77 – $0.81
Breakout Confirmation: 4H close above the wedge trendline (~$0.87)
Targets:
Target 1: $0.95
Target 2: $1.10
Target 3: $1.35
Invalidation / SL: Below $0.74
Risk-Reward: High (3R+ depending on entry)
Strategy:
Wait for a confirmed breakout with volume. Early entries around current support with tight SLs offer favorable setups if you’re comfortable with added risk.
Keep an eye on Bitcoin’s volatility and global macros, as they may influence alt momentum.

Bitcoin Consolidates Near Highs — Bullish Wedge Signals StrengthHolding Strong Amid Uncertainty:
Despite rising geopolitical tensions, Bitcoin remains resilient, trading near recent highs. This stability reflects strong institutional confidence and sustained accumulation by long-term holders.
Bullish Technical Setup:
The ongoing consolidation between $100,000 and $110,000 is forming a wedge pattern—a classic bullish continuation structure. This suggests the market is coiling for its next major move.
Key Levels to Watch:
Immediate Resistance: $112,500
Support Zone: Holding above $100,000 keeps the bullish case intact
Measured Move Target: $130,000–$135,000
Outlook:
This tight consolidation signals a healthy pause in a strong uptrend, positioning Bitcoin for a potential breakout and continuation higher. All signs point to the bulls remaining firmly in control.
#Bitcoin #BTC #TechnicalAnalysis #BullishWedge #CryptoMarket #InstitutionalBuying #PriceAction #Geopolitics #SupportAndResistance #BullRun

USDCHF → Retesting resistance will lead to a declineFX:USDCHF , having failed to reach its global target after breaking through support, is turning back to retest the zone of interest at 0.8157. A fall in the dollar could trigger a decline in prices...
After breaking through support and falling to 0.8055, a correction is forming towards the zone of interest and liquidity at 0.8157. After reaching the local target, the price may return to the global target (liquidity zone) at 0.8042.
The dollar returned to its downward phase at the opening of the session, to which the forex market reacted accordingly. Most likely, bearish pressure may also affect the USDCHF currency pair, which continues to follow the downward trend.
Resistance levels: 0.8157
Support levels: 0.8055, 0.8042
A retest of resistance amid high volatility could form a false breakout (liquidity capture) before the decline continues within the downtrend.
Best regards, R. Linda!

SYRUP consolidates for rallySYRUP - is testing ATH while the crypto market is in correction. We can conclude that this coin is stronger than the whole market and can continue its rally after accumulating the right potential.
Focus on the mirror support level 0.4600 - the round number gives strength to this level. After a false breakdown, the coin is consolidating in the buying zone. A break of the downside resistance will trigger a rally
Scenario: If the consolidation above 0.4600 continues and the coin breaks the downside resistance, a breakout and consolidation above 0.49450 will attract new buyers, which will only strengthen the rally.

PIPPIN/USDT Long Setup Update!!PIPPIN Breakout Alert – 100% Potential on the Table
Hey Traders — if you're into high-conviction setups with real momentum, this one’s for you.
PIPPIN is breaking out from a falling wedge pattern on the 4H timeframe after a long period of consolidation. This structure typically signals a potential reversal with strong upside momentum.
With the recent breakout, we’re looking at a fresh long opportunity:
Entry:
Current levels: 0.0172 and add more up to $0.0155
Stop-Loss:
Below support: 0.0141
Targets:
Target 1: 0.0336
Target 2: 0.0450
Target 3: 0.0550
Target 4: 0.0650
✅ Risk-reward remains highly favorable from this point.
✅ Tight stop-loss to manage risk in case of any invalidation.
✅ Watch for confirmation above immediate resistance for further strength.
Disclaimer: Always manage your position size and risk. Trade safe!

AVAAI/USDT: FALLING WEDGE BREAKOUT! 90%+ PROFIT POTENTIAL!!AVAAI Breakout Alert – 90%+ Potential on the Table
Hey Traders — if you're into high-conviction setups with real momentum, this one’s for you.
AVAAI has officially broken out of a falling wedge structure on the 4H timeframe — a classic bullish reversal pattern. After weeks of downtrend, price finally closed above resistance with volume.
📌 Entry: Current Market Price (CMP) and add more up to $0.0487
🎯 Targets: $0.0585 / $0.0670 / $0.0798
🛑 Stop Loss: $0.0412
📈 Leverage: 5x–10x (low to moderate)
We’ve already seen a 90% move last time from this zone — if momentum holds, a repeat isn’t off the table. Breakout confirmed. Now it's all about the follow-through.
What's your take on AVA AI here? Are you riding this breakout or staying cautious?


1INCHUSDT - fear zone, return to the channel, growth potential1inch - is a decentralized exchange (DEX) aggregator that combines multiple DEXs into a single platform, aiming to provide users with the most efficient routes for swaps across all platforms.
📍 CoinMarketCap : #160
📍 Twitter(X) : 1.3M
The coin has already been listed on exchanges during the distribution phase of the cycle and was partially sold off in waves. Then, in line with the overall market, it declined to more reasonable accumulation prices, shaking out small investors and those who entered positions on positive news.
The price has been moving within a horizontal channel for a couple of years, and the channel’s percentage range reflects the coin’s liquidity. Currently, the coin is in a fear zone, at its lowest price levels. In moments like this, very few people have funds left to accumulate positions, as they’ve already been trapped by optimistic bloggers and a positive news background earlier.
Many were wiped out recently due to a breakdown and consolidation below the previous support of the inner channel, and now there's emptiness and fear below. What’s happening now is an attempt to return back into the inner channel. If this zone holds, the channel targets may be realized.
Resistance zones where the price may react are marked on the chart. Potential final downside wicks are also indicated. It’s important to allocate funds wisely for position building and use proper percentage distribution, according to your own experience!
______
📌 Not financial advice. Observing structure and recurring phases.
Operate within your strategy and with an awareness of risks.

NXPC/USDT: FALLING WEDGE BREAKOUT ALERT!!NXPC Breakout Alert – 100%+ Potential on the Table
Hey Traders — if you're into high-conviction setups with real momentum, this one’s for you.
NXPC has broken out of a falling wedge pattern on the 4H timeframe and is now retesting the breakout zone. As long as it holds above the green support box, a strong upside move remains likely.
Entry Range: $1.38 – $1.44
Targets: $1.70 / $2.30 / $2.70 / $3.10
Stop-loss: $1.26
Leverage: Use low leverage (Max 5x)
This setup has the potential to kick off a powerful rally.
Keep it on your radar and trade with discipline.
Let me know if you're in this one or watching from the sidelines.

DEXE/USDT: FALLING WEDGE BREAKOUT!!DEXE Breakout Alert – 80% Move Loading?
Hey Traders! If you're into high-conviction plays and real alpha — hit that like and tap Follow for trade setups that actually deliver.
DEXE has broken out of a falling wedge pattern on the daily timeframe and has successfully retested the breakout level. The structure looks strong, and momentum is starting to build.
Entry Zone: $13.4 – $14.4
Targets: $16.1 / $18.2 / $21.2 / $24.4
Stop-loss: $12.60
Leverage: Use low leverage (Max 5x)
This could be the beginning of a powerful upward move.
Keep this setup on your radar and manage risk accordingly.
Let me know your thoughts or if you're riding this one too.

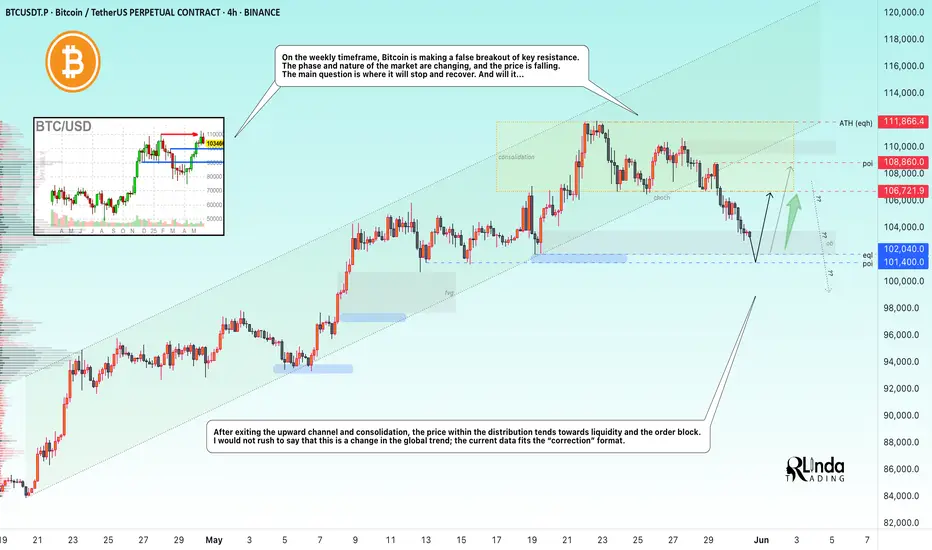
BITCOIN → Correction or trend reversal? Why is 101K important?BINANCE:BTCUSDT.P is exiting the upward channel after a false breakout of the key resistance level of 110K (previous ATH). Liquidation?
Quite an interesting situation with James Wynn. As they say, money loves silence, especially when it comes to a highly manipulated market... A week after the whale's actions, Trump decided to play the market again by creating emotional swings: he announced tariffs on the EU, canceled them, then made claims against China and is now ready to reintroduce tariffs on the EU. Things didn't end well with James... Liquidation before the rally?
On the weekly timeframe, Bitcoin is making a false breakout of the key resistance level of 110K. The phase and nature of the market are changing, the price is falling, breaking the structural support of 106500. The main question is where the stop and recovery will be. And will there be one...
After exiting consolidation and the upward channel, the price within the distribution is moving towards liquidity and the order block. I would not rush to say that this is a change in the global trend; the current data fits the “correction” format.
Support levels: 102000, 101400
Resistance levels: 106700, 108800
102-100K is a fairly important zone for the market; a breakout in this area could open the way to a (local) bottom. Bulls may not be able to hold the market, in which case a global sell-off could form. Therefore, I believe that retesting the 102000 level will end with a liquidity grab and a correction along the trend, during which the price may test the 106K - 108K level, which will determine the future of the market: consolidation, growth, or decline...
Best regards, R. Linda!
Can this be a fakeout?Xrp is forming a perfect falling wedge. Is this a fakeout and a bear trap or a real breakdown?
Probability for falling wedge to break to the upside is around 70%.

DOGEUSDT → Long squeeze before growth?BINANCE:DOGEUSDT.P is consolidating. A range with clear boundaries has formed. Before a possible breakout, a liquidation (false breakdown) may form
On D1, the structure is quite positive. Earlier, the price tested the downward resistance, but there was no reaction (fall) as such. Instead, the price is consolidating within the range of 0.211 (0.205) - 0.23 - 0.253.
Bitcoin, like the entire crypto market, is consolidating within fairly clear boundaries. Based on the current situation, it would be logical to wait for one part of the market to be liquidated before the price can move in either direction. Based on the bullish market, there may be a retest of support in the form of a false break...
Resistance levels: 0.2308, 0.253
Support levels: 0.213, 0.2116, 0.205
DOGE is consolidating with a focus on the 0.23–0.211 range. Against the backdrop of a bullish trend, a liquidation (long squeeze) relative to the lower boundary of the 0.23–0.205 range is possible before growth continues. A false break of support and liquidity capture would be useful maneuvers before implementation. However, if the market is aggressive enough and resistance at 0.23 is broken with subsequent consolidation above this level, it could trigger premature growth.
Best regards, R. Linda!

GOLD → Correction before possible growthFX:XAUUSD entered a liquidation phase (rally) within the trading range at the opening of the session. The dollar's rise is to blame. The focus is on supporting consolidation...
Investors remain interested in gold as a safe haven asset amid geopolitical risks and declining demand for US assets.
The key drivers remain news about tax reform in the US, trade negotiations, and upcoming macro data.
Gold is consolidating, but since the opening of the session, the price has been heading towards support. Against the backdrop of an upward trend, a trigger for bearish liquidity is likely to form before growth.
Against the backdrop of the dollar's growth, gold is entering a correction phase. At the moment, all attention is on support and the liquidity zone of 3265. A false breakdown will trigger a price buyback.
Resistance levels: 3322
Support levels: 3282, 3265
Since the price is still within the range and a countertrend correction is forming in the market, in our case, it is worth considering an intraband trading strategy. A false breakdown of support could trigger growth to intermediate resistance or to the upper border of the channel.
Best regards, R. Linda!

JTO Approaching Breakout Point – Watch This Wedge!🚀 JTO Falling wedge Formation – 100%+ Potential Incoming?! 👀🔥
Hey Traders! If you're all about high-conviction plays and real alpha, smash that 👍 and tap Follow for more setups that actually deliver! 💹💯
JTO has been consolidating within a falling wedge on the daily timeframe for months and is now approaching the apex of the structure.
The price has shown strong demand around the $1.85–$2.00 support zone and is now attempting to push above the wedge resistance trendline.
Technical Highlights:
Falling wedge formation, typically a bullish pattern
Support holding firm at the $2.00 psychological level
Potential for a breakout retest and continuation if volume confirms
Trade Setup
Entry: CMP and add more in the green box(up to $1.8)
Targets: $2.48 / $2.84 / $3.30
Stop Loss: Below $1.85
Risk-to-Reward: Well-structured setup with defined invalidation
A confirmed breakout from this structure could open the door for a strong upside move. Keep an eye on volume and market momentum for confirmation.
What do you think about this? Share your views in the comment section.

EURCHF both scenarios possibles
OANDA:EURCHF UPDATE from first analysis (attached) we are have upside - downside moves, new trend line is created, sup zone is created (violet line) and we can see also long zone.
If we see break of 0.94000 we will be higly possible in bullish move, break of sup zone (violet line) we will can see bearish move.
Currently still giving higher chances for bearish trend, but lets see some stronger moves.
SUP zone: 0.93850
RES zone: 0.92750, 0.92550
