🚧RUNEUSDT is bullish🚧 & many Traders don't see it 👀!!!Hi.
➡️Pair shows a falling wedge pattern forming on the 4-hour chart which could lead to a bullish breakout.
🤑Stay awesome my friends.
_ _ _ _ _ _ _ _ _ _ _ _ _ _ _ _ _ _ _ _ _ _ _ _ _ _ _ _ _ _ _ _ _
✅Thank you, and for more ideas, hit ❤️Like❤️ and 🌟Follow🌟!
Falling Wedge

ETH → Moving from the old range to the new one. Target $3500BINANCE:ETHUSD breaks the consolidation resistance and makes an attempt to enter a new wide range. The target of this maneuver, after fixing the price above the support, may become the area of $3580
The market has been forging consolidations and prolonged retests of the 2300 area for several weeks. After the formation of another set-up, which I warned you about earlier, the price breaks this area. In fact, we were ready for it.
Several support levels are important for us at the moment: 2383 and 2300. Consolidation of the price above these levels will form a big bullish potential, which in the medium term will determine for us the further priority and further path. But in the priority we expect the price growth to continue, as ETH has a positive fundamental and technical background. The medium-term target for us is 2650. There are also chances that the price may test this zone this year and reach the upper boundary of the mentioned range next year.
Support levels: 2383, 2300, 2340
Resistance levels: 2445
Moving averages support the market
We expect the growth to continue as we have a favorable fundamental and technical background.
Regards R. Linda!

WKHS: Falling Wedge With Bullish Divergence Into The 2018 ZoneWKHS has formed a Falling Wedge with Bullish Divergence on the Daily as it has come down into the December 2018 Low. It has also Bullishly Engulfed the previous Daily Candles and has exhausted the Options Chain. At this point in time I'd expect WKHS to make its way back above 50 cents and perhaps run up to around $1 or perhaps a bit higher which would be best played by buying the call options at the 50 cent strike which currently trade at below 5 cents.

THETAUSDT - The attempt to change the trend is doomed to successBINANCE:THETAUSDT is forming another resistance retest and in fact it can be considered an attempt to change the bearish trend. The chance of success is quite high as several key patterns are forming.
On the high timeframe, the coin finds a clear bottom and the triple touch pattern confirms the area. But the price still has a long way to go for a trend change, as breaking the local downside resistance is still not enough, THETA must overcome the 1.717 area to confirm a definitive trend change.
On D1, a descending wedge is forming on the background of the bearish channel, the breakout of which forms a rally to the trend resistance, where a pre-breakout consolidation in the format of an ascending triangle is turning. The strength of this consolidation is enough to break the resistance area and the level of 1.190, which will confirm the breakout and may form an impulse to 1.337 and 1.700.
SMAs are forming an interesting signal.
Support levels: 0.982
Resistance levels: trend resistance, pattern resistance, 1.190.
I expect a breakout of the above zone with the subsequent formation of an upward impulse.
Regards R. Linda!

REEF IMPENDING A YEARLY BREAKOUTIn this chart of BINANCE:REEFUSDT on a weekly timeframe, the price has touched the strongest trendline of REEF as of this date. As a trader, it sparks excitement for a potential breakout that could happen soon.
In this technical analysis, the coin is forming a divergence wherein the price is creating a lower low and our indicators showing a higher low, citing a bullish divergence.
And the price movement clearly shows the diagonal support and resistance lines, leading to this yearly falling wedge pattern. Take a peek on the instances of the coin hitting the trendline (highlighted in red) in this chart below.
Additionally, the month of October and November proved to be special for the coin and it shows the firmness of the resistance line.
If a rejection happens, I will consider this diagonal support for a possible breakdown intraday short play.
Today is weekend, so I don't expect a massive movement for now. Though still on a downtrend, expect a massive increase in the price if it breaks out the year-long trendline. We will have to WAIT for that to happen, it's just a matter of time and patience as I would point out in my previous posts.
Always PLAN your trades and happy trading!

Falling Wedge pattern breakout in BHARATIARTLBHARATI AIRTEL LTD
Key highlights: 💡⚡
✅On 1 Hour Time Frame Stock Showing Breakout of Falling Wedge Pattern.
✅Strong Bullish Candlestick Form on this timeframe.
✅It can give movement up to the Breakout target of 1021+.
✅Can Go Long in this stock by placing a stop loss below 970-.

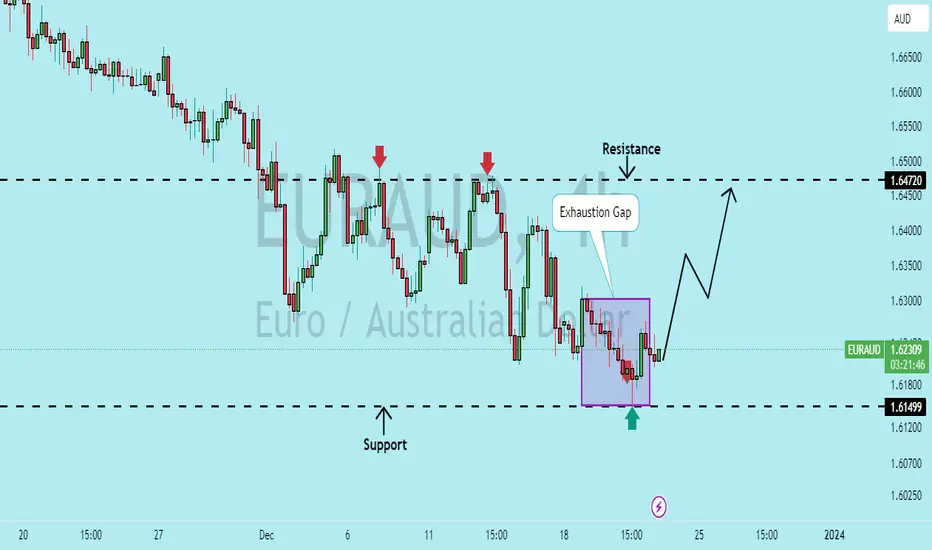
EURAUD Looking BullishIn my assessment, the EURAUD chart displays an exhaustion gap, hinting at a potential rise in prices. Be cautious in your trading decisions.
From my viewpoint, I've recognized an exhaustion gap on the EURAUD chart, indicating a likelihood of an upward trend. Exercise prudence in your trades, and I extend my best wishes for your success
LPTUSDT → Breakout of multi-month trend resistance. BINANCE:LPTUSDT is moving into the phase of realizing the accumulated potential. Against the background of stalled BTC, LPT / TetherUS looks confident enough to continue its growth after breaking through resistance.
The cryptocurrency market is quite active lately. Overall capitalization, flagship, altcoins are warming up after a prolonged winter. Prices are updating multi-month highs and that is encouraging.
LTP is still under bear market pressure and only today the pair is starting to show prerequisites for a possible trend change and realization at 12.00.
The price is forming a pre-breakdown consolidation against the trend resistance. After retest and false breakdown the price does not fall, a strong support area is formed and on the background of another retest the resistance is broken. The tandem set-up plays the role of a reversal set-up and clearly indicates the formation of bullish potential. Moving averages are starting to show a possible market reversal.
Support levels: 6.9, 5.96, 5.35
Resistance levels: 7,56, 9.31, 12.00
Market consolidation above the previously broken trend resistance and the 7.0 area will form a bullish potential that may activate a market rally towards these targets
COINBASE:BTCUSD CRYPTOCAP:TOTAL CRYPTOCAP:TOTAL2
Regards R. Linda!

EURAUDEURAUD is trading in falling wedge pattern. The price was reacting well the support and resistance of wedge.
Currently the price is about to give breakout from falling wedge and after successful retest of the level will be bullish signal and seems like the price may go for another leg higher.
If the breakout sustain to upside the optimum target could be 1.6520 followed by 1.6800.
What you guys think of this idea?

MP Materials: Falling Wedge With Bullish Divergence at a 0.886The Federal Reserve during the FOMC and in its SEP has hinted greatly towards deep rate cuts in 2024 because they see the CPI going down and no longer feel the need to tighten further, and are under the assumption that great progress has been made.
I for one do not agree with this perspective and think rates need to go much higher before inflation can truly be subsided.
Since the Fed is under what I view as a false assumption, I think we will now see Inflation and the CPI come back up even higher and faster than the first inflationary run up and that we will see this greatly reflected in Food, Energy, and Shipping prices. Along with this, I think it will affect the pricing of Rare Earth Elements which should end up being a positive for the Assets on the balance sheet of producers such as MP Materials, VALE, and US Steel: X, along with the REMX ETF; as demand for ships and other means of shipment/transport increases.
The increase in demand for these types of shipments should also drive demand for the materials the shipping vehicles are made of, which should drive the prices higher for both.
I do not think Gold and Silver will join this inflationary rally due to the collapse of the Japanese Carry Trade, and I do not believe the Dollar will lose much value during this rally in inflationary materials except against the Yen. This dynamic should also limit the rally potential in the big stock indexes, I only really expect certain names to benefit from the kind of inflation we are dealing with.
So in short, I think the Bulk Dry Index continues to rise, Shipping Cost Rise, Ships themselves Rise, Oil Rises, and Rare Earth Materials Rise and when that happens, I suspect the Fed will pivot hard back in the other direction and start raising rates again.

DYDXDYDX is trading in falling wedge pattern. The price was reacting well the support and resistance of wedge.
Currently the price is about to give breakout from falling wedge and after successful retest of the level will be bullish signal and seems like the price may go for another leg higher.
If the breakout sustain to upside the optimum target could be 3.5 followed by 4.5.
What you guys think of this idea?

EURCHFEURCHF is trading in descending parallel channel. The price was reacting well the support and resistance of triangle.
Currently the price has given the breakout of local falling wedge from strong support zone and now retesting the broken level where it is also forming a local support zone and seems like the price may go for another leg higher.
If the breakout sustain to upside the optimum target could be 0.9620.
What you guys think of this idea?

BNB → Price is showing an interesting bullish outlook BINANCE:BNBUSDT breaks the resistance of bearish trend on the background of improving fundamental situation. For the activation of the bullish phase of the market, a few more conditions must be met.
We can see that CRYPTOCAP:TOTAL capitalization, following the COINBASE:BTCUSD growth, is also moving into a bullish trend format. BNB is falling away due to regulatory and governance issues. At the moment, the fundamental environment is improving and the price is starting to show interesting prospects.
The break of the descending wedge resistance is a strong enough signal, the price is testing the MA-50 support and the bulls are confidently consolidating their positions above the moving average. At the moment, the resistance of the current consolidation - 257.8 - is holding back the market from going bullish.
A break of this resistance will be accompanied by a surge in volumes, volatility and the formation of a bullish impulse.
Support levels: 226, MA50, 203.4
Resistance levels: 257.8
I expect a breakout of the mentioned resistance after the next retest. On the background of favorable conditions it may happen rather quickly. Targets are 336.8, 439.0.
Regards R. Linda!

EURCAD - BULLISH SCENARIO 📈Hello Traders !
Yesterday, The EURCAD Price Reached a 0.5 Fibonacci Retracement Level.
Currently, The Price Formed a Falling Wedge Pattern.
So Let's Expect The Bullish Scenario:
If The Market Breaks The Resistance Line and Closes Above That,
We Will See a huge Bullish Move...
TARGET: 1.49050🎯

GBPUSDGBPUSD was trading in falling wedge. The price was reacting well the support and resistance of wedge and now has given the very healthy breakout ..
Currently the price has given the breakout of falling wedge and now retesting the broken level where it is also forming a local support zone and seems like the price may go for another leg higher.
If the breakout sustain to upside the optimum target could be 1.2650 followed by 1.2750.
What you guys think of this idea?

ADAUSDT → Cup with Handle before distribution BINANCE:ADAUSDT is forming a breakout of the key pattern resistance, but we have not seen a corresponding reaction yet. The price is updating the 6-month high, but we did not wait for the distribution. Hopes are fueled by the formation of the "Cup with handle" pattern and the Golden Cross of MA200 & MA50
A reversal pattern "Cup with handle" is forming in relation to the limit resistance area at 0.3807. A false break of resistance forms a correction and consolidation near the key area, which peculiarly reminds us of the key pattern
Fundamentally, the cryptocurrency market is mainly waiting for results regarding ETF applications that the SEC is reluctant to review. Approval of applications for spot ETFs will greatly increase the inflow of funds and market capitalization
On the chart, the support at 0.3529 - 0.3500 is important for us. Within the framework of the forming pattern and correction, the price may test this area with a false breakout, which will begin to form a bullish potential, because according to statistics, the strongest movements occur after a false breakout.
Resistance levels: 0.3807, 0.3850
Support levels: 0.3529, 0.3490
I expect a support retest before distribution. A strong impulse can start after the breakout of the locational downside resistance of the pattern "Cup with handle"
CRYPTOCAP:TOTAL COINBASE:BTCUSD
Regards R. Linda!

How do i expect to see $ALGO in 2025-2026 ? 8X possible?Hello fam,
I'm back with another perspective about Algorand with EURONEXT:ALGO symbol.
Comparing other altcoins, Algorand team works on real world solutions and recently partnered with UNDP to lunch Algorand Blockchain Academy.
But from candles world perspective we can clearly detect range formed and lows been swept away. This means we will have our eyes for range high to be tapped in coming weeks. This idea aims for 2.5$.
Besides there was a falling wedge that been broken recently. Falling wedges are reliable strong bullish patterns and most of times they deliver what we expect. as usual fib.0.5 to 0.618 is were we expect to see this wave end. This will be around 1.6$ . This is 8X from current price but as you already know there are many risks in Crypto market and you need to closely do your own research before taking any financial decision or trade.
Read my analysis about CRYPTOCAP:TOTAL , CRYPTOCAP:TOTAL2 and TOTAL3 for better understanding.
Further analysis required in case 1.6$ broken in weekly

🚧BITCOIN will Go Up Again🚧 Road Map(1-H)🗺️!!!As you can see, the price has reacted well to patterns in the past. If we are optimistic or realistic now, the price can grow well after breaking this pattern.
🤑Stay awesome my friends.
_ _ _ _ _ _ _ _ _ _ _ _ _ _ _ _ _ _ _ _ _ _ _ _ _ _ _ _ _ _ _ _ _
✅Thank you, and for more ideas, hit ❤️Like❤️ and 🌟Follow🌟!
⤵️⤵️⤵️⤵️⤵️⤵️⤵️⤵️⤵️⤵️⤵️⤵️⤵️⤵️⤵️⤵️⤵️⤵️⤵️⤵️⤵️⤵️⤵️

USDJPY potential bullish patternAs can be seen in the chart, there is a falling wedge pattern in the chart, which is a naturally a reversal chart pattern and is regarded as an intrinsically bullish formation. This chart pattern is occurring at the important Fibonacci level of 38.2%, and the fact that we have bullish divergence between price and the stochastic oscillator in 4-hour timeframe adds to the possibility of this chart pattern working.
Entries may be initiated at the bullish breakout of the wedge pattern, and based on a one-to-one minimum price target strategy, we can anticipate the price to reach its previous daily high.
Also it should be noted that in case of bearish breakout of the chart pattern this trade idea has failed alongside the chart pattern.
If you've found this analysis helpful, please take a moment to like, comment, or share your thoughts with me.

WISH 4 HOUR FALLING WEDGE (PRE-AH INCLUDED)Watch the $6.75 level for a potential breakout to fill the gap around $7.

AUDUSD - Resistance Becomes Support
Hello Traders !
Previously:
The AUDUSD Price Formed a Bullish Falling Wedge Pattern.
Currently:
The Price Broke a Strong Resistance Level (0.65710 - 0.66256).
This Resistance Level Becomes a New Support Level.
So, I Expect a Bullish Move.
Let's Wait For Retest...
-----------
TARGET: 0.67120🎯

AUDUSD - BULLISH MOVE 📈
As We Talked in The Previous Analysis:
The AUDUSD Price Broke a Strong Resistance Level (0.65710 - 0.66256).
This Resistance Level Becomes a New Support Level.
Currently:
The Price Pull Back to Important Structure !
and Now it Will Continue its Bullish Movement 📈
-----------
TARGET: 0.67120🎯

LTC → The market is ready to move into the distribution phase BINANCE:LTCUSDT entered the local buying zone for the first time in 5 months. The price is breaking the resistance and the market is increasing the chances of transition from consolidation to distribution.
On w1 we see that LTC has been preparing to realize the accumulated potential formed on the bottom for a long time. The global line is broken and the price has been consolidating in the green zone for a few weeks now. On d1, the token is breaking the daily resistance (global descending line) after a long consolidation. The channel resistance is likely to be tested soon, which could be broken rather quickly.
If the mentioned resistance zones are broken, the market may retake the situation quite quickly and we will see a volume growth that will start to form an active momentum towards 85.40 and then to 102.65. The coin has quite a lot of potential. MA-50 supports the market after the false breakdown.
Support levels: 71.09, previously broken resistance, 66.13
Resistance levels: 72,30, 73, 74
Friday's price close near resistance, increases the chances for the scenario to materialize. Another retest of 72.30 could lead to a rise to channel resistance, momentum could break this area and the market will move to distribution. Targets are indicated on the chart.
BINANCE:BTCUSD CME:BTC1! CRYPTOCAP:TOTAL
Regards, R. Linda!
