Bitcoin - Complete plan for February (125K soon)Bitcoin's price action is currently extremely bullish because the price broke out of the falling wedge pattern and 2x successfully retested it! There is really nothing bad about the price action, so we can expect higher prices in the coming days and weeks.
On the chart we can see 3 strong levels that you can use for your trading decisions. The first level is at 105,544 USDT (0.382 FIB and POC of the symmetrical triangle). This level will most likely be tested in the near future after a breakout. That means Bitcoin can pump to 110k and then come back and retest this level before continuing higher. The second level is 110,342 USD. This level is also very strong because it's the 0.618 FIB extension from wave 1 to wave 2. It's also above the previous all-time high, so we can expect a liquidity sweep above this swing high and then a short-term downtrend. The third level is at 118,109 USDT. This is also a significant level because we have a 1:1 FIB extension, and you may know that Bitcoin reacts pretty reliably to this extension. It's one of the best.
From the Elliott Wave perspective, the price action is also bullish. We have just finished the ABC correction with a 1:1 FIB extension, and we have started impulse wave 3. This wave 3 could end at the 1:1 FIB extension as well, but we need to wait for chart patterns, trendlines, and potentially RSI bearish divergence.
This is my primary plan for the next days and weeks. The secondary plan is that the ABC correction (wave 2) has not been completed, and it can transform into a WXYXZ triple three corrective wave.
Write a comment with your altcoin, and I will make an analysis for you in response. Also, please hit boost and follow for more ideas. Trading is not hard if you have a good coach! This is not a trade setup, as there is no stop-loss or profit target. I share my trades privately. Thank you, and I wish you successful trades!
Falling Wedge

JASMY/USDT: BREAKOUT ALERT!!🚀 Hey Traders! Ready to Catch the JASMY Breakout? 👋
If this setup excites you, smash that 👍 and hit Follow for top-tier trade ideas that deliver real results! 💹🔥
JASMY is looking strong and bullish! 📈 It has broken out of a falling wedge on the 4-hour timeframe and successfully retested the breakout level. Now, it’s primed for a major move! Long some here and add on dips.
🔹 Entry Range: $0.031 - $0.033
🎯 Targets:
✅ Target 1: $0.038
✅ Target 2: $0.046
✅ Target 3: $0.054
✅ Target 4: $0.060
🛡 Stop Loss (SL): $0.0282
⚙️ Leverage: Use low leverage (Max 5x)
💬 Your Thoughts?
Are you bullish on JASMY’s breakout potential? Drop your analysis, predictions, or strategies in the comments! Let’s ride this wave and secure those gains together! 💰🔥


CELR/USDT: 80%+ PROFIT POTENTIAL SETUP!!🚀 Hey Traders! Ready to Catch the CELR Breakout? 👋
If this setup excites you, smash that 👍 and hit Follow for high-quality trade ideas that actually deliver! 💹🔥
CELR is looking primed for a breakout! 📈 It's breaking out from a falling wedge pattern on the 6-hour timeframe, signaling a potential 80-90% upside move! Now’s the time to long and add on dips.
🔹 Entry Range: $0.0146 - $0.0154
🎯 Targets:
✅ Target 1: $0.018
✅ Target 2: $0.022
✅ Target 3: $0.025
✅ Target 4: $0.028
🛡 Stop Loss (SL): $0.0135
⚙️ Leverage: Use low leverage (Max 5x)
💬 What’s Your Take?
Are you bullish on CELR’s breakout potential? Drop your analysis, predictions, or strategies in the comments! Let’s ride this wave and secure those gains together! 💰🔥

ONDOUSDT → Resistance Breakthrough. Ready for the raceBINANCE:ONDOUSDT.P continues to hold an uptrend with cyclical counter-trend corrections. The chart is showing signs of an end to the correction and a readiness to go up
A rather large consolidation has been formed against the background of the main uptrend. Regarding this, the price is trying to go up, breaking the resistance of consolidation (triangle) and overcoming the next obstacle in the form of key resistance at 1.538. The emphasis is on this level. If the bulls manage to keep the defense above 1.538 support, ONDO may show a recovery to 1.7 - 1.9 - 2.15 in the short to medium term.
Support levels: 1.538, 1.44
Resistance levels: 1.7344, 1.90
A small pullback to support and formation of a false breakdown is possible, but price consolidation above the level will be a confirmation of readiness to go up. Targets are marked on the chart!
Regards R. Linda!

$NYSE:OKLO breaking a Wedge/Flag with short term 25%-60% upsideNYSE:OKLO is breaking out of a consolidation pattern (falling wedge) And what appears to be a flag pattern.
Confirmation is a 24% uptick in price along with strong volume.
Initial Price Target is ~$34.50 to complete the falling wedge pattern, which is a short term 25% upside.
Secondary Price Target is ~$42.90 to complete the flag pattern, which is a longer term 60% upside
Good Luck!

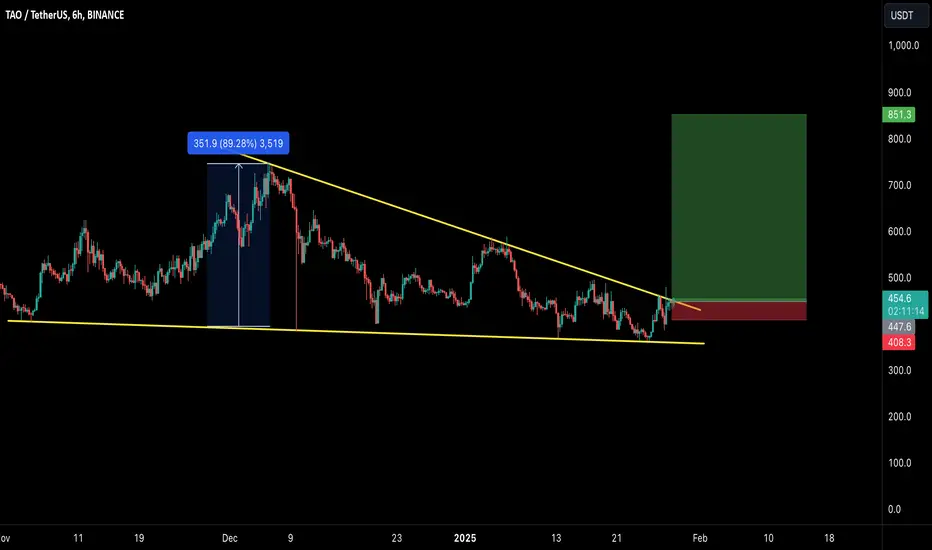
TAO/USDT: LOOKS READY TO GO ABOVE $800 MARK!!🚀 Hey Traders! Ready to Ride the TAO Wave? 👋
If this setup excites you, smash that 👍 and hit Follow for premium trade ideas that deliver real results! 💹🔥
TAO is looking primed for action! Breaking out of a falling wedge pattern on the 6-hour timeframe, it’s signaling a potential 80-90% upside move. 📈🔥
💡 Here’s the Plan:
📌 Entry Range: Current Market Price (CMP) and add more up to $430.
🎯 Targets:
Target 1: $530
Target 2: $620
Target 3: $710
Target 4: $850
🛡️ Stop Loss (SL): $400
⚙️ Leverage: Use low leverage (Max 5x) for a safer approach.
💬 What’s Your Take?
Are you bullish on TAO’s breakout potential? Drop your analysis, strategies, or predictions in the comments! Let’s crush this market and lock in those gains together! 💰🚀
EURUSD -Bullish Falling WedgeHello Traders !
On the daily time frame,
The EURUSD price formed a falling wedge pattern.
At the moment, The lower high is broken !
So, I expect a bullish move📈
_______________
TARGET: 1.05630🎯

The last bullish chance of TRUMP in short term!This could be TRUMP's last bullish chance. If TRUMP cannot hold the critical support at $23, the price will drop below $20. However, if it successfully breaks the wedge, it could rise to $43...
Give me some energy !!
✨We spend hours finding potential opportunities and writing useful ideas, we would be happy if you support us.
Best regards CobraVanguard.💚
_ _ _ _ __ _ _ _ _ _ _ _ _ _ _ _ _ _ _ _ _ _ _ _ _ _ _ _ _ _ _ _
✅Thank you, and for more ideas, hit ❤️Like❤️ and 🌟Follow🌟!
⚠️Things can change...
The markets are always changing and even with all these signals, the market changes tend to be strong and fast!!

TRUMP Breakout Alert: 100%+ Pump Potential from Falling Wedge!🚀 Hey Traders! 👋
If this setup gets you excited, smash that 👍 and hit Follow for trade ideas that actually deliver! 💹🔥
TRUMP is flashing bullish signals, breaking out of a falling wedge on the 1-hour chart. This setup screams potential for a 100%+ pump! 📈🔥
💡 Trade Setup:
📌 Entry Range: Current Market Price (CMP); add more on dips.
🎯 Targets:
Target 1: $31
Target 2: $42
Target 3: $51
Target 4: $60
🛡️ Stop Loss (SL): $24.80
⚙️ Leverage: Use low leverage (Max 5x) for safety.
💬 What’s Your Take?
Are you bullish on TRUMP’s breakout potential? Drop your analysis, predictions, or strategies in the comments below! Let’s crush this trade and lock in those gains! 💰🔥

HBAR/USDT: LONG SCALP SETUP!!🚀 Hey Traders! 👋
If this setup gets you hyped, smash that 👍 and hit Follow for trade ideas that deliver results! 💹🔥
HBAR is heating up! Breaking out of a falling wedge structure, signaling a strong bullish move ahead. 📈🔥
💡 Here’s the Setup:
📌 Entry Range: Current Market Price (CMP)
🎯 Targets:
Target 1: $0.355
Target 2: $0.386
Target 3: $0.418
🛡️ Stop Loss (SL): $0.325
⚙️ Leverage: 5x–10x (trade responsibly!)
💬 Your Thoughts?
Are you bullish on HBAR’s breakout potential? Share your analysis, predictions, or strategies in the comments! Let’s ride this wave and secure those gains together! 💰🔥

SONIC Analysis - What Shall we Expect !!!The price is within an ascending wedge and this can be a bullish signal for SONIC. However, we need to wait for this wedge to be broken and then wait for the price to rise. Currently, the price can be bearish because more funds have been injected into Bitcoin to allow Bitcoin to find more stability in the coming days.
Give me some energy !!
✨We spend hours finding potential opportunities and writing useful ideas, we would be happy if you support us.
Best regards CobraVanguard.💚
_ _ _ _ __ _ _ _ _ _ _ _ _ _ _ _ _ _ _ _ _ _ _ _ _ _ _ _ _ _ _ _
✅Thank you, and for more ideas, hit ❤️Like❤️ and 🌟Follow🌟!
⚠️Things can change...
The markets are always changing and even with all these signals, the market changes tend to be strong and fast!!

Gold at Resistance Zone>Technical Patterns>Potential DropThe U.S. economic Indexes released on January 16, 2025 , have implications for Gold ( OANDA:XAUUSD ):
Core Retail Sales m/m : ncreased by 0.4% , slightly below the 0.5% forecast, indicating moderate consumer spending.
Retail Sales m/m : Rose by 0.4% , under the expected 0.6%, suggesting a potential economic slowdown.
Unemployment Claims : Reached 217,000 , higher than the anticipated 210,000, pointing to a softening labor market.
These factors may lead to a weaker U.S. dollar and increased demand for gold as a safe-haven asset, potentially driving gold prices higher.
---------------------------------------------------
Now let's take a look at the Gold chart in the 4-hour time frame and see how much Technical Analysis can help us predict the trend of Gold in the coming hours and days.
Gold is moving in the Resistance zone($2,743-$2,700) and near the Upper line of the Ascending Channel , the upper lines of the Rising Wedge Pattern and Time Reversal Zone(TRZ) .
In terms of Classic Technical Analysis , Gold appears to be moving within the Rising Wedge Pattern .
According to Elliott's wave theory , Gold appears to be completing microwave C of the main wave Y . The wave count will change if the Resistance zone($2,743-$2,700) breaks .
Also, we can see the Regular Divergence(RD-) between Consecutive Peaks .
I expect Gold to start falling at least the Support zone($2,697-$2,689) and the lower line of the ascending channel after entering the TRZ and touching the upper line of the ascending channel and the wedge pattern.
Note: If Gold can break the Resistance zone($2,743-$2,700), we can expect an All-Time High(ATH) for Gold.
Be sure to follow the updated ideas.
Gold Analyze ( XAUUSD ), 4-hour time frame ⏰.
Do not forget to put Stop loss for your positions (For every position you want to open).
Please follow your strategy; this is just my idea, and I will gladly see your ideas in this post.
Please do not forget the ✅' like '✅ button 🙏😊 & Share it with your friends; thanks, and Trade safe.

BTC can Reach above $100k If It Manages to Break this ... !!As I said, this head and shoulders pattern is fake, and it turned out to be so. Now it can be said that the price is in a wedge, and if a breakout occurs, we will see the price rise above 100k .
previous analysis
and
The Crypto Market Game: How to Win Against Fear and Manipulation
Did you really think profiting from the current bull run (a comprehensive upward market) would be easy? Don't be naive. Do you think they’ll let you buy low, hold, and sell high without any struggle? If it were that simple, everyone would be rich. But the truth is: 90% of you will lose. Why? Because the crypto market is not designed for everyone to win.
They will shake you. They will make you doubt everything. They will create panic, causing you to sell at the worst possible moment. Do you know what happens next? The best players in this game buy when there’s fear, not sell—because your panic gives them cheap assets.
This is how the game works: strong hands feed off weak hands. They exaggerate every dip, every correction, every sell-off. They make it look like the end of the world so you abandon everything. And when the market rises again, you’re left sitting there asking, “What just happened?”
This is not an accident. It’s a system. The market rewards patience and punishes weak emotions. The big players already know your thoughts. They know exactly when and how to stir fear, forcing you to give up. When you panic, they profit. They don’t just play the market—they play you. That’s why most people never succeed: they fall into the same traps over and over again.
People don’t realize that dips, FUD (fear, uncertainty, doubt), and panic are all part of the plan. But the winners? They block out the noise. They know that fear is temporary, but smart decisions last forever.
We’ve seen this play out hundreds of times. They pump the market after you sell. They take your assets, hold them, and sell them back to you at the top—leaving you with nothing, wondering how it happened.
Don’t play their game. Play your own.
Give me some energy !!
✨We spend hours finding potential opportunities and writing useful ideas, we would be happy if you support us.
Best regards CobraVanguard.💚
_ _ _ _ __ _ _ _ _ _ _ _ _ _ _ _ _ _ _ _ _ _ _ _ _ _ _ _ _ _ _ _
✅Thank you, and for more ideas, hit ❤️Like❤️ and 🌟Follow🌟!
⚠️Things can change...
The markets are always changing and even with all these signals, the market changes tend to be strong and fast!!

AMD: Bullish Falling Wedge Pattern with $200 TargetAMD is forming a clear falling wedge pattern, a powerful bullish reversal setup. The stock has been making lower highs and lower lows within converging trendlines, suggesting accumulation and potential breakout. The pattern suggests strong accumulation phase and the breakout could trigger significant upside momentum.
Key Technical Points:
Clear falling wedge formation with converging trendlines
Declining volume indicating potential trend exhaustion
Entry Point: Current price level
Stop Loss: $100 (key support level)
Target: $200 (psychological resistance)
Risk/Reward ratio is favorable at 1:4, with $80 potential profit against $20 risk.

LQTY/USDT BREAKOUT ALERT: READY FOR 60-80% SURGE!!🚀 Hey Traders! 👋
If this setup gets you hyped, smash that 👍 and hit Follow for game-changing trade ideas that deliver results! 💹🔥
LQTY: Ready for Takeoff! 🚀
LQTY is looking primed for a big move! It just broke out of a falling wedge on the 4-hour timeframe and successfully retested it—setting the stage for a strong rally! 📈 Now’s the time to position yourself for the next leg up.
📊 Trade Setup:
Entry Range: CMP (Current Market Price) and add more up to $1.98
Targets: $2.34 / $2.76 / $3.12 / $3.72
Stop Loss: $1.84
Leverage: Keep it low (max 5x)
💬 What’s Your Take?
Do you see LQTY’s breakout potential? Share your thoughts, strategies, or predictions in the comments below! Let’s ride this wave and bag those profits together! 💰🔥

Falling Wedge Pattern: Cocoa FuturesThis is the map of how to trade this rare chart pattern.
This is a textbook sample of Falling Wedge continuation pattern that played out with impressive accuracy.
We have a strong uptrend in 2024 that has been changed
by a large consolidation that took place for the rest of 2024
as it has built the large Falling Wedge (continuation) pattern.
One should focus on the following crucial points and measurements:
1. breakout point where price rises above trendline resistance
it acts as a buy entry trigger (green segment)
2. stop loss - it is located below the lowest valley preceding breakout (red segment)
3. widest part of the pattern - use it to measure the distance to the target adding it to breakout point (blue arc)
4. target (yellow dashed segment)
all of above key parameters are highlighted on the chart.
It's amazing how accurately the price grew towards the target booking over 60% profit.
Next time you can use this map as a guidance.

SOLANA → Will a false breakdown be the cause of the rally?BINANCE:SOLUSDT is testing a previously broken downtrend boundary as part of a correction. Bulls are employing aggressive methods to keep defenses above key support ahead of Trump's inauguration, keeping hopes high
On the weekly timeframe, the market is supported by SMA50 support indicating a strong uptrend. The focus is on two strong levels: 204.75 and 175. These are the boundaries of the current range. A breakdown of any of the boundaries will play a key role in further price movement. But I consider the realization of resistance as a priority.
On D1 yesterday a false break of strong support was formed in the form of previously broken downtrend resistance. This indicates that the market is still in a bullish plane and on the background of upcoming important news this could have a favorable impact for the coin.
Resistance Levels: 203-204
Support levels: 183, 175
If the price starts to retest the support at 175 and form a consolidation with a gradual downward compression, the risk of breaking the bullish pattern will increase.
But, based on fundamental data, I expect a consolidation above 183 and further growth
Regards R. Linda!

EUR/USD Trade Plan Summary - Reversal
Entry: Place a Buy Stop at 1.04355, confirming a breakout from the falling wedge.
Stop Loss: Set at 1.01702, below the recent lower low to limit risk.
Take Profit: Target TP1 at 1.06993 and optionally TP2 at 1.09253 for extended gains.
Confirmation: Wait for a daily candle close above the wedge before activating the trade.
Risk Management: Risk 1-2% of capital and adjust position size based on the entry-to-SL distance.

On 4H BTC-USD a falling wedge or notWe have a 4H BTC-USD chart. Is this a falling wedge? Will we break out or go down again? Only time will tell...

NAOV - Oversold penny stockjust an oversold penny stock near the ATL. Could see a move to the base VWAP line (reversion to the mean). Wanting to break out of a big falling wedge formation. R/R seems reasonable.

ONDO/USDT Falling Wedge in Play Is it Set to Soar?Pattern
The chart is forming a Falling Wedge pattern, which is typically a bullish reversal structure.
Key Levels to Watch
Support Zone
Lower trendline support around $1.05.
Strong horizontal support near $1.00, making this a potential entry point for long positions.
Resistance and Target
If a breakout occurs, the expected upside target is $1.60+, with further momentum possibly driving the price even higher.
Insights
The falling wedge narrows as price action consolidates, indicating reduced bearish strength.
A breakout above the upper trendline would confirm a bullish move.
Trading Strategy
Look for confirmation of breakout or bounce from $1.05 or $1.00 before entering.
Set stops below $1.00 to manage risk.
Potential profit taking levels could be around $1.60 or higher depending on market momentum.
This chart signals a promising bullish setup. Monitor closely for breakout confirmation to capitalize on the potential upward move.

$NYSE:NRGV poised for a breakout with multiple Price TargetsThe global push towards a cleaner energy future is accelerating, but a significant piece to the puzzle remains: the intermittency of renewable energy sources like solar and wind. This challenge has fueled a market for energy storage solutions.
Energy Vault ( NYSE:NRGV ) develops sustainable energy storage solutions designed to utility-scale energy storage for grid resiliency. The company's proprietary, gravity-based Energy Storage Technology and the Energy Storage Management and Integration Platform are intended to help utilities, independent power producers and large industrial energy users.
The company recently announced a significant 1.0 GWh energy storage project in Australia, which was highlighted by the CEO in a recent interview with MarketBeat's Bridget Bennett. Energy Vault's most recent project serves as a testament to its unwavering commitment to global expansion, underscored by the recent recognition it received from TIME magazine as one of the Best Inventions of 2024 for its groundbreaking gravity energy storage technology.
Analysis
Looks like this is setting up to break the $2.56 resistance line.
Observations:
This appears to be ready to break out of multiple patterns, which will present multiple near term price targets
$1 upside (~$4)... very close to the head and shoulders pattern PT of $3.80.
Falling wedge pattern PT of $7.17
- Squeeze momentum is building and firing.
- Current volume doesn't come close the the recent spike, but it is above the MA volume.
Entry Point ~$2.60 (or above) - after a closing above the $2.56 resistance
