Radix ready to break the falling wedge?Look at the chart where Radix/#XRD is probably(!) ready to break the falling wedge. It can also going back downwards before it goes higher. So do your own research!
Fallingwedgepattern

BTC Long Falling WedgeBTC still bearish so this trade should be taken only by small amounts or low leverage. According to the graph it formed a falling wedge pattern and already had a breakout. If this is really a wedge it make sense to bounce on this low timeframe bullish OB as it also created a break of structure.
Always put a stop loss and make sure to only have low leverage on this trade if you want to go with this.
Happy Trading.

QCOM-Has Two Bullish Patterns!Patterns Identified -Falling Wedge & Bullish Engulfing patterns weekly chart!
QCOM filled a gap from November 4, 2021. I can clearly see that QCOM is going through price correction (ranging). If you take a closer look it has popped out of the upper trend line slightly. Take a look at the yellow box to verify. I've identified a bullish engulfing that leads me to believe that the stock has potential to break the channel and move to the upside. However, if it breaks the bottom of our channel, then we should expect to see price go down. However, a falling wedge pattern was identified with confluences (rising volume and momentum).
Therefore, I am bullish on QCOM.
My entry will be based on these findings to include the patterns identified. A break of the recent candle and channel will be my signal to enter a swing position.
*This is not financial advice.
Freedom & peace is prosperity,
MrALtrades00
Gap up from November 4,2021
Falling Wedge
Bullish Engulfing inside Falling Wedge pattern!


BNBUSD -Falling WedgeWill Price continue in the wedge and maybe a possible breakout to the upside for trend continuation or break out to the downside towards the weekly support?
This is another trading opportunity for crypto and Binance traders.
Binance has been in a falling wedge on the 4hr after printing a head and shoulder pattern on the weekly timeframe...
If going in for a Buy, Trade with caution, Stoploss below the Support and profit target at resistance....

ETHUSDT needs to have a breakout from it!On the monthly timeframe, the price got a rejection from the 0.5 Fibonacci level and on the weekly timeframe, the price created a higher low.
the price is creating a falling wedge on the 4h timeframe and now the price is testing the daily dynamic support.
how to approach?
IF the price is going to have a breakout from the falling wedge and retest the 4h resistance as new support, According to Plancton's strategy , we can set a nice order
–––––
Keep in mind.
🟣 Purple structure -> Monthly structure.
🔴 Red structure -> Weekly structure.
🔵 Blue structure -> Daily structure.
🟡 Yellow structure -> 4h structure.
–––––
Follow the Shrimp 🦐

RIOT bullish falling wedge!As many of my followers know, I am typically not one to talk about stocks (as my username indicates, I largely talk about cryptocurrencies). However, I do typically make exceptions when the stocks deal with crypto and/or blockchain.
In this example, I want to call out the falling wedge that has occurred with RIOT blockchain. Since the all-time high (ATH) at the beginning of 2021, the price has falling over 85% to the bottom of what looks to be a falling wedge that is forming, which is often a bullish sign. This bullish trend looks further confirmed by MACD forming a nice "reversal" divergence (dotted white lines on price and MACD) indicating that a reversal very well might be in order soon.
There is still some downward potential however, and the general market for both stocks and BTC could easily drag the price of RIOT further down, however, the trend for now looks like a reversal is at least possible for RIOT.
But as always, this is just my opinion and in no way should be taken as financial advice. However, please like or comment if you agree or see anything in addition.

BTCUSDT | Falling Wedge Bullish Divergence - Dump&Pump@VP POC?Price action and chart pattern trading setup:
> Falling Wedge pattern with bullish divergence signal
> A possible dump & pump at volume profile point of control VP-POC?
> Entry @ Falling Wedge Breakout?
> 1st target @ upper resistance of parallel channel zone B and D position - upside +15% / +25%
> Stop-loss @ C position zone - downside -7 /- 10%
> Risk Reward Ratio : 2:1 for short term trade.
Indicator:
> Smart money volume support X1.8 - 2
> Banker chip entry signal
> Fund flow bullish reversal pattern
> BBD bullish divergence just below baseline zero.
> KDJ stochastic bullish divergence coming out of oversold zone
Always trade with affordable risk and respect your stop loss.

ALICEUSDT is creating a falling wedge. Ready for breakout?The price is creating a descending channel on the daily timeframe and the price created a double bottom on the monthly support on 5.7$.
On the 4h timeframe the price is trying to create a new higher high inside a falling wedge. After the first impulse the market is testing the 0.5 Fibonacci level.
How to approach?
The price needs to have a breakout from the falling wedge and descending channel, flip the key level on 6.4$. IF the price is going to have a breakout According to Plancton's strategy , we can set a nice order
–––––
Keep in mind.
🟣 Purple structure -> Monthly structure.
🔴 Red structure -> Weekly structure.
🔵 Blue structure -> Daily structure.
🟡 Yellow structure -> 4h structure.
–––––
Follow the Shrimp 🦐

LUNA/USDT : Moving into a formed falling wedge ! BINANCE:LUNAUSDT
Hello everyone 😃
Before we start to discuss, I'll be so glad if you share your opinion on this post's comment section and hit the like button if you enjoyed it!
$LUNA has formed a falling wedge which is bullish in majority; But as we all know, The leading bias on market is bearish.
Also $LUNA is moving above a critical S/R zone and it's important to hold!
That's why the chart comes up with two possible Scenarios...
📈 Bullish Scenario : If $LUNA breaks above the wedge, Then the terms for bulls will comes up with a bullish continuation; But it need to break above the $92's S/R line for further movement!
- You can locate your Longs on a proper retest of $92's broken line towards $98's resistance zone.
📉 Bearish Scenario : If $LUNA breaks below the wedge, Then the terms for bears will comes up with a bearish continuation; Also on the Wedge's rejection, We'll face the S/R zone's rejection neither.
- That makes this opportunity for Traders to located their Short on a proper retest of broken points ( Wedge or Zone ).
Hope you enjoyed the content I created, You can support us with your likes and comments!
Attention: this isn't financial advice we are just trying to help people with their vision.
Have a good day!
@Helical_Trades

SXP weekly falling wedge + rsi divergence formingIf we see a breakout of this in the next weeks, be ready to long this and go for a 3x maybe
Big risk but R/R is quite good here imo lol
I'm waiting for this scenario to be confirmed

CELR Faliing Wedge 4H TF, time to buyWe can see that 4 hour RSI is low and supported by a falling wedge pattern.
Buy: 0.061 - 0.067
TP : 0.09
SL : 0.059


NZDCAD potentially continue its bullish movementcurrently, we are seeing the price trapped inside the falling wedge pattern and potentially move to the 0.88830 resistance level as the price target. I will wait for the price to break out of the resistance structure before placing any buy order. good luck traders!
**Disclaimer** the content on this analysis is subject to change at any time without notice, and is provided for the sole purpose of assisting traders to make independent investment decisions.
Traders!! if you like my ideas and do take the same trade as I do, please write it in a comment so we can manage the trade together.
_____________________________________________________________________________________________________________________
Thank you for your support ;)
GWBFX


SLP Bullish for long termSLPUSDT has now candle closed above the falling wedge pattern. Bullish divergence appearing as well in the 1H TF. We might reach the following levels: 0.0204, 0.0217, and 0.0235. High volume rally back in February 10 and it has been a low volume correction ever since. Big pump is incoming. If you bought SLP at the previous dip, it would be a 50% profit for short term and a 160% profit or possibly higher for long term. HODL SLPUSDT

IOTA / ETH - Falling wedge patternIf the long term pattern is true then amazing 1110% is the target.

OKTA Falling Wedge and Losses Exceeding ExpectationsOKTA is bearish from both fundamental and technical perspectives.
The falling wedge has a price target of $140 before a bounce and the company said billings rose 91% to $603 million vs. estimates of $497 million.
Since the earnings are negative, 266Mil in 2021 and the Market Cap is high, 28.418Bil, OKTA is still a growth stock from which investors have high expectations.
When investors see weaker forecasts or expenses increase, on rising interest rates, they are tempted to sell.
In this case, my price target is the $140 support.
Looking forward to read your opinion about it.

Can this happen?? I can see a falling wedge pattern today... And i can see 1:2 RR. Whats your opinion on this prople??? I'm sure today is a sideways day.. let me know your opinion
And let me know when do u enter?? Exactly at the Breakout or at the retest??


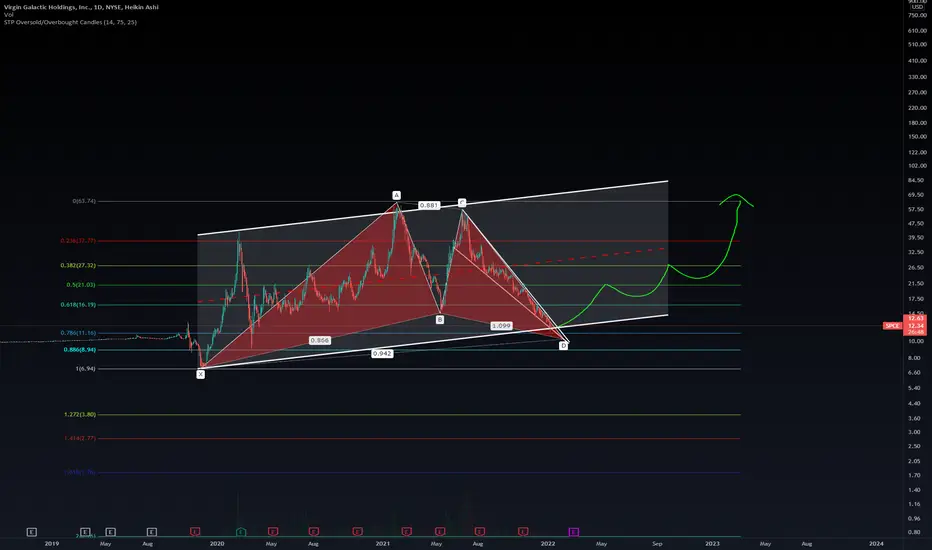
Virgin Galactic Major Shark SetupMajor shark pattern setting up here month bullish divergence near a critical support range has just been dumping for months now so lots of build up --
Push play! See you at $50-$60 in a few months :)
FLOKIUSDT is creating a falling wedge 🦐FLOKIUSDT is creating a falling wedge on the daily support.
IF the price is going to have a breakout, According to Plancton's strategy (check our Academy ), we can set a nice order
–––––
Follow the Shrimp 🦐
Keep in mind.
🟣 Purple structure -> Monthly structure.
🔴 Red structure -> Weekly structure.
🔵 Blue structure -> Daily structure.
🟡 Yellow structure -> 4h structure.
⚫️ Black structure -> <4h structure.

TatasteelTatasteel broke out of falling wedge channel & also resistance zone of 1120=1125 with decent volumes.
Could be bought with mentioned stoploss & targets.
