Gold will continue to rise after a false breakdown The price is trying to consolidate above the key support zone 3290 - 3300. As part of the correction, gold makes a false breakdown and the market starts to show a bullish reaction.
The only confusing thing is the coming news. If the buyers are able to keep the price above 3300, the gold will surely continue its upward trend
Scenario: price consolidation above 3300 after a false breakdown of support will be a good signal for a swing impulse towards the intermediate high of 3345.
Falsebreakdown

SOLUSDT may rise to 200.0 after long-squeezeMarket maker collected liquidity from 168.5 (liquidation of buyers, entry of sellers and subsequent liquidation of sellers)
After a false breakdown the price went up on a light wave
After the long squeeze, the price is already going to continue the trend with peace of mind.
Ahead is a strong resistance from D1 180 - 180.3.
A break of the level will attract buyers. The target may be 200 - 205
Scenario: a retest of the resistance may end in a small correction. If there is no reversal and the price continues to test 180-180.3, we can expect a breakout, which may attract buyers and further growth to 200 - 205.

GOLD → False breakdown and change of mood...FX:XAUUSD is strengthening after a false breakdown of support at 3288, with the change in fundamental sentiment due to US statements on the tariff war also providing support for the price.
On Thursday, gold rose from a weekly low of $3,260, supported by a weaker dollar and renewed concerns about US trade negotiations with China and Japan.
Optimism about tariff cuts quickly faded after denials from the White House. Weak US business activity data is fueling talk of a possible Fed policy easing, which is also supporting gold. The markets remain focused on trade news and Trump's statements.
Technically, gold could reach the liquidity cluster at 3314 and continue to rise towards strong resistance at 3370.
Resistance levels: 3342, 3370, 3387
Support levels: 3314, 3288, 3270
Below 3314 and below 3288, a liquidity pool has formed, which the market is likely to test before continuing its growth. It is too early to talk about a resumption of a strong rally, as the situation between the US and China is complicated, as are the negotiations on the situation in Eastern Europe, which seem to be moving towards talks, but every time something goes wrong...
Best regards, R. Linda!

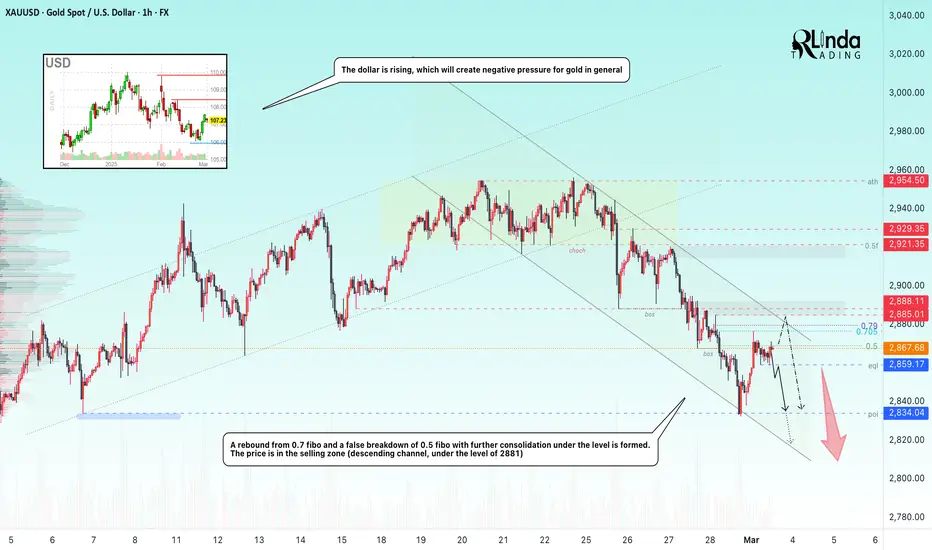
GOLD → Local downtrend, price under bearish pressureFX:XAUUSD has been strengthening since Friday. Standard reaction to the false break of the support at 2834. Price is still in a selling zone and heading for resistance before a possible pullback to the downside.
The $ has strengthened strongly over the past week and looks poised to continue its rise, but it all depends on the tariff war, economic risks and regulatory policy in the US.
Markets are reacting to attempts to regulate the war in eastern Europe. Ahead are Fed statements and US economic data.
On 4H, gold is trading flat 2881 - 2834. Below 2881 gold is under bearish pressure (selling zone). But, due to the liquidity created in the 2878 - 2881 area, gold may test the area of interest before returning to the downside.
Resistance levels: 2869, 2877, 2881
Support levels: 2859, 2834
At the moment consolidation is forming below 2869 (0.5 fibo) after a false breakdown. If the bears keep the price under the level, the decline may start earlier. We also have another trigger - 2859. A breakdown of this support will trigger a sell-off and liquidation, which may lead to a fall to 2834.
Regards R. Linda!
NQ Power Range Report with FIB Ext - 5/15/2024 SessionCME_MINI:NQM2024
- PR High: 18427.00
- PR Low: 18402.00
- NZ Spread: 56.0
Key economic calendar events
08:30 | CPI (3x)
- Retail Sales (2x)
10:30 | Crude Oil Inventories
AMP temp margin req increase for expected vol spike, pre-RTH
- Prev session ad for rollover short turned into liquidity for new week highs
- Holding prev session highs below the close
- Daily print showing momentum on return to March, early April range
Evening Stats (As of 12:05 AM)
- Weekend Gap: N/A
- Gap 10/30 +0.47% (open < 14272)
- Session Open ATR: 247.17
- Volume: 17K
- Open Int: 245K
- Trend Grade: Bull
- From BA ATH: -1.4% (Rounded)
Key Levels (Rounded - Think of these as ranges)
- Long: 18675
- Mid: 18106
- Short: 16963
Keep in mind this is not speculation or a prediction. Only a report of the Power Range with Fib extensions for target hunting. Do your DD! You determine your risk tolerance. You are fully capable of making your own decisions.
BA: Back Adjusted
BuZ/BeZ: Bull Zone / Bear Zone
NZ: Neutral Zone

SPX: Volatile? Yes. Scary? No.Hello traders and investors! The SPX did exactly as we planned in our last analysis, and now we are just bouncing back up again. The link to my previous public analysis is below this post, as usual.
We are in a strong bullish momentum, but hardly it’ll keep going up without a pullback , and the 21 ema is there to support the price, along with the 4,322.
The index did fill its previous gap at 4,322 as we expected, since we lost the red line at 4,366 , and we did a sharper pullback seen in the daily chart as well.
Yes, the SPX hit our mid-term target at the black line around 4,289, and it did what seems to be a false breakdown , which happens when the price closes under the previous support, but the next day it quickly recovers, and closes above the support line again.
This situation is very frustrating for the bears, as it shows a lot of weakness on their part. The index couldn’t even retest its purple trendline yet (last time we touched it was in March).
As usual, all we can assume is that the index will continue its bullish momentum. However, if the index loses the 4,289 again then I’ll be more convinced of a sharper pullback to its trendline, or to the previous support at 4,167. But this is a big “if”. For now, let’s not assume things, and just react to the facts.
If you liked this analysis, remember to follow me to keep in touch with my daily updates, and please, support this idea if it helped you!
Thank you very much!

BBAR Technical Analysis 🧙Banco BBVA Argentina SA is a banking services provider in Argentina. It provides financial assistance to large corporations, small and medium-sized companies, as well as individuals. The bank provides services through retail, corporate, investment banking, and Small and medium-sized companies divisions. Through the retail banking segment, it provides banking products and services to individuals, corporate banking deals with services to corporates, the small and medium-sized companies segment focused on foreign trade, agricultural business, and digital products. The company's geographical segments are Spain, the United States, Mexico, Turkey, South America, and the Rest of Eurasia.
If you understand the idea,🎯 press a thumb up! 👍 Have a question? Don't be shy to ask! 🤓 Interested to study how to analyze charts, follow me!

DSS Technical Analysis 🧙Document Security Systems Inc operates in the security and commercial printing, packaging and plastic ID markets. The company develops, markets, manufactures and sells paper and plastic products designed to protect valuable information from unauthorized scanning, copying, and digital imaging. It is organized into the operating segments of Packaging and Printing; Plastics; Digital; Technology management; and Corporate. The Packaging and Printing, and Plastics segments, which are the key revenue-generating segments, are engaged in the printing and production of paper, cardboard and plastic documents with a wide range of features designed for the protection of documents against unauthorized duplication and altering.
If you understand the idea,🎯 press a thumb up! 👍 Have a question? Don't be shy to ask! 🤓 Interested to study how to analyze charts, follow me!
