CNF Technical Analysis.If you understand the idea,🎯 press a thumb up! 👍👍👍 Have a question? Don't be shy to ask! 🤓 Interested to study how to analyze charts, follow me!
Falsebreakout

ED Technical Analysis.If you understand the idea,🎯 press a thumb up! 👍👍👍 Have a question? Don't be shy to ask! 🤓 Interested to study how to analyze charts, follow me!
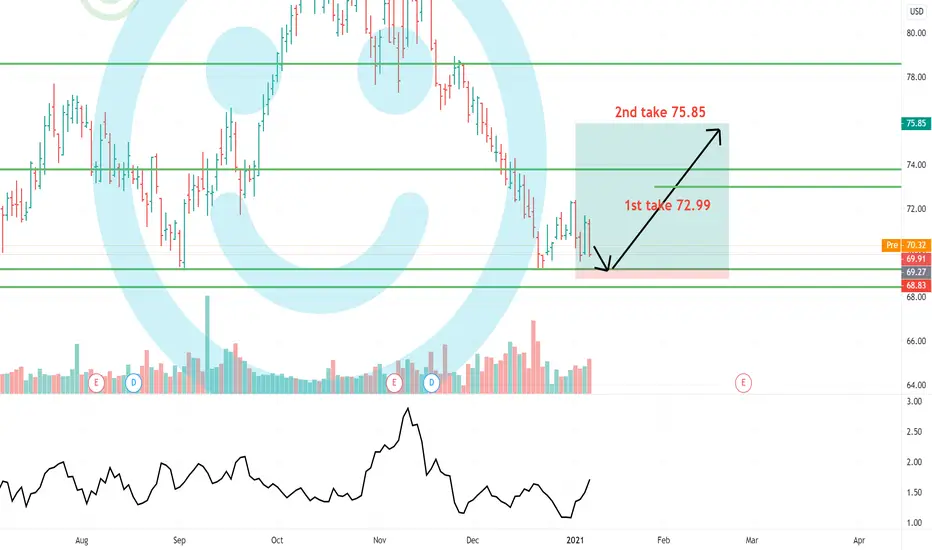
$UPWK Last Bull Run before Bearish Divergence
$UPWK has been climbing steadily but the RSI and MACD are showing a Bearish Divergence Set Up
Even If the stock is a good value play - there is always room for capturing the volatility for profit

NVDA, false break-down & catalystNVDA tested the support line, made a false breakdown.
In addition, news that NVDA got picked by NIO for its self-driving solution.
We are after a period of balance.
All of this supports that a strong move up is possible.
Also, this pattern is very similar to AMD, before it made its huge move up...
Stop loss @ 504.96
if it gets there, there is a strong possibility that the false break-down was a CRACK, and the stock will make a large correction.

CALA Calithera Biosciences Inc is a clinical-stage pharmaceutical company. The business activity of the firm is functioned through the region of US. It focuses on discovering and developing small molecule drugs directed against tumor and immune cell targets that control key metabolic pathways in the tumor microenvironment. Its lead product candidate is CB-839, an inhibitor of glutaminase for the treatment of solid tumors. Its other product candidate, CB-1158, is being developed for hematology and oncology indications.
If you understand the idea,🎯 press a thumb up! 👍👍👍 Have a question? Don't be shy to ask! 🤓 Interested to study how to analyze charts, follow me!

SRPT Technical Amalysis.If you understand the idea,🎯 press a thumb up! 👍👍👍 Have a question? Don't be shy to ask! 🤓 Interested to study how to analyze charts, follow me!

How do you think it's going to playout? If you understand the idea,🎯 press a thumb up! 👍👍👍 Have a question? Don't be shy to ask! 🤓 Interested to study how to analyze charts, follow me!

ATOS Technical Analysis.If you understand the idea,🎯 press a thumb up! 👍👍👍 Have a question? Don't be shy to ask! 🤓 Interested to study how to analyze charts, follow me!

BHTG Technical Analysis.If you understand the idea,🎯 press a thumb up! 👍👍👍 Have a question? Don't be shy to ask! 🤓 Interested to study how to analyze charts, follow me!

CCRC Technical Analysis.If you understand the idea,🎯 press a thumb up! 👍👍👍 Have a question? Don't be shy to ask! 🤓 Interested to study how to analyze charts, follow me!

ZCMD Technical Analysis.If you understand the idea,🎯 press a thumb up! 👍👍👍 Have a question? Don't be shy to ask! 🤓 Interested to study how to analyze charts, follow me!


IOTA Potential Move Upward to the 0.3677 Mark 🚀🚀🚀💡 Trade Idea
📉 Buy Limit IOTA/USDT @ 0.2781
🎯 Target Profit 0.3677
🛑 Stop Loss 0.2498
❌ Do not risk more than 1 % of your account on each trade
🙂 Good Luck !
Description:
The price managed to break and close above the white trendline by posting a bullish engulfing candlestick. A pullback has been noticed to the 61.8% level (0.2775) indicating a potential reversal towards to the upside.

AUDNZD Turning LowerCurrently in a position here, looking for rallies to sell ~ AN is losing it's steam and I think we will see another retracement lower now that we are back in side Trendline ~ Couple that with the Blow Off Top Rally in AUDUSD and this could pan out as a very nice trade if we see some incoming Aussie weakness

EURJPY continues the rangeEURJPY continues the range
Since the beginning of December, EURJPY has entered a sideways movement and is moving in the range of 100 pips.
A few days ago we saw a break, but very quickly the price came back.
The direction will become clear only after a definite break and test, but for those who are looking for an earlier entry and a much better risk-return ratio, the entry may be soon.
We are watching for a false break of the support, which will allow us to enter in order to:
127.18
127.66
128.10
If you have questions about how to trade this or another situation, contact us!
To support us, like and comment!
HAPPY HOLIDAYS!


EURCAD on a retracement move 🦐EURCAD on the 4h chart attempted to break the 1.54500 resistance area without success,
The price from there got rejected and now testing a resistance structure.
IF the market will break above we can set a nice long order according to Plancton's strategy.
--––
Follow the Shrimp 🦐
Keep in mind.
🟣 Purple structure -> Monthly structure.
🔴 Red structure -> Weekly structure.
🔵 Blue structure -> Daily structure.
🟡 Yellow structure -> 4h structure.
⚫️ Black structure -> <4h structure.
Here is the Plancton0618 technical analysis , please comment below if you have any question.
The ENTRY in the market will be taken only if the condition of the Plancton0618 strategy will trigger.
Leave a comment that is helpful or encouraging. Let's master the markets together.

Bitcoin Decision Time/AreaI think Bitcoin ( BTC ) is in an important time and area of decision making. In my previous ideas, I wrote to you about 18300 - 18400 that it is an area that if it is broken the correction is started.. In this idea I want to talk to you about how we call a price area, BROKEN??
Support and resistance areas that are strong and the price was above or below them for a long time, are hard to break. In most of occasions that I experienced, the first time that price can successfully break the area is not actually a breakout but it will be failure, but I can say that will happens 100%, it's just an experience.. Whenever we come this occasions, I believe there is a good solution that we can check other technical and fundamental indicators to make sure how the market is going to react..
The best solution in my opinion is that we should WAIT!!!
Scenario 1: If this is a False Breakout, Bitcoin will keep on moving higher and there will be a good opportunity for us to make a long position around 18500 - 18600, and our first resistance area will be around 18900..
Scenario 2: If this is a True Breakout, Bitcoin will go downwards and there will be an awsome opportunity for us to make short position around 17550 17600 and our first support area will be on 17000 but I see much more deeper targets because if BTC go down this is a big correction a I told you in previous ideas..
I hope you enjoy this idea, feel free to ask me any question about it or tell me about your idea..


$EURUSD-Banking on a False Breakout? - Working with Levels (SMT)Yes, I know my chart looks Sloppy, but when you analyze the 5min chart for price action, it's going to look that way. Now...
First Piece to this puzzle DXY RSI divergence with Price Action. Looks like we should see a bullish Dollar after breaking a new low. And I wouldn't trade this Until we have confirmation that it does break a new low and/or comfortable with the fact that we can confirm a bullish dollar. Otherwise this trade will be a waste of money and time.
Second, there are baked in unseen natural support and resistance prices that take place at the 0 ,2 ,5 ,8 levels. We say this last time when EURUSD dropped good ways from when it hit 1.18800 a few weeks ago. So therefore I have a few levels in place anticipating such action. 1.195, 1.198 nd 1.2, Where the previous high was reached. If I get a 30 pip drop from any of these levels, I think it would be wise to pay yourself and move stop loss accordingly after doing another evaluation to mitigate losses. Check to see if the low has been broken and where this falls in comparison to the baked in Support/Resistance levels. I would personally trade the false breakout at that point depending on If when it happens.
Third, Yes, we did break a high, yes the 4 HR and Daily are possibly going to have a closed candle above the "Resistance." Does that guarantee a breakout? Usually.. never. It takes time to build out from the Market Maker Buy/Sell Model and I believe we're at the top or nearing the top of a sell.
However, I'm not sure it would be in my best interest to trade this on a Friday. Or Monday for that Matter. However, if you're a swing trader, you can definitely use this as a False Breakout set-up. Multiple levels on the left where price action has occurred previously that may result in a reversal so these are key levels at which I like to analyze when reach and see if there is a need to take profit or not.
We shall see as price moves along throughout the day, I'll be watching the DXY and the EU to see if I would pull the trigger.
I could be completely wrong about this, but what do I know. I'm just some guy who likes to post his ideas.
Good Luck and Good Trading.


NZDUSD 0.68156 + 0.68% SHORT IDEA * PRICE ACTION & CORRECTIONHEY EVERYONE
Here's one on the NZ DOLLAR / US DOLLAR PAIR that rallied up with the bulls broke the resistance level 0.68106 now support as the pair retested this structure likely signalling continuation with the bull but i'm targeting a correction of this move to the upside as the pair is overbought on most indicators and is showing signs of slowing down in momentum will be approaching this one with pending orders and if possible tight stop.
for entries we scale down to smaller time-frames to determine entries and so forth.
many stars must align with the plan before executing the trade, kindly follow your rules.
LET'S SEE HOW IT GOES..
HAPPY TRADING EVERYONE & LET YOUR WINS RUN...
_________________________________________________________________________________________________________________________
ENTRY & SL - FOLLOW YOUR RULES
here's some of my rules if they help.
1. look at structure be it descending channels, pennants and so forth.
2. RSI is overbought/oversold so will be looking for a pull back to structure before continuation.
3. will be looking for entries from 30M , 1H, 2H & 4H time-frames if taking the trade long term.
4. aggressive trades can be executed on the pull back
5. price action must definitely align with the plan.'
6. structure definitely
7. the 20 EMA must be respected as support / see a bounce at this structure
8. FIBONACCI EXTENSIONS AS GUIDELINES FOR SL & TP'S .
9. CANDLE STICK PATTERNS.
so i will most like's enter this one in a bit but i hope this idea assists in any way on your trading plan.
RISK-MANAGEMENT
PERIOD - SWING TRADE
__________________________________________________________________________________________________________________________
If this idea helps with your trading plan kindly leave a like definitely appreciate it.
