Falsebreakout


KMT divergence on descending channel false breakoutPros:
- Force Index making lower highs when prices are reaching higher highs.
- MACD bullish divergence
- SMA 200 bounce
Cons:
- Stock started to make higher lows. (More bullish)
Trade Grade: 6/8
- Profit potential: Average 1
- Divergence: Good 2
- Candle signal: Good 2
- Emtry timing: Average 1
- Counter trend trade?: No (0)

IT´S YET AGAIN ANOTHER FALSE BREAKOUT ON BITCOIN(Maybe the last)So China news came out, everyone feeling like a record rally since 2017 is set to change the whole bearish structure since the start of the summer... Guess what. Drawdown will go up for many of whom goes long before price begins to do higher lows & higher highs.
People are obsessed saying fundamentals move the price of Bitcoin every day. FAR FROM THE TRUTH.
It definitely moves altcoins along price levels, specially the ones linked to China like Tron, OmiseGo, etc... the releaseof the Chinese news impacts directly on the projects, same happens to them coins. But, according to Bitcoin´s price action, any gigantic news from the cryptoworld barely has any effect on it. At least not important for a day trader using timeframes from H1 to weekly.
Are you fundamental crackheads really trying to say that the start of this last weekend rally on Bitcoin, where price bounced off from a 50.0 % retracement + "high priority" demand line + lower line of a falling wedge + HUGE bullish divergence on simple price oscillators is simply because China is set to develop a whole new Blockchain environment ?
According to Wyckoff analysis, when composite operators begin a campaign to accumulate shares, contracts, etc., what happens inside consolidation periods or trading ranges cannot be analyzed without volume spread analysis. Here comes an updated H4 chart of BITFINEX:BTCUSD :
Last weekend´s rally has been planned since the 24th September´s breakdown!!
Conclusion.
Only expect Bitcoin to be bullish again above $10,000 / $11,000, and even before reaching these price targets a sequence of easy-eyed higher highs + lower lows with specially growing volume on bull candles closing at its highs shall be mandatory fro longs. According to Elliott analysis, a new bullish cycle could be on its way soon. Just try not to jump in early and wait for corrections on low volume and bullsih price action confirmation at the end of these setups.
Have a good week everybody, happy trading and be safe !!
@Mikephicc

ESNT Short on Ascending Channel false breakoutPros:
-RSI overbought
- MACD and Force Index divergence
Cons:
- Counter trend trade
Overall Trade Grade: 75% (9/12)
Trend: 0/3
MACD: 3/3
Force Index: 3/3
RSI: 3/3

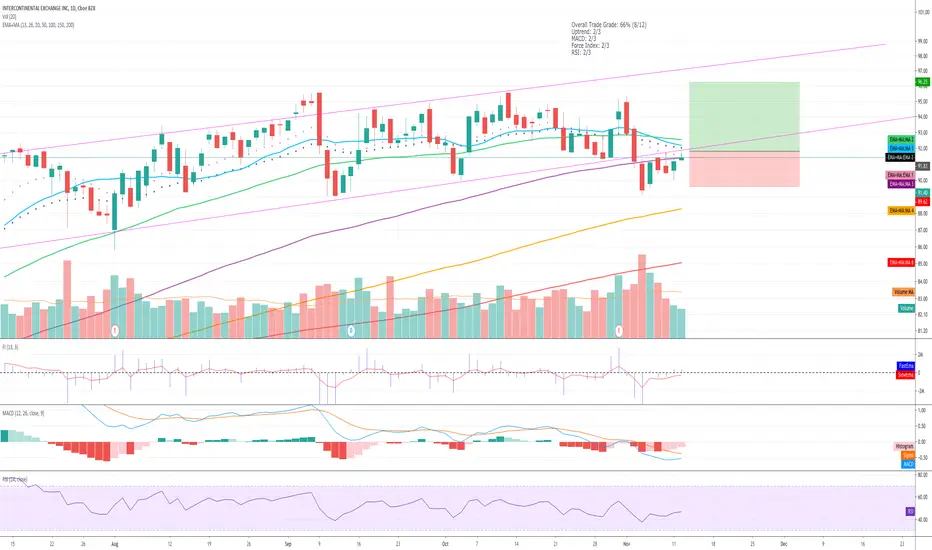
ICE Long on Ascending Channel false support breakoutPros:
- MACD and FI confirm the move by ticking higher with prices
- Inverted Hammer + Hammer combo
- Overall high lows near SMA 100. Shows bulls strong attempt to push back above sma 100
- Cons:
Volume is decreasing as price increase in general near the sma100. (I ignored this because I am testing the theory to depend on FI instead of just pure volume)
Overall Trade Grade: 66% (8/12)
Uptrend: 2/3
MACD: 2/3
Force Index: 2/3
RSI: 2/3
USDCAD False Breakout?
STRATEGY: False Breakout Strategy/Counter-Trend
Long Term Trend Time Frame: 1D/4H
Focus Time Frame: 1H
Market Condition 1D:
Short Term: Downtrend (based on 100ema)
Long Term: Sideways
Market Condition 1H:
Short Term: Sideways
Long Term: Uptrend (based on 100ema)
Area of Value (AOV)
Resistance: 1.32915 - 1.33813
Support: 1.31118-1.30205
Entry Trigger:
1H: Bearish Engulfing
Entry Price (EP): 1.32216
Stop Loss (SL): 1.32426
Take Profit (TP): 1.31234
RRR: 4.68
Analysis:
1H: Price boke above minor resistance but immediately followed by bearish engulfing. Found support at descending trendline, however, price seems struggling reaching new high (pin bar was also formed rejecting higher price). These could be a sign of False Breakout.
NOTE: This post is for my reference/journal purposes only. Trade at your own risk.

GBP/USD Buy if it makes a false breakoutHello,
After this, I think that GBP/USD will go long if it makes a false breakout from the resistance/support line.
I would like to say that I'm still learning and that I'm not an experienced trader.
Thank you & good luck.

Bitcoin: Stuck But Probability Still Favors The Bulls?Bitcoin is now poised to push into the 9Ks thanks to the development of the higher low formation around the 7830 area which coincides with a triple bottom as well. Formations and price structures are just another way of expressing probabilities and these patterns clearly favor higher prices at the moment. In this article I will highlight the elements that keep us in our swing trade long that we entered 3 weeks ago (while the general consensus among the "experts" has been bearish).
Over the previous weeks, I have been writing about the high probability of false breakouts in this environment, particularly to the short side. And so far, I continue to be right. How do I know this? Is it through some magical combination of 15 oscillators on my chart? My perspective comes from having a clearly defined structure and purpose behind my evaluation and trading processes. As a swing trader, I am ONLY interested in information that provides clues relative to broader market movements. And knowing whether or not this particular market is in a trend on THIS time frame is the key to gauging REALISTIC expectations. (You will not gain this perspective from a 1 hour chart).
Here are the elements that allow us to maintain our long from 8425.
1. Triple bottom formation around 7600 support. This minor support level has been in play for almost a month. It tells us one very important thing: Bitcoin IS NOT bearish. Weakness usually takes hold and follows through FAST, and that is NOT happening here.
2. Higher low formation established at 7830 area. Every time Bitcoin tries to push lower, the selling is being absorbed at slightly higher prices. This provides evidence that accumulating continues to take place while luring more shorts.
3. Large bullish candle off of support area. After a couple of inside bars, the appearance of a larger bullish candle is now in play. This further confirms that buyers are active around the 7600 to 7800 area.
4. NO TREND. The fact that Bitcoin cannot break below 7600 or above 8500 makes for a strong argument that this market is inside a range within a larger range (14K to 7600). Are we near the lower part of the range, or higher part? The answer points to where price is more likely to go from here. (That's why shorting break outs here is a very HIGH risk idea).
5. A break and close above 8500 should trigger another wave of short covering. Based on the broader location, and the technical developments, probability favors a larger magnitude short squeeze. This is where a positive news catalyst can come out of no where and catch unsuspecting 1 hour chart enthusiasts off guard. A move like this can lead to a test of the lower 9Ks over a multi week period.
6.Any bear arguments left? We do NOT short Bitcoin, but always evaluate the bearish perspective. The only thing that can negate the bullish argument is IF price lingers around this area for too long. Why? Just like when too many shorts get caught, too many longs can get lured the same way. When order flow becomes dramatically imbalanced, any little thing can trigger the herd running one way or the other. What is too long? 3 to 4 weeks on this time frame.
I am bullish on Bitcoin and all of my articles favor the long side, BUT that doesn't mean I am always buying. I do have the ability to recognize when the bears are in control and simply step aside until conditions favor buying again. At the moment I do not know why anyone would be going short when context, structure and location are favoring the long side (even in this range bound environment). Price would have to break and close below 7600 for me to go back to a more neutral outlook.
This is a game of probabilities and long term success has very little to do with being "right". In December of 2017, EVERYONE was right, while today most of those "experts" no longer participate. Why? Because timing any financial market has everything to do with how you manage RISK. Our swing trade strategy is right slightly more than 50% of the time at the moment, which is not stellar, but our performance is still positive. It is our defensive mindset and focus on preserving capital that generate positive results, NOT just winning trades. What good are profits if you are unable to keep them?

GBPJPY for sellThe price has touched the resistance zone and there is also the trendline in the same area
Also, it made a false break so we are expecting the price to head towards the support zone.
There is MACD divergence within the increasing expandable triangle.
Comment your thoughts!
Sorry for last week's absence

EURJPY: Analysis- Downtrend is getting weaker as price is struggling to make a lower low
- Price is currently at a weekly resistance so therefore; it's a bit of a premature entry for a buy
- As price is on a downtrend we would feel comfortable selling but need further confirmation on the H1
- The support level has been held since 2016 and price has touched it more than 3 times with a false breakout dating back to 2016.
--- Wait for confirmation candle ---

EURSEK - Tests Daily Channel ResistanceEURSEK Testing channel resistance on daily chart.
SEK Futures show prices are approaching all time lows. As the chart shows SEK looks to be oversold and a bounce from the lows is highly probable.
USDSEK providing additional confirmation as technicals point to chances of near term reversal.

BTC - Suspect there will be a false breakout but don't be fooledAsymmetrical triangle or descending triangle. Well doesn't really bother me and here is why?

UK100 : buy channel lowIt seems UK100 weekly up swing will continue.
So this is the big picture to get advantage on and buy the deeps.
time your buy blocks inside day .
best of luck :-)


EURGBP False Breakout?2 simple reasons to short this breakout:
1) Comparing the monetary policy stance between both central banks, the ECB said last week that their rates will remain at current or lower levels, while BOE kept their rates on hold without any hint of cutting rates.
2) This is the second attempt to break the supply zone in a year, however, there is no Brexit announcement or major economic data until the release of UK's GDP numbers next Friday.

Weekly EUR/USD short MACD shows that bears are taking over the bulls. There is a false breakout following by a bearish engulfing bar.
This is how a bearish engulfing bar pattern looks like on your charts,
this candlestick pattern gives us valuable information about bulls and
bears in the market.

Short $US2000 $IWM For JUL 15 - AUG 20 Seasonal TradeWe ended the late June to July 15 Seasonal trade with a huge bang... except Russell 2000 lagged terribly. Notice the potential rejection of the June close here along with the top rail of the big wedge.
Seasonality starts July 15/16 and Russell along with DAX are the worst performers.
charts.equityclock.com


Bitcoin Bullish ProposalBitcoin Bullish Proposal
After the recent price action I've decided to re-evaluate my analysis. By using Andrews Pitchfork, I found a channel price seems to respect. Currently, price is showing a reaction to the median, so if your a bull, this might be something to keep an eye on. If price can break through the median, I believe it will go to the next major resistance at around $6100.
However!
This price action has verified some of my previous analyses.
I still think this is a false breakout. Price still needs to drop down to one of the MA's. Either the daily 200 or weekly 200. At which point it will consolidate and then finally gain enough momentum to rally into an official bull market.
Trading Bitcoin can be risky. The price channel above could be useful but I will leave that to your judgement whether it's trade-able. Personally, I am a long term holder. If you are a long term holder as well, don't let the recent price FOMO you into buying at the top. If you are too antsy, wait for it to come down to the lower part of the channel before you buy. Or wait until we come back to the lower MA's.


