USDCAD Fake Breakout?Is this a possible break out or just a fake break out.
I believe this is an actual break out but i expect to come back to retest the trendline before heading back down.
Regardless I have a pending buy or sell order depending on whether it returns back into consolidation or continues to move down.
I have 20 pip stop losses for both scenarios
Falsebreakout

AUDNZD false channel breakoutShort AUDNZD. False channel breakout on 1hr chart. Use the 5min chart wait for price to go down and cross 100MA to trigger trade, else abort.
First target : 1.0688
Stop Loss : 1.0740

GOLD : Buying opportunityWaiting for more accumulation to come and a false break of recent lows , then enter long where first TP will be 1345 zone and ultimate target will be 1400 zone.
*We might get another smaller bullish h&s pattern before the rise.
Best of luck :-)

In Bits and Pieces? Don't Watch! (BTC)Here again for another Doc breakdown, this time our beloved Bitcoin.
On the 4h chart we see our ruler and fearless leader, BTC taking the charge from 7950s to 9400s. Holy canoli, thats almost a 20% jump!!! Then you start doing the mental math in your head: If I had just put 100 dollars of my hard earned USD(or USDT hehe) yesterday, I would have made 20 bucks! Pretty soon your quitting your day job, buying name brand toothpaste, and trading in your 20 year old rusty bike for a new sexy thing with 29 inch wheels... All because of that 20% jump in BTC. OKayyyy maybe I'm getting a little a head of myself(or a lot!), let's cut to the chase as why that's wrong.
If you don't want to read anything else, read this: The jump we are seeing here is most likely a false breakout. Support and Resistance levels are at 8100s and 9800s respectively. I NEVER speak in certain terms because as technical analysts, we are like weathermen. BUT, just like weathermen, we should adjust to any new developments which come out.
Let the Doctor diagnose this chart. First, we are STILL in a downwards trend (Red parallel channel), do not forget this. Second, yes we did see almost a 20% jump since yesterday's low, but peep the volume now and then(circled to the left in green). The volume with this increase is PUNY compared to before (which wasn't even a sustained reversal but certainly had more volume backing it then now!). Lastly, we are already seeing lower-highs on the next 4 hr candlestick.
Also, check the 2hr chart below for fun. If you look at the candlesticks they are already starting to trend down again with waning buyer momentum. Check the MACD too, losing buyer momentum.
I will continue to watch our fearless master of the crypto, BTC.
Happy trading!
-Dr.Don't Watch

False Breakout?If the break out stays below 10,000 we could be headed for 8600 area for the Cypher Buy confirmation.
If not and we break to the upside then buy the retracement off the support back into the sideways rectangle.

EURNZD buying opportunityPrice has been stalled on multiple support zones and created a low risk buy opportunity.
look for an intraday buy setup in the London/US session to get in .
next resistance/target zones are marked on the chart.
Best of luck :-)

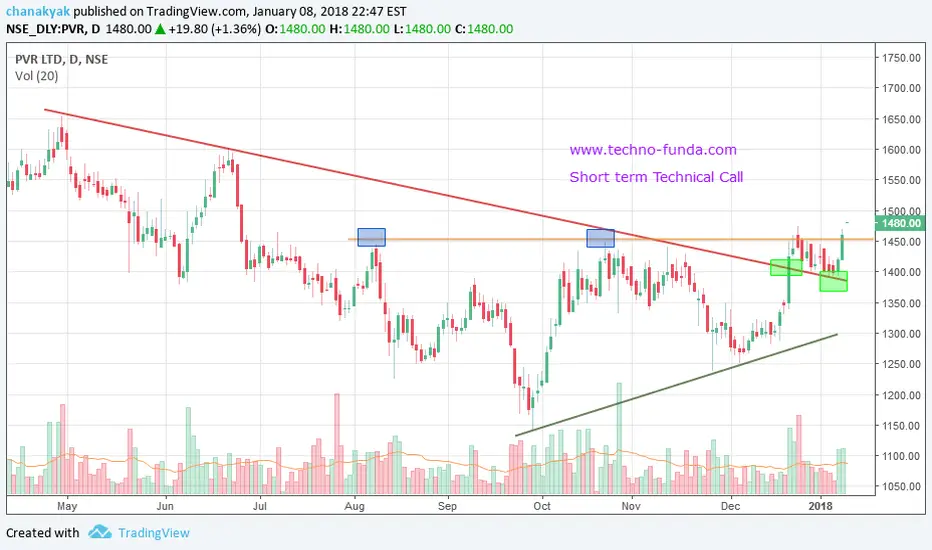
PVR LTD Short term positional callCMP: 1460, Closing based SL 1385, Targets 1519, 1540, 1575
Technicals:
Trend line Breakout
Swing high breakout
trendline support
false breakout retracement
Above SMA volumes
Note: All levels are for Education purpose and pls contact financial advisor before investing
How to Spot False BreakoutsEverything is described on the chart.
Another thing are bull traps. These happen when there is NO retest of resistance and volume may be lacking. You can always have an uptrend without an actual "breakout." Breakouts clarify STRONG uptrends that are likely to continue.
Also, notice how when the volume peeked we formed a doji. This means that a lot of people came in and took profits because they knew the trend was weak.
This one is very weak and will be shot down. Hope this helps!

GOLD - get ready to party ? Daily chart is very interesting at the moment , it give us a clue where are the areas to enter the market for big returns .
Combining this info with lower time frame like the 4h and 1h / intraday day technique can provide a really good opportunity for us as traders , so be aware of these levels and take advantage of them .
What do you think ?
Best of luck :-)

USOIL - intraday buying spotWas out from the last position after a sharp move down and now looking to buy inside the day using fibs + support + waiting for the false break .
Keep looking for the low risk high reward trades.
Best of luck :-)

GBPUSD - SELL down to 1.335 Price is in the 61.8% retracement zone from the last swing from 1.365 to 1.3025 + PA resistance + upper channel resistance.
Since there was a falsebreak on the 1H time frame i believe price will go down to 1.338 at least . If 1.338 zone will be broken next support will be 1.335 zone.
Best of luck :-)

Example of an Exponential Moving Average (EMA)The exponential moving average may indicate an uptrend or a downtrend. It is a trend indicator.
A bullish signal is generated when prices move above the EMA, so make a long. A bearish signal is generated when prices move below the EMA, make a short.
The EMA works very well in long trends, however, does not work well in lateral movements or short periods and in those cases EMA gives false signals.

BTCUSD - waiting more lows to be created to buy 6800 zoneBTCUSD is in a strong uptrend and formed a small h&s pattern relative to the trend (soon will be complited).
My idea is to wait for more lows to be created near the channel bottom and buy after a false break down near the 6800 zone, hopefully price will rise to the 8000 zone.
Everything is marked on the chart.
Best of luck :-)

NZDUSD sell zone and trend continuationNZDUSD looks like made a false break of the recent highs in the resistance zone, also a fib retrace zone.
So a trend continuation is reasonable from here .
Best of luck :-)

BTCUSD Perspective And Levels: Failed High Or Minor Retrace?BTCUSD Update: A push to a new high, but could not sustain the break out. This failed break is a bearish sign which still maintains the possibility of the C Wave to unfold which can take prices to the 5500 area or even the 5360s.
Aren't new highs usually a bullish sign? They are, but in this case, not only is price structure presenting a possible double top, but can also be showing the B Wave that I wrote about in my previous BTC report. B Wave corrections are 3 leg waves that can actually take the market to a slightly new high, just like what has happened in this market, and then fall apart which is the C wave. Now keep in mind, I am estimating the near term direction based on the price structure that is in place at the MOMENT. Things change very fast in this market, and the ability to adapt quickly is what makes a good trader good, not getting stuck on an opinion and then complaining that my analysis didn't play out. For the less experienced, TA is not a weather report. This is why I always recommend learning how to make your own decisions, so that when the market changes, you can change with it, instead of fight it.
The other factor that is prompting me to expect weakness from this point rather than strength is the area of price failure. The 6200 to 6400 zone is actually an extension based on the recent swing from 6206 to 5362. This zone is where false breakouts are more likely to occur, so if the market is going to break out, it needs to clear this zone, not run up into it, and then sag like it is now. I do not short these markets which I have explained previously, so the best I can do it use these signals as a reason to stay flat.
A confirmation that more selling is likely would be a break of the 6k level which is not only psychological, but it is now the .382 of the recent bullish swing. Shorting this market can be rewarding, BUT as I keep writing, you must be on top of it, and you must have a solid plan so that you can recognize when the market is turning back up and get out quickly (definitely not a good idea for less experienced traders). If you are trading without a set of criteria to guide your decisions, then you should not be trading at all in my opinion.
What about the higher low at 5632? I wrote about this scenario in my previous BTC report as well. This structure cannot be ignored and certainly challenges the short argument. It is possible that this level is a Wave 2 bottom which makes the current leg a possible Wave 3 of 5. This is where the market must choose. If price manages to stay above the 5960 area, and starts pushing highs, then that would be a confirmation which can take prices into the 6500 area. I don't know if this will happen, but any sharp rally from the current level will confirm this scenario.
In summary, for those who are less experienced with TA, it is far from an exact science, and you must not expect a forecast to play out exactly. TA offers tools and methods to isolate potential scenarios from countless possibilities. From that point, we can then evaluate risk and reward and decide if the trade is worth taking in accordance with our plan and risk tolerance. In the case of this market, the risk is still too high to buy for ME and since I do not short, then all I can do is watch. I am interested in buying AFTER price has retested a support zone like the 5500 or 5350 areas (that is IF the market offers that opportunity). If price can reach the lower 5k supports, that would be a convenient area to complete this possible Wave 4, and that is where the lowest risk opportunity is to participate for a Wave 5 back up into the 6500s. Either way, this market will eventually line up with my criteria, and when it does, I will be prepared to act.
Comments and questions welcome.

False Breakout on EURCAD?!Hi guys,
this is what i call "False Breakout". I've posted an analysis on this pair in the last days but i was unable to take that trade (fortunately) as explained there (see attachment).
Nevertheless, i'm not in any correlated trade right now and i can indeed take this trade if the market will let me do that. The reason i think this could be a false breakout is due to the very strong reaction we've had after the break of that daily structure (yellow box). In the hourly chart (this one) i also see a small break of intra daily support: this gives me an edge and i'm placing my order with the blue line, with stops above the highs, and targets as shown.
If you have any idea/question, feel free to comment below.
Otherwise, see you in the next chart!

False Breakout on EURCADHi guys,
this is what i call "False Breakout". I've posted an analysis on this pair in the last days but i was unable to take that trade (fortunately) as explained there (see attachment).
Nevertheless, i'm not in any correlated trade right now and i can indeed take this trade if the market will let me do that. The reason i think this could be a false breakout is due to the very strong reaction we've had after the break of that daily structure (yellow box). In the hourly chart (this one) i also see a small break of intra daily support: this gives me an edge and i'm placing my order with the blue line, with stops above the highs, and targets as shown.
If you have any idea/question, feel free to comment below.
Otherwise, see you in the next chart!

USDJPY A Bullish Breakout To Finish Our Move Across the ChannelTalk about one heck of a false breakout. After pretending to break out of our sideways channel to the downside in early September, the USDJPY has made its way almost all the way back across and now i anticipate that we'll see a test of the 114-114.50's highs which we've tested twice before recently.
Currently the pair is putting in an ascending triangle type of pattern which is a sign of a potential bullish breakout. We do have a price point that I'm concerned about a little bit higher around 113.50's but overall I wouldn't be surprised to see this pair finish it's move across the channel
Akil

EURAUD 4HPrice made a false breakout once the market opened but came back into its channel. Price looks to be making a hammer candle rejecting supply zone. If price can manage to stay within its channel I will be looking to go long. Entry would be at the pink lines, and I have one set for both directions. We will see how the euro comes out this week & Aud news tomorrow.
Trade with care!

ETHUSD Perspective And Levels: Up Swing, Corrective Extension.ETHUSD Update: 334 resistance has been taken out, but there is no follow through and the current up swing is not performing as expected, prompting me to consider it an extension of the minor corrective wave.
First let's get into what is going on with the levels. The minor resistance zone 324 to 334 (,618 of previous bear swing) has been slowly compromised. The problem is the lack of momentum. When price pushed above 334, it should have attracted more buyers and momentum should follow. Instead price went no where which is not a bullish sign.
I am bullish in general, and I am still waiting for the pull back that I wrote about in previous reports. My plan is very simple: IF price retraces to the 306 to 295 support area (.618 of current bullish swing), and it can show a reversal pattern on a smaller time frame, then I will get back in. Keep in mind that I am flexible, and willing to get in sooner IF I see a compelling formation, but there is nothing to write about. If price just goes without me, I don't mind, it won't be the first time. I have lost more money because of the fear of missing out, than by missing out. Waiting is a more profitable strategy, but not a fun one.
In terms of wave count, this market should be in the beginning of the Wave 3 of 5 again, BUT this leg is not acting like a Wave 3 at all. The 334 break should have been awe inspiring and instead was lackluster to put it nicely. Plus Wave 3's are never the shortest wave, and right now when I compare it to the subdegree Wave 1 structure, it is shorter. This behavior leads me to believe the current up swing is nothing more than part of the subdegree Wave 2 correction. Which means there is still potential for a retrace to the support zone that I am interested in.
In summary, this market seems to go in spurts, and again is waiting its turn for the order flow. Price structure continues to be bullish, but the most recent leg up is more likely part of the corrective wave that this market has been in for a few days now. Keep in mind, a rally can appear out of nowhere, and I am okay with missing the move. I prefer to wait for a retrace into the 306 area and see if the market can meet my criteria in order for me to get back in. If I miss it, there will be more opportunities.
Comments and questions welcome.

AUDJPY waiting to long or short this pair inside important zone.
I will wait to a false breakout to sell/buy ( marked circles )
those 2 scenarios will produce low risk and high reward positions.
So keep watching... :-)

Potential Short Position for GBP/JPY_Trade Plan 2017.06.26
Legend for price level, trend line, and rectangle:
Dark Gray > Weekly Level
Blue > Daily Level
Red > H4 / H1 Level
Green > M15 / M5 Level
Yellow > M1 Level
For the majority trend in D1 and H4, the current market bias is still down with price is holding slightly below MA200.
However, in H1, price is forming Higher High and Higher Low formation since last Thursday.
Currently, it is bouncing back within major H1 resistance area 142.135 - 142.554.
Look for further price action and take relevant action accordingly.
Trade Plan 1:
To follow the majority of downtrend, these 3 conditions should be in place:
1. Price forms false break out of resistance area 142.135 - 142.554 and reverses back down to the downside
2. Price continue breaks down nearest uptrend line
3. Price bounces back up and starts to form Lower High
If the above conditions are met, it means the downtrend is still intact and can consider to short the market.
With Stop Loss 40 pips and Target Profit 140 pips, the potential trade offers 3.50 Reward-To-Risk Ratio.

Shark886 within 1H consolidation zoneReading the chart
After the French election the pair surged higher until it hit a "major" dynamic resistance (reprojected a channel aligned at the 2016-10-06). Now it consolidates awaiting the big news from the UK. As a pattern trader I look for patterns within consolidation with potential to break out. If I loose, I reset and wait for a retest of the broken consolidation zone.
Measured from the latest highest low I saw two things: a Shark886 pattern and a Gartley pattern. Both completion points creates a nice potential reversal zone (PRZ) of 3 pips at the most recent higher low. Both patterns share the same stoploss, so it is more attractive to take the entry of the Shark pattern for a better risk:reward ratio.
Setup Shark886
Entry: 0.8668
Stoploss: 0.8642
Target 1: 0.8706 (1:1.46)
Target 2: 0.8729 (1:2.35)
Target 3: 0.8794 (1:4.85)
