EURJPY Flag?After impulse we have corrective waves. Possible re-test at resistance line but right now im just waiting for a break below the trendline since the bulls have become weak.
Flag Pattern at work so expect an impulse downwards.
:)
Falsebreakout

NZDCADBreakout failure from the inverse H&S.
Will wait for pullback in daily chart for shorting opportunity.

CSCO flag + false breakoutSignals:
flag
false breakout
Buy 31.30-31.40 (flag breakout)
Stop 30.05 (-1 tic under false breakout's low)
Target 34.00 (sizing)
R\R ratio 1:2

Broke below major resistance zone - Outside BarPay attention to 124$, a resistance zone that was broken after a huge weekly False Break.
Price is below the Fast SMA line (bearish confirmation signal) and unless Brexit will deliver a strong rally, I expect MCD to continue lower
Tomer, The MarketZone.net
Follow me on TradingView
Follow my blog - goo.gl
Subscribe to my mailing lists - goo.gl

AUDNZDGood area to look for short as bullish traders may have been trapped trying to buy on breakout.
Those who have shorted below 1.041 may also have been washed out.
Target here is just 1st target to TP for half position.
Now just wait for market to suck me in.

Short EOD trade on Brent Crude at the $50 psychological levelPlease see annotated chart for details.

False break above key resistance in major downtrendWe might be seing a transition from the bearish into a new bull trend long term. Buyers managed to push through resistance around 0,68800 but the selling back below the level was pretty strong so this might be a false break.
If the buyers really were in control they should have managed to keep price above this level.
IF and only if we get a weak pullback into the level I would be open for a potential false break setup and short trade. Since the structure is indicating a transition, first target should be kept fairly close (0.65000) in case we see new buying strength coming in around that area if there really is a transition. If the sellers are able to maintain control and 0,65000 folds, the logical second target would be around 0,62500.
Only a new forceful push and close beyond 0,68800 would negate this bearish/false break scenario in my opinion.

EURUSD: BULLISH FLAG PATTERN & DESCENDING TRIANGLE ON DAILY !!!Hello Traders,
FX:EURUSD has been consolidating for the past 6 weeks, which resulted in Bullish Flag Pattern formation on the daily time frame . The upper portion of the flag pattern is a really strong resistance level since the market has been rejected from that level 9 times . Thus we need a really strong bullish breakout from this level in order for eurusd to go higher. I have listed the key high impact news events that are most likely to affect the FX:EURUSD early tomorrow morning on the chart above. We might get the strong upside breakout from one of these events by early tomorrow morning OR the events might also take us in the opposite direction, to the downside. Do pay very close attention to these events as we look to trade based on this bullish flag pattern. Keep in mind that since this is a daily time frame based setup; we need to see a daily break and close above the strong resistance level before entering into the long setup. You don’t want to be caught on the wrong side of the market, especially with the amount of new events coming up pretty soon.
I have labelled 3 potential targets; initial target is a minor one since the trend line has not been tested yet. 1st & 2nd targets are major ones since flag pattern completes at the 1st target level and the 2nd target is a strong rising trend line, which has been tested at least 5 times. The stop would go just under the 50 day moving average (magenta color line) for the long setup. For the short setup, the stop would go above the upper portion of the descending triangle (yellow falling trend line).
Do note that we also have formed a Bearish Descending Triangle within the bullish flag pattern. The breakout that we got earlier was a false breakout since we never got a valid retest of the broken level and thus the pattern would still be considered valid. So if we get a break and close below this triangle pattern then we might be able to enter into a short trade.
KEY NOTE #1: ECB maintained its interest rate @ 0.05%. Need to pay attention to the press conference , which is coming up in 30 mins from now.
Please feel free to AGREE or DISAGREE with this idea by leaving a comment below. Hit that thumbs up button (top left corner of this chart) if you like the idea. Thank you everyone for all the SUPPORT that you have given me so far, I truly appreciate it. Good luck everyone :)
Follow me on Twitter as well: moneymaking2016

Holidays Season Trading - Increased volatility and riskI've been asked a lot about trading during Holidays Season.
There are several things you need to be aware of if you intend to trade during Holidays Season that starts this week:
1. Low liquidity - Market is thin as banks, funds, institutions and pro traders take time off
2. Unexpected moves and increased intra-day volatility. Aggressive price reaction to minor events.
3. Frequent False Breaks - Especially in volatile pairs like $GBPNZD
This $GBPNZD chart is a great example of how 300-400 pips range with 3 major structure zones held for more than 2 weeks. Notice the multiple False Breaks to all structure zones.
In order to manage through the Holidays period here are 3 tips:
1. Use smaller positions size.
2. Use wider stop loss - Focus on Major structures and trend lines
3. Take profits on short term targets and move stop loss to BE.
Tomer, The MarketZone
This analysis is part of the Weekly Markets Analysis newsletters
To read more interesting technical reviews for the week - goo.gl
To subscribe to the newsletters - goo.gl
Follow my blog - goo.gl
Subscribe to my Youtube channel - goo.gl

GOLD - Bullish SignalsFalse break below support area, possible hammer, positive divergence on the 14 RSI, Falling Wedge - these are some bullish signals which might announce a rally for gold. The probability for an up move to start will increase once the upper line of the wedge is broken. First target for a rally would be the 38.2 Fibo level. I will consider this idea invalidated if the price will close on a 60 minutes chart below 1.1220.

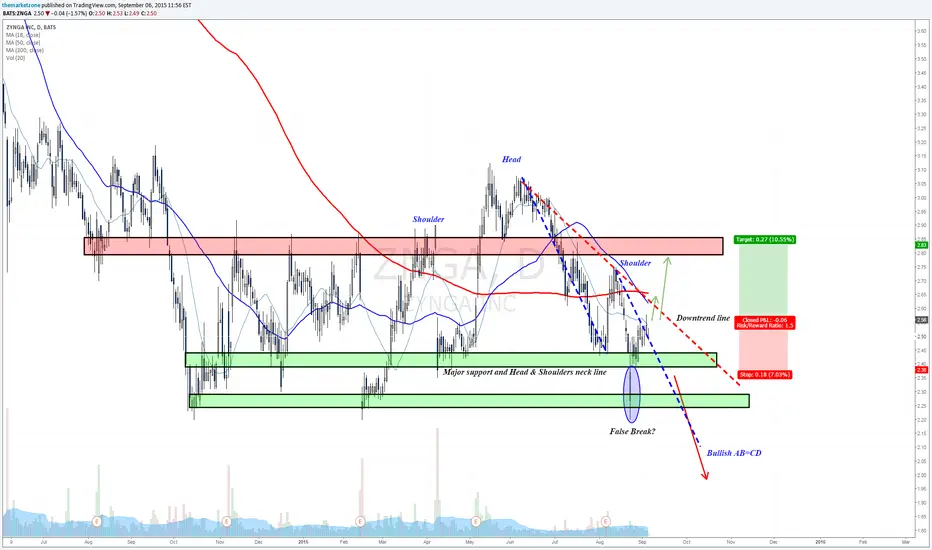
False Break to Head & Shoulders pattern? Waiting for breakoutThis oversold stock is trading inside a clear trading range for about a year: 2.8-.2.4 with bottoms near 2.2$
The Head & Shoulders pattern shown in the chart was triggered during August but the price ended up creating a False Break to the neck line (assumed to be the 2.4 support zone).
If that's a False Break, we may expect $ZNGA to breakout on the other direction (meaning - up).
It needs the support of the Market to breakout of the daily downtrend line and the 50 SMA line that comes with it.
The initial signal should be a close above the fast SMA line (which hasn't happened yet!)
If the price will close above 2.5 it may rally towards the 50 SMA line and the 200 SMA line as short term targets but if the price will breakout of the trend line, we can assume that eventually it will try and reach the top of the trading range near 2.8.
The required stop loss here is about 20 cents right now (below 2.4$) but for those who seek longer term positions should place wider stop loss, below 2.2$.
For the bears among you, a close below 2.4$ could trigger the H&S back again that may push the price below 2.2 towards 2.0-2.1$ to complete a bullish AB=CD pattern
This analysis is part of the Weekly Markets Analysis newsletters
To read more interesting technical reviews - goo.gl
To subscribe to the newsletters - goo.gl
A 7 Month Look Back At The S&P 500 (SPY) - What Now?Several conclusions can be drawn from this DAILY chart of the SPY. Even more questions will no doubt come to mind as a result of those conclusions.
If you thought you might find the answer to the above question you can stop reading now. The easy answer to the question is not in here. I surely can't foretell the future. Honestly, you wont get the answer anywhere. Maybe you should keep reading after all...
Let's talk about some possible "What Now" scenarios.
The market could just continue higher...
Now this is a very unpopular scenario. When was the last time you heard a majority of the investment news guests leading you to believe that everything is good and the markets are poised to go higher? Yea, I can't remember that either. So it doesn't seem like many people are in this camp. To all of the people calling for a correction, all I have to say is look at the chart. The market just broke above a resistance level that was established in February. SPY has closed above that $212ish level for 6 days now. All I am saying is it is a possibility...
The market could go sideways for a while...
Lets say the SPY sinks back below the $212ish level and hits the green uptrend line before going back up to the $212ish level where it is rejected again. It goes back to the green uptrend line again before turning higher. Etc... This could go on and on and on. It might be July before the "Wedge" is resolved. And then you will still have to play the break of the wedge properly to profit from it. All I am saying is this too is a possibility...
The market could go lower any day now and make a bunch of business news guests look like really smart people...
If this is the market reality we are faced with as so many are predicting, let's look at what has to happen and how to deal with the possibilities.
First thing is the SPY will have to go back below the $212ish level. This would, at the very least, give us a "false breakout". If you want to see an example of this occurrence just look at December of 2014 on this chart. You will see SPY broke above the $208ish level then came back down below it. The SPY was at $198.5ish in 4 days.
The next thing SPY will have to do is close below the $208ish level. If this happens then SPY will break recent support. At this point SPY will probably be below the green uptrend line as well. Now things are beginning to get interesting. Let me say that this is the point where you should get concerned about where the market may be going.
The $204.5ish level is the next support line to focus on. If the SPY is going to find support this is a logical place for it to happen. There are no guarantees but keep your eyes on this level.
Let me put this hypothetical SPY decline into perspective. If SPY closes below the $204.5ish level, it will be about 3.5% below its highs. If SPY closes below about the $201.5ish level, it will be about 5% below the highs. Many are calling for a 5-10% correction. So at this point they would begin to be correct.
The next support level the SPY would have to close below is the $198.50ish level. This would be a 6.5% decline. Below this level is a level in the mid 180's. These are not the areas where you want to be getting out. These are the levels where you want to try getting back in.
Many big players will begin to lighten up on their longs if SPY goes below the $212ish level. When they lighten up, you need to be light on your investing feet too. It would be a good idea to raise some cash at that point. With each support level that is lost, the big players will sell more. This will push the market lower. What is their goal? It should match yours. Simply to lose less, have cash available to buy back shares at some lower price, and make more money on the way back up.

Stophunters at the ready.. Will the bat take off?The markets appears to be trending within an 3 drive uptrend channel. However, when drawing some fibs from March 2013, I saw the 0.236 retracement level has not been touched yet.
So this got me thinking.. If i was a BIG investor/trader with lots of money, at which levels should I be looking at?
Well, drawing in some more fibs from 2014-09, 2014-11, 2015-01 i came up with a nice cluster of fib retracements around that same 0.236 retracement level:
a 0.236 retracement at 1.8694 (2013-03)
a 0.5 retracement at 1.8618 (2014-09)
a 0.618 retracement at 1.8685 (2014-11)
a 0.786 retracement at 1.8700 (2015-01)
a 0.886 retracement at 1.8532 (competion bull bat)
This gives me a zone of roughly 168 pips.
Also, if you look left, you can also see that this zone is lined up with previous structure zones.
So is it possible that this channel can be broken to the downside only to hit that zone, complete a bat and immediately reverse back north? Could it be that stophunters think this way? Can they push the market lower to that zone?
So if I was to go long now, I know i would definitely place my stops below that zone. From a risk:reward perspective I would wait for the bat to complete to go long.

Reviewing my trading scenarios on $GBPCAD$GBPCAD was the Requests Zone analysis on my last Weekly Markets Analysis newsletter addition two weeks ago..
The setup was based on the rising wedge and I've suggested to try and catch a continuation trade, following a daily Pinbar that came after a successful double top trade.
As you can see, the setup was violated as $GBPCAD broke out of the Wedge pattern and made new high.
At this stage, the Elite Zone received a setup for the bearish AB=CD pattern you see in the chart. In my members letter I mentioned that I think that eventually we would see the price breaking below the Wedge and that the new high could turn out to be a false break.
That's exactly what happened..
The setup generated more than 500 pips profit.
Those who didn't receive the letter (not being members of the Elite Zone), could have traded the False Break to the Wedge formation once the price broke below the pattern and stalled for few days.. This setup generated only 300 pips
Overall, although the initial setup was violated, $GBPCAD turned out to be one of the most successful trades we had in the Zone in recent weeks.

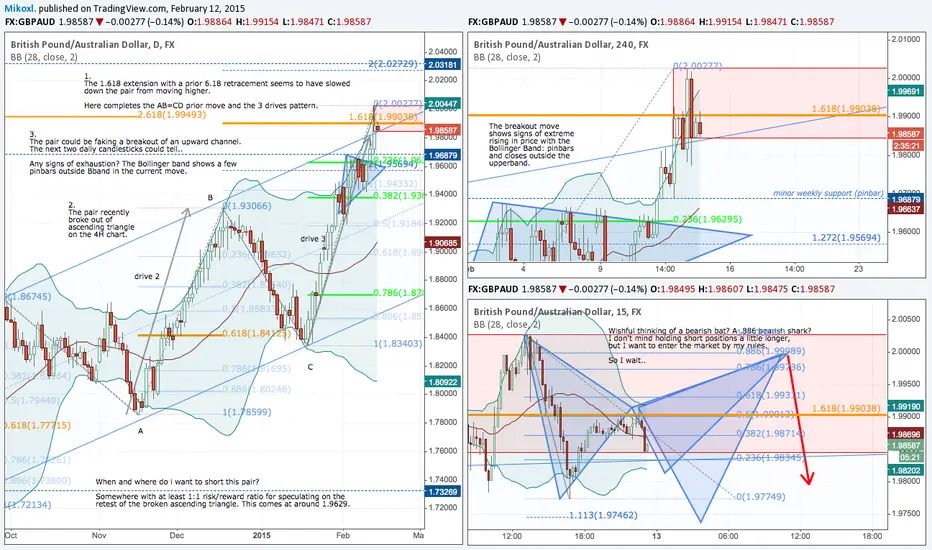
Building a case for shorting the GBPAUD short/mid termA couple of observations:
1 The 1.618 extension with a prior 6.18 retracement seems to have slowed down the pair from moving higher.
2 A daily AB=CD pattern / 3 drives pattern have completed.
3 The pair recently broke out of ascending triangle on the 4H chart.
4 The Bollinger band shows extreme price movements on the 4H chart.
Looking for an entry setup with at least a risk:reward ratio of 1:1.40-1.45 to 1.9629 as my first target.
Is AAPL Ready To Continue Higher?If you want to try AAPL Long right here, just use UT 2 (the green uptrend line) as your guide. It could be a short ride but you never know...
As long as AAPL is above UT 2, stay the course. But if AAPL closes below UT 2 before you have profits, get out of the trade. Once you have profits you have the ability to make "small adjustments" to trend lines. Just remember to never let a winning trade turn into a losing trade.
Today, in the last hour of trading, you will notice the first candle to close above the red downtrend (DT) line. This is your first hint that AAPL may be ready to continue even higher. The Trend Is Your Friend... Until Its Not.
I really like trade setups like this. The price moves above the DT line and that leads into a long trade. Nothing is a sure thing but this works many times. The key is to keep your stop tight so you don't lose too much money if the setup was a false breakout. You have to be willing to let the price close below the green DT line on an HOURLY chart if you are using this chart to enter the trade. When the market opens, DT 2 will be about 60 cents below today's closing price.
If you want to short AAPL, I would suggest waiting until we get a close below DT 2. At that point you could look for the price to get back to UT 1. If any of this happens, you will be able to draw another red downtrend line as your guide.
Trade What You See... Not What You Think, Or Feel, Or Hope, Or ...
The Trend Is Your Friend... Until It's Not. ~ Protect Profits & Limit Risk
Want to learn more? Check out the blog : trendlineinvestor.blogspot.com

CADCHF false breakoutCADCHF broke out of triangle structure to the downside and fell out of upward channel. Price is now making its way back up inside the channel.
Chart explains the rest

GER30 : DAX recover to 8900 zone , dancing around resistance :)After breaking 8900 important resistance zone last week DAX recover compleet from the 8400 resistance.
The oversold RSI bring DAX up again.
DAX had a false breakout from 8900 , and DAX return back in 8900 supportzone.
The new earnings season bring good results mostly , and DAX will recover to make a positive balance for 2014.
We wait for second test from the 8900 resistance zone. If 8900 hold DAX have again a strong supportzone for jumping to 9600 zone. If 8900 break again we can confirm the bearisch outlook for DAX.

Pull back on USD/CHF?Price on USD/CHF has produced a high test bar ricocheting off the round 0.9500 level. RSI and Stochastic divergence support this short set up.
entry - below today's high test close
stop loss - above today's high test close
target - aiming for 0.9290, previous low, close to 50 ema (ignore support line on chart at 0.9250)

USDJPY Elliot Wave, false breakoutI don't regularly use Elliot wave theory in my ideas so I'm not 100% on this one, any advice is very welcome.
Things to note are that USDJPY is in a consolidation pattern on the daily. It tried to breakout a few days ago but failed. Going up for another test but is running into a lot of resistance.
Put in a long wick right along previous structure support, which lines up fairly closely with 382 fib confluence
I tried to add the elliot wave theory as an after thought but I'm not quite sure if this is valid. Leg 3 is nice and leg, leg 4 doesn't close above leg 1 lows. ABC pattern seems to be completing right around the beginning of leg 4 which is about right.
I'm expecting a move downwards about the length of leg 1, though it could reach all the way to the bottom of the consolidation pattern

Fib and Range Break 7_22_14Price just broke out of a range, in addition to breaking a Fib retracement drawn from last July. I am looking for a pull back before adding to my short position (short began at 1.3895 4/11/14)

Continue to Like Russia HereRussia is a market that I like as a standalone. I have already one phase in as I stated nearly a month ago. Here is why... "Russia is currently trading at .6 times book value. The reason for this is quite clear, if the US and Europe pose sanctions on Russia, the companies within will be harmed economically. The question for investors is by how much will sanction effect demand and therefore how much pressure will be put on earnings. Couple this with already poor economic conditions and high inflation in the region, there is no question why market participants hate this market. This is where I see opportunity. The book value of .6 is currently 26% of the 2.2 price to book value of the S&P 500. The only times this ratio was at this level was 2008 and 2001. On a price to cash flow basis, this is the lowest level since 2001. On a price to sales basis this is the lowest level since 2001. Now this may take some time to materialize, however I think the recent the market discounting future negative economic performance has provided an attractive entry point for investors in Russia. I am looking to implement this position in two phases, one sometime this week, and next level if we see 10% lower. That’s it."

EURUSD - Glad I waitedAs I said in my last analysis, there are some bullish signals here. For the moment I am glad I waited and didn't short at breakout bellow 1.3600. I thought it would be a false breakout, and for the moment I avoided a loss. I really hope it will move higher....Did you go short?
