XAU/USD FALSE BREAKOUT AND CLOSE BACK AROUND $1915Last week it was noted that “if tensions between Russia and Ukraine spill into outright war, gold prices may be able to reach the June 2021 high set at 1916.62 quickly.” Trading at 1924.92 when this report was written, gold prices have achieved their first upside target following their bullish breakout earlier this month. It’s worth noting that the daily candle appears to be shaping up as a shooting star with a long upper wick, suggesting that a new range between 1916.62 and 1974.49 may emerge. A drop below 1916.62 would likely only transpire once Russian troops vacate Ukrainian territory.
XAU/USD skyrocketed overnight, breaking above the key resistance zone of 1915, marked by the peak of June 1st. With the precious metal being in a strong rally mode since January 28th, when it hit the upside support line, traders will consider the near-term picture to be positive.
When writing, the metal looks to be heading towards the 1960 zone, which provided resistance on November 9th, 2020, and January 6th, 2021. The investors believe that the bulls may take a break after testing that critical zone. However, as long as any potential retreat stays limited above 1890, we could expect another round of buying and perhaps a break above 1960. Such a break could see scope for extensions towards the 2015 territory, defined as s resistance.
On the downside, a dip below 1870, marked by the inside swing, could signal a more significant correction lower, with the next potential stop perhaps being the low that same day, at 1830. If that level doesn’t hold, we could see declines towards the low at the 1800 zone.
Risk Disclosure: Trading Foreign Exchange (Forex) and Contracts of Difference (CFD's) carry a high-risk level. By registering and signing up, any client affirms their understanding of their own personal accountability for all transactions performed within their account and recognizes the risks associated with trading on such markets and such sites. Furthermore, one understands that the company carries zero influence over transactions, needs, and trading signals. Therefore, it cannot be held liable nor guarantee any profits or losses.
Falsebreakout

Is the crypto market creating a bulltrap? #bitcoin #ethereumCrypto TOTAL market cap fell back into the price channel once more, after the current situtaion in ukraine keeps the markets on it's heels.
Also that short term demand line got broken as well.
Depending on how reliable the volume is in the TOTAL chart, the volume in the selloff was pretty huge as well.
We might see some violent moves in the crypto market soon, either to the up- or downside.
It mostly will depend on how the situation in the ukraine turns out, as it seems that is the biggest concern markets have at the moment.
Do NOT forget about the FED though, they probably might get jealous with all the attention the ukraine situation gets, so they might drop something too soon :D
Most importantly, stay calm and don't overreact to the current situation and keep your spirits up!
Good luck with your trading!

SLP-USDT UpdateIt seems like SLPUSDT had a false breakout and the resistance line is still intact. It is probably in a correction phase after a great run up.
There is a battle going on in the circled area.
A bearish engulfing pattern is present on the daily so can expect more downside action possibly to the 50DMA unless trendline is successfully broken with the retest of the line.
* Not financial advice. Please do your own DD.

Beware False Breakouts! How To Spot Them...Investors should use basic Technical Analysis for powerful decision making. I see it as a challenge to demonstrate how useful knowledge of one simple pattern can be to identify price reversals. Recognizing this pattern and acting on it will save much money and headache!
Both traders and investors need to be on guard for false breakout reversals. Seeing this pattern in action can provide an excellent profit target, entry point, or prevent major drawdown!
In this video I look at examples in the Silver ETF AMEX:SLV , Spotify stock NYSE:SPOT , and Forex Euro/Dollar pair FX:EURUSD for false breakouts and what follows.
I am excited to make this video for my viewers and for Best of Us Investing!

GBPUSD Breaking out of a Descending Broadening Wedge> Weekly pulled back to .618 Fibonacci, horizontal support, 200ema and found support to start a bull run now 3 weeks in. Possibly looking to reach the recent highs area at 1.4200.
> Daily formed a descending broadening wedge & is currently starting to breakout to the upside.
1. Price could continue breaking out on the daily and form a small pullback to retest the wedge and horizontal support (maybe 1 hour flag over a few days) before continuing to 1.3950 which is the top of the pattern.
OR
2. This could be a false breakout of the wedge. Price could make a larger pullback, moving back into the wedge and forming a higher low around 1.3500 horizontal support/ .382 Fibonacci/ 50ema, before forming a reversal and breaking out of the wedge again making a run to 1.3950 to 1.4200.
Invalidation for an entry would be price continuing to run to target without pulling back or price moving back into the wedge and failing to form a higher low, moving back down to the lows. A negative is the monthly did form a double top and is in a bearish run.

EURUSD | Perspective for the new week | Follow-up detailsThe price moved over 140pips in our direction (see link below for reference purposes) before the appearance of multiple bearish engulfing candles which suddenly disrupted the bullish momentum building up from the reversal structure identified in my last speculation. The EURUSD bounced back after US jobs dip as we witness a cancelling of this bearish move during the course of last week trading session as buyers brought the price back to where it was during my first analysis on this pair - a development allowing me to maintain my bullish perspective on this one.
Tendency: Uptrend (Bullish)
Structure: Breakout | Supply & Demand | Trendline | Consolidation structure
Observation: i. Since the beginning of the last year 2021, the Euro recorded a 9.4% decline against the Greenback to express an emphatic bearish momentum.
ii. The bearish momentum appears to have found a bottom @ $1.12 in November 2021 which can be evident in the character of price action in the last 3 months except for the "sudden" breakdown of this level at the tail end of the month January 2022.
iii. Except for the "false" breakdown at the end of last month; Since the price hit bottom @ $1.12, we have noticed a gradual bullish momentum as the price continues to find higher lows which are evolving to the possibility of buyers taking over the deals from the supplication zone around $1.135 area.
iv. Like I have stated on my last speculation, above key level @ $1.13 appears to be a comfort zone for me to long with hopes of adding to my existing position at Breakout/Retest of $1.138 area.
v. In this regard, I suspect that the early hours/days of the new week might see a drop in price towards the key level area where I have identified on the chart as a new demand level to incite an increase in the value of the Euro.
vi. Hence, above the key level @ $1.3 remains a comfortable area to long the EURUSD.
NB: Considering the long-term Bearish momentum, it is appropriate that we remain conscious as the Bullish expectation in the coming week(s) could be a correction phase that might incite a downtrend continuation but till then ... Trade consciously!😊
Trading plan: BUY confirmation with a minimum potential profit of 400 pips.
Risk/Reward : 1:4
Potential Duration: 5 to 10days
NB: This speculation might be considered to make individual decisions on the lower timeframe.
Watch this space for updates as price action is been monitored.
Risk Disclaimer:
Margin trading in the foreign exchange market (including commodity trading, CFDs, stocks etc.) has a high risk and is not suitable for all investors. The content of this speculation (including all data) is organized and published by me for the sole purpose of education and assistance in making independent investment decisions. All information herein is for your reference only and I take no responsibility.
You are hereby advised to carefully consider your investment experience, financial situation, investment objective, risk tolerance level, and consult your independent financial adviser as to the suitability of your situation prior to making any investment.
I do not guarantee its accuracy and is not liable for any loss or damage which may result directly or indirectly from such content or the receipt of any instruction or notification therewith.
Past performance is not necessarily indicative of future results.

BTC breaking out? NOPeople are going crazy by seeing the recent volume in BTC. But lets not forget it is connected to commodity market and just today when market opens Facebook falls from $320 to $232.
Stay safe don't go long.

BTC closing CME gap So a friend of mine point this out and here is another reason that this is a fake breakout.
BTC is closing CME gap and creating more liquidity at upside and doing stoploss hunting of Shorts.

TSLA: Complete Multiple Time Frame Analysis (H, D and W charts).Hello traders and investors! Let’s see how TSLA is doing today! It has been a while, so we have a lot to catch up on.
First, in the 1h chart, TSLA is just doing a sideways correction, dancing around the 21 ema. Both Fibonacci’s Retracements, the 38.2 and 50% are doing a good job holding the price, however, even if it lost its retracements and fill the last gap at $ 847 I wouldn’t be surprised.
It is important for TSLA to do a bullish structure in the 1h chart, and this would happen the moment it breaks the $ 943.70 (purple line). This will trigger a pivot point that could lead the price above the $ 995, which is the next resistance to work with.
In the daily chart, TSLA is in a bottom area, and it is trying to react, however, I would wait for a breakout of the $ 943 just for confirmation's sake. In the last few days, it has been dropping with low volume, indicating that there’s no real sell pressure.
In addition, we see better why the $ 995 is so important, as it was a top/support level in the past, and since it is so close to the $ 1k, which is a very emblematic price for TSLA, we can assume it is an important resistance for the short/mid-term.
In the weekly chart, TSLA is trying to do a bullish candlestick pattern just above its support level at $ 900.40 (Jan 21 top), making last week drop a false breakout and a bear trap. The $ 943.70 is this week’s high too, and this is the most key point to watch on TSLA for now.
If you want to keep in touch with my daily analysis, remember to follow me and I’ll keep you updated.

9% RATE OF RETURN ON EUR USD BREAKOUT REVERSALThis Video analyzes the trade result of 90 Pips (a 9% Return) that was captured on the EURUSD, as the pair continued the False Consolidation Breakout Reversal that took place on the Daily Chart earlier this week. The main Technical Factors that supported this trade are analyzed using the relevant sections of my Trading Manual, so that you can know how to take advantage of similar setups in the weeks ahead.
Specifically, the video describes
1. How to Accurately Identify Consolidation Setups (Page 25)
2. Why you should always trade setups that are in sync with the Main Trend Direction (Pages 32, 33)
3. Predicting the Formation of Consolidations and Breakouts (Pages 34 to 45)
4. Rate of Return and Holding Period Requirements
5. The Discipline to Hold Trades for a Few Days
It is very important to be able to accurately identify the profitable setups provided by the Daily and 4 Hour Charts each week. Once you can do this and have the patience to hold trades for a few days, you'll be able to enjoy Rates of Returns of up to 10% Per Trade on a regular basis each month!
Duane
Swing Trading Master

UKOIL - SHORTFalse Breakout of Major Resistance Level. A Bearish Harmonic Pattern has been formed. Selling opportunity!
UKOIL - SHORT
ENTRY PRICE - 88.77
SL - 91.50
TP - 79.20
Please leave your comment and support me with like if you agree with my idea. If you have a different view, please also share with me your idea in the comments.
Have a nice day!

XAUUSD Short positionIt has been a long time since I last posted here. But, starting my 2022 right. So my first entry; since XAUUSD had a massive break out which i believe requires a reversal. First zone that im looking at is 1818 area but i believe we may also hit 1790 level or lower. Let's see how this trade goes :)

USDZARUSDZAR 4H structure
knowledge combo here
-seeing a possible double bottom
-equal lows
-90% rule completion
Although there's a major trendline under my level of double entry and an OB i think we gonna go for the fresh zone up before falling

QCOM Fake-Out BreakOutEarlier this month, I posited the idea that QCOM was trading in a consolidation pattern. The idea was simple, go long on a breakout and short on a break down. The trade triggered to the long side and since then, the stock has retraced. However, I noticed a pattern that I call the "Fake-out-break-out." If there is an actual name for this pattern, please let me know. Simply put, the fake-out-break-out pattern is a double fake out that stop hunts long positions and then traps short positions. The asset breaks to the upside for the long trade, retraces during a stop hunt and fakes the shorts out on the downside only to return higher. I have attached a similar scenario below. If this pattern holds true, the target should be 190+.

ADBE RETEST AGAIN AND BOUNCE BACK FROM STRONG SUPPORTAdobe Systems Incorporated (ADBE) is a large diversified software company that operates worldwide. The company deals in digital media and cloud services that allow customers to access the latest versions of its creative products. The stock had been a big winner over the last couple of years, more than doubling since the start of 2020. However, a recent disappointment in earnings erased the last few months of gains. With earnings estimates starting to fall, investors are now concerned that the bull run might be over.
The guidance forced analysts to drop earnings estimates for all time frames. For the next quarter, we have seen just a 1% drop over the last month, falling from $3.37 to $3.34.
But the stock bounce back after the false breakout and step again above $550.00 per share and above 50-Fibonacci retracement level drawn from March 2021. The stock gapped lower after EPS and then took out the 200-day MA and continued to lows not seen since June. If the bears want to push this stock lower, they must take that $550 level out and could push to the $450-500 area.
If the bulls want to gain some traction back, they need to take the $593.00 and 61.8 Fibonacci retracement level and then fill the gap at $600. Our statistic software notes a bullish pattern with a peak return of 4% in 1 month and a probability of 72%. Until then, the sellers will stick around.
Risk Disclosure: Trading Foreign Exchange (Forex) and Contracts of Difference (CFD's) carry a high-risk level. By registering and signing up, any client affirms their understanding of their own personal accountability for all transactions performed within their account and recognizes the risks associated with trading on such markets and such sites. Furthermore, one understands that the company carries zero influence over transactions, needs, and trading signals. Therefore, it cannot be held liable nor guarantee any profits or losses.

USD/CAD FALSE BREAKOUT AND CLEAR DIVERGENCECanada's inflation rate stays at an 18-year high of 4.7% on Wednesday. The data point released by Statistics Canada on Wednesday morning was in line with economist expectations, tying October's level, which was the highest inflation rate since 2003. Inflation rates are soaring around the world right now, as the combination of record government spending, supply chain disruptions, and a surge in demand for consumer goods has caused prices to rise quickly.
USD/CAD is currently at a 3-month high level and on a key resistance level. Also, it is on a few spots before 1.3000. Yesterday the currency pair makes a fall breakout of the key resistance level and close below 1.2882. The traders' sentiment stays unchanged and more bulls on the market are prevail but the bears are waiting to see how the price will react from these levels. On a daily chart, they notified clear bearish divergence confirmed on MACD and RSI oscillator indicators.
If the price drop below 1.2754 it would be a clear signal that the bearish divergence is confirmed and probably more bears would be activated on the market. If the price starts to fall it can reach price levels around 1.2625 or lower to the key support around 1.2300. If this level doesn’t stop the price from falling we can see the drop to the key psychological support level around 1.2000.
If the bull sentiment on the market remains unchanged and the price break through the current price level again and stay above, it is possible to see the 1.3000 level be reached very soon.
Risk Disclosure: Trading Foreign Exchange (Forex) and Contracts of Difference (CFD's) carry a high-risk level. By registering and signing up, any client affirms their understanding of their own personal accountability for all transactions performed within their account and recognizes the risks associated with trading on such markets and such sites. Furthermore, one understands that the company carries zero influence over transactions, needs, and trading signals. Therefore, it cannot be held liable nor guarantee any profits or losses.

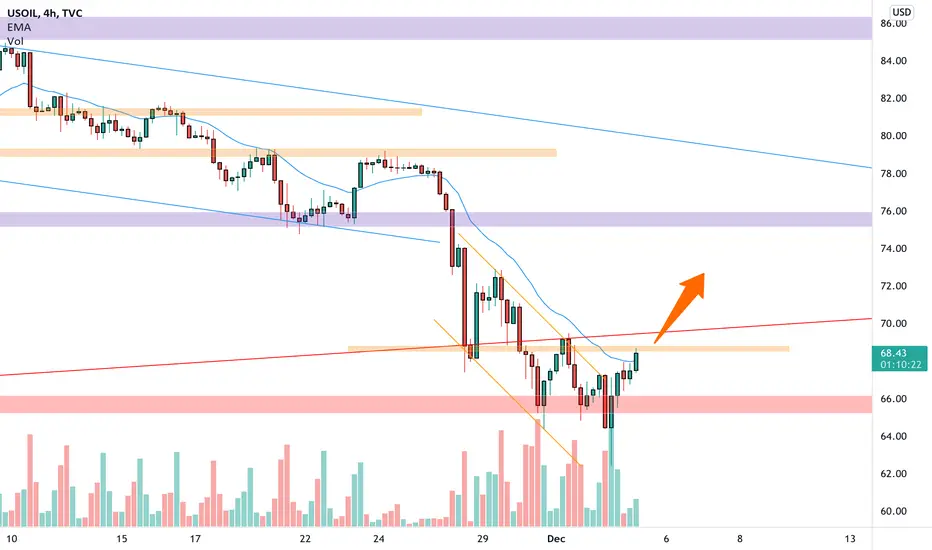
USOIL time for a pullback? 🦐USOIL on the 4h chart has tested the weekly support and attempted a break.
Currently, the market has broken the descending channel and approaching the 4h resistance.
According to Plancton's strategy if the market will break above and satisfy the ACADEMY rules we will set a nice long order.
-––
Follow the Shrimp 🦐
Keep in mind.
🟣 Purple structure -> Monthly structure.
🔴 Red structure -> Weekly structure.
🔵 Blue structure -> Daily structure.
🟡 Yellow structure -> 4h structure.
⚫️ Black structure -> <4h structure.
Here is the Plancton0618 technical analysis , please comment below if you have any question.
The ENTRY in the market will be taken only if the condition of the Plancton0618 strategy will trigger.
Strong movements after false breakout.We can see a false breakout.. That means strong movements is coming!
The price will consolidate above the upper border of the resistance zone and continue to climb.
My target is around 0.7280

False breakout before going down.After the breakdown of support it went sideways..
The local trend is now a downtrendd and the price is trading in the upper border after a false breakout. I'm gonna wait for the fall!
My first target is 0.91957.
Second, 0.91890

DOT technical analysisHello everyone, welcome back.
* This is not a financial advice, trade on your own risk management *
looking at Dot chart, and also analyzing Total market cap with it, we can figure out 2 things :
1. we have a trend line on dot chart in which everytime we hit the bottom, we bounced off and made a new high.
2. every bottom we made on dot, was also made by Total market cap hitting the bottom as well.
no we can see that our trend line is broken in dot, but we can see weakness in the breakout, So I can pretty much tell that its going to be a false breakout ( there is no good momentum candles to confirm this breakout ).
* Tip1 : Every time price fails to break a level, there is a good momentum made on the opposite side run *
So I expect we have a run toward top again, as you can see on the chart, my targets are marked with arrows.
Good luck.
don't forget to like and subscribe.

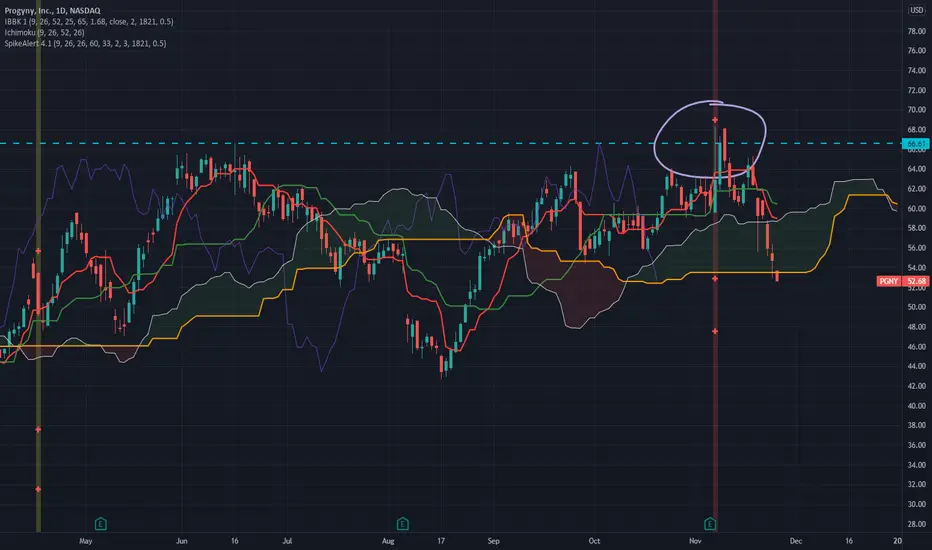
Progyny False BreakoutPGNY making me sad but my average cost is much further down. The spike on earnings earlier in the month is an example of a false breakout. You just never want to see this type of price action on a new high or ATH. Mark it in your mind as a pattern to take profits or cut the breakout trade.
DOGE - false breakout as a good buying opportunity❗Doge is near the key level. The price starts to squeeze, a signal for a breakout, but at the same moment big capital starts to buy back bitcoin and we see big volume in the footprint. This is a signal for growth. Therefore, a false breakout of a key level could be a good buying opportunity.
Write in the comments all your questions and instruments analysis of which you want to see.
Friends, push the like button, write a comment, and share with your mates - that would be the best THANK YOU.
P.S. I personally will open entry if the price will show it according to my strategy.
Always make your analysis before a trade.

CTK - are the bears trapped 😱❓Bitcoin, along with the whole market, continues its decline. Yesterday CTK broke through the key level of $1.62, after which we did not see a strong momentum downwards, the price consolidated and has now broken through that level upwards. If this bar closes above the key level, a bullish structure will form on the chart - a complex false breakout. In this case, it could be a bear trap that the big players are using to collect liquidity. As a result of a false breakout, the price can reach the targets that are marked above.
But be careful with your risk management, as bitcoin might fall even lower, to $53-54K. Which would actually pull the whole altcoin market with it.
Write in the comments all your questions and instruments analysis of which you want to see.
Friends, push the like button, write a comment, and share with your mates - that would be the best THANK YOU.
P.S. I personally will open entry if the price will show it according to my strategy.
Always make your analysis before a trade.
