EURGBP appears false bear breakout we can buyEURGBP appears false bear breakout we can buy
EURGBP
TYPE : BUY
TF : H2
ENTRY PRICE : 0.8415
STOP LOSS : 0.8380 (35 PIPS)
TAKE PROFIT : TP1: 0.8435 TP2: 0.8465 TP3: 0.8590 TP4: 0.8527
Falsebreakout

EURNZD on a false breakout 🦐EURNZD on the 4h chart tested a few times the weekly support.
The market a false breakout took the liquidity and is now testing a 4h resistance at the 1.62 level.
According to Plancton's strategy if the price will break above and the ACADEMY conditions will be satisfied we will set a nice long order.
–––––
Follow the Shrimp 🦐
Keep in mind.
🟣 Purple structure -> Monthly structure.
🔴 Red structure -> Weekly structure.
🔵 Blue structure -> Daily structure.
🟡 Yellow structure -> 4h structure.
⚫️ Black structure -> <4h structure.
Here is the Plancton0618 technical analysis , please comment below if you have any question.
The ENTRY in the market will be taken only if the condition of the Plancton0618 strategy will trigger.

GOLD intrady setup. Maybe 1840 first before 1760. 10/11/21GOLD price if could hold above wedge pattern support line may reach around 1840 , just breaking the long term down trend line (Red) for the "sake of " trapping" "trend line breakout " trading traders...

IT CAN TOUCH 1750Horizontal Support
Resistence Become Support
Moving Average support
False breakout
Bullish candle is foam

BTC Quick Correction!Money Makers!
From what I'm seeing right now on the weekly TF Bitcoin has made a higher high but at the same time, it looks like a false breakout based on the previous candlestick. With that being said the bears are trying to gain temporary control to bring the prices lower to the next support. We all know when Bitcoin corrects, it happens very quickly. If you're looking to short it, I have mapped out the percent you'll gain shorting to the mapped S/R zones.
Love it or hate it, hit that thumbs up and share your thoughts!
It's all about Market structure, Area of value, and Entry Trigger.
Don't trade with what you're not willing to lose. Safe Trading Calculate Your Risk/Reward & Collect!
This is not financial advice.
Simplicity Wins

Bitcoin FALSE Breakout - What it means and how to spot them...As a followup to my Tradingview idea warnings about the false breakout on the INDEX:BTCUSD weekly chart this video looks at other examples of this pattern. Be patient when price approaches major or All Time Highs. All you need is to wait for confirmation and price will tell you which way it is going! Examples: NASDAQ:AAPL , NASDAQ:TSLA , NASDAQ:COST , NASDAQ:ROKU .

Yikes Bitcoin... this is NOT the price action bulls want!A core principles of good trading is CONFIRMATION . A core principle of Technical Analysis is closing candles. A good trader waits for confirmation of their trading indicator before entering a trade.
One of the key things I trust in my trading and advocate to others is to wait patiently for a candlestick to close to confirm a break of a certain level. Before I will sign off on "the continuation of the bull run" the Weekly bar MUST close above the last All Time High. What we are seeing as the week drags on is not much strength...
There are still a few days left in this candle so we cannot write it off yet but should the break not hold the risk increases of a... DUN DUN DUNNNNN: False Breakout!

GBPUSD: False breakout from resistance.GBPUSD: The false break of the resistance at 1.3655 and the reversal hourly candle alongside with overbought RSI readings make a retracement towards 1.3610-15 a probable scenario. We will set our stops above the highs targeting 1.3620 and 1.3600.

Wait for a clear signal to trade with XAUUSDH1 time frame.
Structure: The price has formed a new high confirming the uptrend.
After forming a new peak, the price is showing signs of retesting at the 1765 price area. Here, waiting for the bullish candlestick pattern to appear, you can enter a buy trade with XAUUSD.
The profit target is the 1785 zone.
However, with a bearish structure on a large time frame, the risk of this trade is quite high when there exists a double top with divergence signal. There is no confirmation yet, so a fake breakout could still appear here.
Therefore, capital should be properly managed in this case. The key level is also clearly visible at the 1748 zone.
In the case of a false breakout, a down move to the 1720 zone is possible.
-----------------------------------------------------------------------------------------------
Wish you all have a good trading day!

USDJPY: High WipeThe high wipe had to happen, we couldn't sell simply from a trendline breakout.
This was a trap, now that the trap is out of the way we can look for sell opportunities.
I expect one last purge of the highs before we collapse into equal lows.
Leave a comment and/or message us on how we can improve and provide better content, we are open to suggestions to create a better experience for you!
Keep in mind that the analysis provided is not 100% accurate and that you can never be certain of the markets. This information given is not financial advice, always do your own research.
Thank you for reading,
Cheers to many pips!

CHFJPY : POSSIBLE WEEKLY/MONTHLY UP SWINGAs we can see on the chart, price consolidated above major support zone taken from the monthly chart.
If we zoom in to the weekly time frame, we can see a false break from the recent lows and rejection from the bottom of the channel.
If we zoom in to the daily time frame, we can see a "V shape" and a small retracement above the previous weekly lows, suggesting price will continue further up.
Best of luck :-)

DOLLAR INDEX : big drop scenarioBy looking at the graph, it appears that we are in a reversal area within the converging triangle.
All that remains is to wait for the trigger to start the move.
best of luck :-)

GBPCHF Good Sell opportunity!Hey Guys,
Based on the chart, there is a good sell opportunity on GBPCHF. But let check the chart and see what is happening right now:
-----------------------------------------------------------------------------
1. False Breakout happened on a uptrend channel -- Based on the candlesticks ( Bearish )
2. Price is in a downtrend ( Bearish )
3. Price reached a resistance area and rejected strongly ( Bearish )
4. Hidden divergence on RSI(14) ( Bearish )
5. Price reached to 0.5 Fibonacci ( Bearish )
6. Small uptrend channel not broken yet! ( Bullish )
---------------------------------------------------------------------------
So Based on the top scenarios, I have bearish bias about the next movements of price which can also have a good risk reward raio. But considering risk management rules in a necessity and have not be ignored.
But let's see what do you think about GBPCHF on H1 timeframe. Are you bullish or bearish? - Please write your ideas on the comments.
Any idea is valuable for us!
Thanks for being and supporting us.
Good Luck!

BTCUSD ⚡ False breakout 📈It is quite possible to expect a false exit, but very soon I see a trek to the top of Bitcoin and other assets.
We have such a perfect side that it is impossible to convey, everything is like in a book. Take, trade and earn.
Have a nice trade!
Your Solldy.

AUDCHF🤑Head and shoulders 📉At this point, the price is finishing drawing the inverted head and shoulders pattern. It can be seen very well on the daily chart, it was expected that the price will reach the resistance level, but when the channel is broken through, the sellers pushed the price. So in connection with a false channel breakout, I expect a local fall right up to the center of the descending channel, but the general priority for now is to buy.
Have a nice trade!

GBPJPY : Buying opportunity
It seems like GBPJPY can go higher from here (On the chart critical zones and targets) .
* Idea is valid as long as price will not close under the blue line zone .
best of luck :-)

TSLA: It just did what was expected. What to expect now?Hello traders and investors! Let’s see how TSLA is doing today!
Since our previous analysis, last week, it did absolutely nothing surprising, as TSLA just hit our second target/resistance, and we already discussed a scenario where it would do a pullback in the daily chart:
“Even if it does a pullback, it won’t ruin the bullish bias. We have too many supports to hold TSLA if it drops, like the $ 732, the $ 717, the 21 ema , and even the purple trendline.” The link to my previous analysis is below this post, as always.
Today, the 21 ema is holding the price, and so far, we are trading above it, which is good news. What's more, we have a Dragonfly Doji in the daily chart. If we look into the 1h chart, we’ll find more clues:
Yes, TSLA did a classic Exhaustion Bar , slightly below the previous support at $ 724, and it confirmed a false breakout when it reacted above this support level.
The volume spiked as well, and now TSLA is prepared to do a real good bullish structure. So far, we only have good signs, but nothing concrete about a bullish reversal.
Let’s wait for more information in the next few days. If you liked this post, remember to follow me to keep in touch with my daily updates, and please, support this idea if it helped.
Have a good week!

DISHTV on breakout!!!!I think it will be false breakout . So be cautious on DISHTV,
My Target 13.55, 11.10

False Breakout? It is possible!Although the JOLTS Job report was higher than anticipated, it did not phase Gold (XAUUSD) as such. This pattern was formed well before the report, and it was bound to break out. Key things to note:
1. Major support at 1780 level
2. Possible T/P at 1794
3. If it is a true breakout, levels can drop to 1765, which is the next support.

USDJPY, H4 - ranging marketPrice is moving in range making some false breakouts. It is difficult to catch significant move. It is better to wait until clear breakout and retest of S/R.

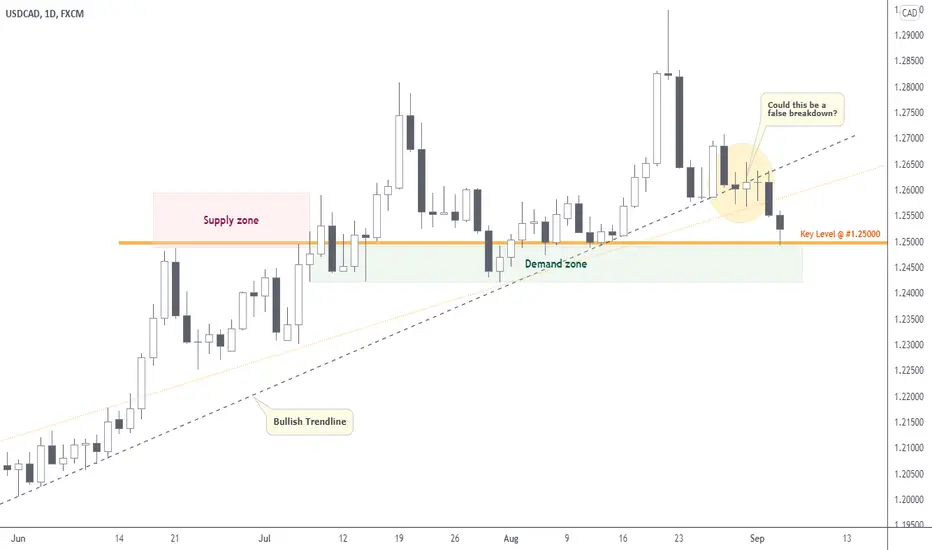
USDCAD | Perspective for the new weekMy last speculation saw the price move over 150pips in our direction before the bulls took over ( see link below for reference purposes). Since breaking above the $1.25000 level in July 2021, I am labelling this level to be a very strong demand zone for the Greenback considering that the obvious that it has held price "supported' in the last couple of months. Since the value of the Loonie is directly connected to the oil situation. It is important to take into consideration that oil inventories are currently down from what they used to be prior to the Covid-19 pandemic. Coupled with the Hurricane Ida situation, there is more supply than demand which could have a negative impact on the Loonie in the coming week(s).
Tendency: Uptrend (Bullish)
Structure: Supply & Demand | Trendline
Observation: i. Since hitting a peak @ $1.29500 on the 20th of August 2021, the price of USD have tumbled drastically and it is finally at our Demand zone.
ii. The visual representation of a line drawn under pivot lows reveals the prevailing direction of price since June 2021. However, a sudden Breakdown of this Trendline (whatever way you draw your line) during last week trading session cast some doubt on the Bullish tendency on this pair.
iii. At this juncture it is indeed appropriate that we remain patient and observe how price reacts to the Major Demand zone @ $1.25000/1.24200 area for confirmations.
iv. To support my Bullish expectation on this pair, I shall be looking for rejections or engulfing candles off of the Key level @ $1.25000 (above key level - safe haven) in the coming week(s).
v. Should price drop below Key level, then this will make the Breakdown of Bullish Trendline valid. Hence, a retest shall give me no choice but to switch bias in support of the Bears... Trade consciously!😊
Trading plan: BUY confirmation with a minimum potential profit of 250 pips.
Risk/Reward : 1:4
Potential Duration: 3 to 7days
NB: This speculation might be considered to make individual decisions on the lower timeframe.
Watch this space for updates as price action is been monitored.
Risk Disclaimer:
Margin trading in the foreign exchange market (including commodity trading, CFDs, stocks etc.) has a high risk and is not suitable for all investors. The content of this speculation (including all data) is organized and published by me for the sole purpose of education and assistance in making independent investment decisions. All information herein is for your reference only and I take no responsibility.
You are hereby advised to carefully consider your investment experience, financial situation, investment objective, risk tolerance level, and consult your independent financial adviser as to the suitability of your situation prior to making any investment.
I do not guarantee its accuracy and is not liable for any loss or damage which may result directly or indirectly from such content or the receipt of any instruction or notification therewith.
Past performance is not necessarily indicative of future results.
False breakout or Bulls dominance?There's 2 possible outcome for this case:
1) Price confirmed its bear trendline breakout and continue ranges between the rising channel.
2) False breakout, price hit the bear trendline and drop significantly.
LEAVE A LIKE AND A COMMENT - I appreciate every support!

False breakout or Bear dominance?The price had break out through the channel over the past two days but it has retrace back to the channel for now.
As the price continue to rebound respect to the rising triangle pennant, the market direction are still yet to decide.
