$SUSDT (or S , ex FANTOM): good entry for a long setupCrypto Market Outlook
The overall crypto market is in a clear uptrend.
The money printer is running, and USD dominance is dropping — all signs pointing to a potential continuation of the rally in the coming months.
Unless a black swan event hits, it's not too late to position yourself if you’re still on the sidelines.
⚠️ Always manage your risk with a proper stop loss — altcoins move fast and can reverse just as quickly.
One interesting setup: $S
✅ Relatively new
✅ Didn’t pump too hard
✅ Broke out of its downtrend
✅ Found solid support
The Fib levels offer good targets for take profit zones.
🔍 Ideal entry: within the green box or lower.
Let the pump cool off — it could offer a perfect entry opportunity. Be patient and wait for a good position.
If $S pumps from here without retrace:
→ Jump in with a tight stop loss
→ Or look elsewhere for a better risk/reward setup.
DYOR.
#Crypto #Altcoins #Bitcoin #ETH #Trading #CryptoMarket #TechnicalAnalysis #RiskManagement #DYOR
Fantom

FTM Delisting | OFICIALLY Becoming SONIC (S)Although a name change for FTM was announced in Aug 2024 already, many exchanges still list FTM, and this will soon change.
It is expected the Fantom will officially be delisted and become SONIC within the next two months.
In August 2024, Sonic Labs announced that they would be replacing Fantom with a new token called Sonic (S). Sonic Labs have confirmed that all existing FTM holders would be able to convert to S at a fixed rate of 1 FTM : 1 S. However, many exchanges will only transfer now, as they will finally be delisting FTM for good and converting all FTM S. This will be done at a conversion rate of 1:1.
_________________________
Make sure you don't miss the latest ETH update, since BTC is likely heading towards a new ATH and ETH stands much more to gain.
_________________
CRYPTO:SONIUSD
POLONIEX:FTMUSDT

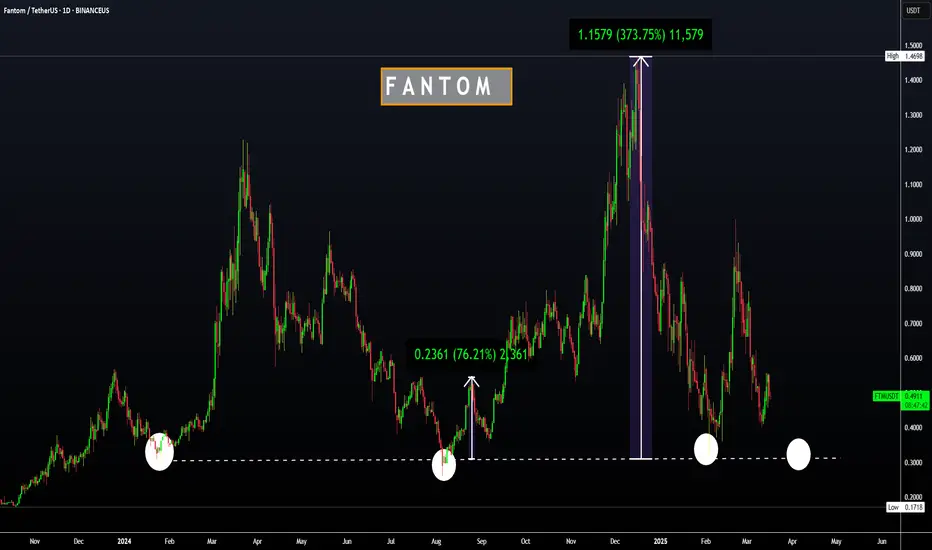
FTM - Time to Lock In for a 2x Ride to $1?Fantom ( UPCOM:FTM ) is sitting on its key floor support zone. A level that has historically triggered 50% to 100% pumps. Now, price is coiling within a triangle and looks ready to break out.
Could this be a start of a run to $1?
Let me know your thoughts below!
Kindly support this idea with a LIKE👍 if you find it useful🥳
Happy Trading💰🥳🤗

SUSD 4H Chart – Easy Trend with RSI Signal!SUSD on the 4H chart is in a steady uptrend within a channel since February. After a drop to the 0.285 level, it’s now at 0.382, sitting near the channel’s midline. RSI is at 54.26, showing neutral momentum—room to move either way. The yellow line suggests a potential push to the channel top at 1.0000000 if the trend continues. On the downside, 0.3500000 is key support to watch.

ALTS Shine, +55% INCREASE !! FTM | RNDR | Render and Fantom have made steep increases over the past two weeks.
In the past two weeks, FTM increased a whopping 55%:
And RNDR increased around the same amount:
This naturally makes it likely to see a correction soon, which may be the ideal time to get into the accumulation boat - or just for a swing trade.
________________________
GEMINI:RNDRUSD CRYPTO:FTMUSD

FTM | FANTOM | Altcoin with GREAT UPSIDE POTENTIALFTM has recently increased 11% in the weekly, but is making more red candles in the daily and the impulse up seems to be over for now.
Looking at the corrections, from -45% to -80% is not uncommon for Fantom.
The good news, is that the bottom is likely close - and from here, there exists great upside potential.
I am NOT saying we can't fall lower here - infact, a full retracement may be likely, just as we saw the previous cycle. In which case, the upside is even bigger. 30c is indeed a very popular demand zone:
_____________________
BINANCEUS:FTMUSDT
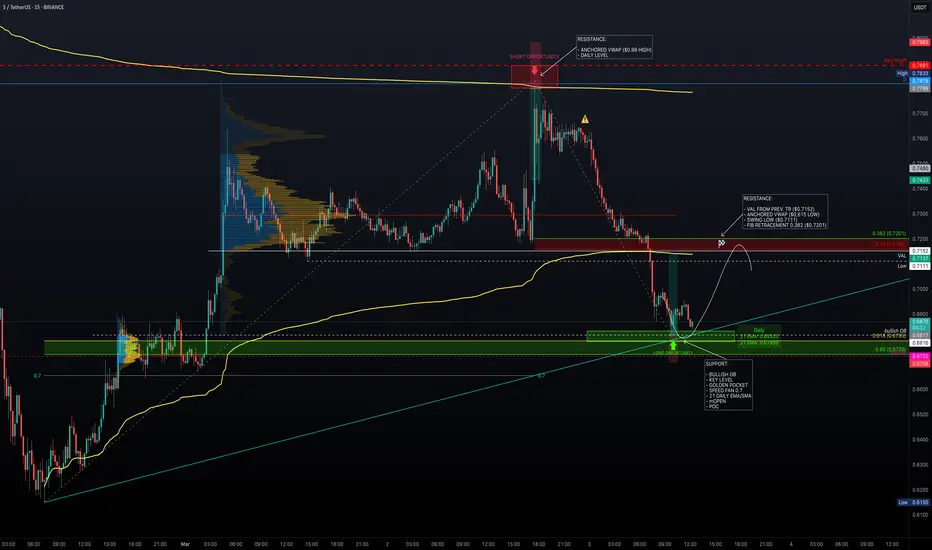
Major Levels – Is Sonic Ready to Pump?After reaching the daily resistance level ($0.7818), price faced strong rejection. The anchored VWAP, acting as dynamic resistance just below the daily level, provided additional confluence for a low-risk short opportunity.
Additionally, a key high at $0.7891 further reinforced this resistance zone. Following the rejection, price sharply declined -13%, retracing back into the previous trading range.
Support Confluence
Price is now approaching a well-defined support zone:
Bullish Order Block: $0.6816
Key Level Near Order Block: $0.6803
Golden Pocket (Fib 0.618 - 0.65): 0.618 at $0.6793 & 0.65 at $0.6739
Monthly Open: $0.6732
Point of Control (POC): $0.6732 (aligning with Monthly Open)
Daily 21 EMA/SMA: 21 EMA at $0.6835 & 21 SMA at $0.6790
Fib Speed Fan 0.7 (from $0.615 to $0.7818): Providing additional support in this zone
Long Trade Setup
Entry Zone: $0.6816 – $0.6732
Stop Loss: Below the Monthly Open ($0.6732)
Take Profit Zone: $0.7111 – $0.7201
Risk-to-Reward (R:R): 3:1 R:R setup, offering a high-probability trade
Take Profit Targets & Resistance Zones
Previous Swing Low: $0.7111 (untested)
Value Area Low (VAL): $0.7152
Anchored VWAP (from $0.615 low): $0.7137
Fib Retracement 0.382 (from $0.7818 high to current low): $0.7201

Fantom FTM => Sonic S price analysis💱 At the beginning of January 2025, the rather old #Fantom project #FTM rebranded to #Sonic #S
‼️ The previous history of #FTMUSDT trading disappeared from the charts, but we have recreated it for you on this OKX:SUSDT chart
Unlike most altos, the price is held and rounded up.
🆗 We have schematically depicted the levels for trading and the possible price movement of the #S on the chart.
In the long term, we can see growth to $8-8.50
_____________________
Did you like our analysis? Leave a comment, like, and follow to get more

Sonic - time to pay attention - longMarket is bleeding but Sonic gain some momentum after bottoming out?!
Sonic total value locked explodes, and I think the price soon should follow. Big money are likely positioning for Sonic airdrop. I think it's logic that we see Sonic grow from here a few weeks ahead
Daily close above 0,517 and Sonic looks strong to go long again!

S 1D - FTm 1D Hello, should we finally say goodbye to Sonic
After the launch of Sonic, the price has dropped from $1.47 to 54 cents, which is not a normal or natural drop at all.
This project reminds us of the former Matic, when the network and its name changed, the token price went into a crisis.
Currently, after holding this token for 3 years, there is no hope for its future, and I believe that the price will soon decrease to 30 to 33 cents.
We can only expect an upward movement if the price stabilizes above 84 cents."

bullish debut of trading for S Sonic former FTMthere is very little history so far and it has only traded on MEXC so far therefore this analysis is likely to be low-precision
but it looks like S by sonic is on a short term parabolic growth, somewhere around its launch ATH value may be the random point of retest (low accuracy as more exchanges list it...) but otherwise can continue its journey with 1$+ values. Let's watch
Opening a fun long here

Breaking: Fantom ($FTM) Faces Turbulence Amid Coinbase DelistingOverview
Fantom ( UPCOM:FTM ), a popular blockchain platform known for its speed and scalability, is under the spotlight following Coinbase’s decision to suspend its trading. This move, effective January 24, 2025, has sent ripples through the market, sparking fears of a potential price dip to $0.50. Despite this looming challenge, UPCOM:FTM has shown short-term resilience, with a slight uptick in its price. However, technical indicators suggest a bearish trajectory, warranting close observation from traders and investors alike.
The Delisting Announcement
Coinbase, one of the leading crypto exchanges, announced the suspension of UPCOM:FTM -PERP trading across its platforms, including Coinbase International Exchange and Coinbase Advance. The final settlement price will be calculated based on the average index price 60 minutes before trading ceases. Open positions will be automatically settled at the time of suspension, with funding rates set to zero for the final funding period.
This announcement coincides with the ongoing scrutiny of Coinbase by the US Commodity Futures Trading Commission (CFTC) in connection to the Polymarket investigation. The regulatory body has issued a subpoena to Coinbase, seeking customer-related information, further adding to the uncertainty surrounding $FTM.
Current Market Performance
Despite the negative sentiment, UPCOM:FTM ’s price has risen by 5.38% in the last 24 hours, reaching $0.6953. However, the token remains down by 11.80% over the past week and 41.62% over the past month. With a 24-hour trading volume increase of 0.35% and market cap growth of 6.56%, UPCOM:FTM appears to be attempting a recovery from its recent losses.
Nevertheless, bearish sentiments dominate, as evidenced by a volatility rate of 22.52%. The market’s response to the delisting announcement and regulatory developments will likely dictate the token’s short-term trajectory.
Upcoming Developments: Sonic Rebranding
In a bid to counter negative market sentiment, Fantom is undergoing a rebranding initiative. On January 13, 2025, UPCOM:FTM will transition to a new identity, “Sonic,” with a 1:1 token swap ratio. Binance, a major supporter of this transition, will enable deposits for Sonic on January 16, 2025, and open trading pairs shortly thereafter. This rebranding could provide a fresh narrative for the project, potentially mitigating some of the damage from the delisting.
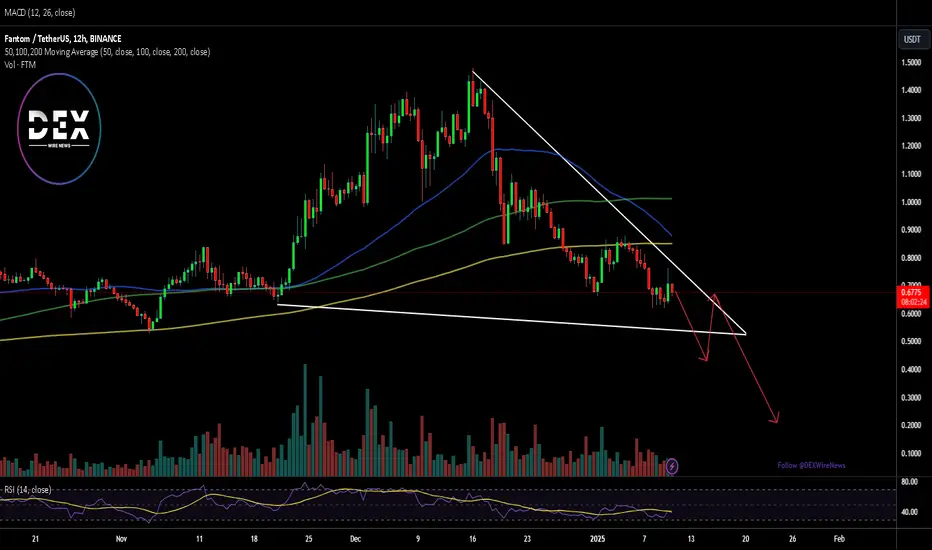
Technical Analysis
As of this writing, UPCOM:FTM ’s RSI stands at 39, indicating weak momentum and oversold conditions. The token’s chart reveals a falling wedge or bearish symmetrical triangle pattern, signaling a potential downward breakout. A close below the current candlestick could trigger a selling spree, with UPCOM:FTM potentially testing the $0.50 support level.
Fundamental Concerns
1. Regulatory Pressure: The CFTC’s investigation into Coinbase adds an additional layer of uncertainty, impacting both the exchange and tokens like UPCOM:FTM listed on it.
2. Market Sentiment: The delisting has raised questions about UPCOM:FTM ’s future accessibility and liquidity, contributing to bearish market sentiment.
3. Rebranding Efforts: While the Sonic rebranding initiative is a positive development, its success will depend on market reception and execution.
Conclusion
Fantom ( UPCOM:FTM ) faces significant challenges following Coinbase’s delisting announcement and ongoing regulatory scrutiny. While the token’s short-term resilience is commendable, technical indicators and market sentiment suggest a bearish outlook. The upcoming rebranding to Sonic offers a glimmer of hope, but traders should remain cautious and monitor key support levels.
FTM 1DHello, as you can see, the situation of Fantom is very bad and the important support that started from the bottom of 25 cents is breaking. I expect a drop until January 16th until it is listed again on all exchanges.
In any case, if we go below 66 or 65 cents, we can reach 35 or even 33 cents.
My personal opinion is a bearish scenario. I don't have much hope for price growth.

FTM/USDT: Wave Pattern Signals Potential 80% Upside | Key Levels
Technical Analysis:
1. Price is currently at $0.7892, down 4.63%
2. Wave structure suggests completion of ABC correction at point (C)
3. Fibonacci retracement level at 0.786 aligns with potential reversal zone
4. Two target zones identified:
- First target: ~$1.20-1.30 (Wave 3)
- Second target: ~$1.30-1.50 (Wave 5)
Trading Setup:
- Entry zone: $0.75-0.78
- Stop loss: Below point (C) around $0.70
- Risk:reward ratio approximately 1:3 for first target
Key Points:
- Bullish divergence forming at current levels
- Price testing ascending trendline support
- Wave structure suggests start of new impulsive wave up
Caution:
- Wait for confirmation of reversal with price action
- Consider position sizing due to crypto market volatility
- Monitor BTC correlation for trade validation

FTM/USDT Bulish and Correction As you can see, All targets of my last Idea about bearish FTMUSDT is touched and right now it is possible to touch these prices less than 2 weeks.
Previous IDEA:

Bad news FTM holders markets require more blood sacrificeThe price action of the past few days from the latest bottom of 66 cents seems to have been a bearish retest.
the massive long term support has turned into resistance
the bearish retest has been completed
now down again
RSI also has hit resistance.
more blood more pain
the bit question is when after 68-69 cents is reached:
double bottom confirmation and bottom is in, with rising RSI
or
max pain, max blood scenario of visiting 53 cents with also rising RSI, forming a bullish divergence?
the second part remains to be seen in several days
first part is clear
more blood from FTM holders
sorry, bulls
This is a SHORT-TERM analysis only

FANTOM/USDT- AnalysisThe yellow scenario almost happened and it fell by 13%
In my opinion, the correction is finished and it starts moving upwards

should we assume deviation and downtrend breakout for FTM?let's see if this breakout holds. FTM massively broke down and then broke down some more, but could be considered deviation. Either way, we can now look forward to a potential scenario of retesting the HTF support and resume return to upward move.

Regular and principled...hello friends
We came up with FANTOM currency analysis.
This potential coin, which is active in the DEFI field, has been able to grow well by forming an upward channel.
Now we have specified the purchase limits for you in case of modification.
Now it is logical to buy one step, but in case of correction, we can wait until the specified areas and then make our purchase.
But in case of successful failure of the channel, we can still buy and move with the specified goals.
Note that this coin has a high growth potential....

Fantom at a CRITICAL LEVEL!!! Make it or Break itUPCOM:FTM
5-10x potential to previous all time high.
Beautiful price action on higher timeframe. Since the bottom in 2022, price has made 3 higher highs signaling bulls are back.
Price is currently at a critical level.
On the 2 week chart we have broken above the 50 RSI and we are now retesting the 50 (ideal entry). Price has currently retraced to the 0.618 fibonacci retrace of the latest impulse.
Monthly timeframe’s also at an ideal entry. After making a new higher high and closing November with a huge bullish expansive and engulfing candle, price is currently trading at previous month lows.
Will it hold?

Bearish monthly for FTM S more dump incomingFTM S monthly broke through critical support on the HTF and is now poised for further downward correction. Don't worry, maybe when they launch new charts with S, it will not be visible. We will, however, remember...

FTMUSDT - All eyes on Sonic!Weekly chart displays A very strong support level where the price is expected to rebound significantly, located at the 0.75 area
This zone converges several weekly supports, including the 50 EMA, the 0.5 Fibonacci level, and the upper side of the symmetrical triangle pattern.
accumulation is suitable now and up to the 0.7 level.
On January 13, 2025, the token will automatically be rebranded to (S) , meaning Sonic .
This represents an upgrade to the FTM token, similar to what happened with RNDR transitioning to Render .
This is a significant update to FTM’s infrastructure to align with leading projects in the space.
And as a token supported by Dubai, you can be confident in its bright future.
Buy between: 0.8 - 0.7
Targets: 1 - 1.6 - 3.5 - 7.5 - 21
Best regards Ceciliones 🎯
