FTM Full Analysis For Long-TermHey Guys… How are you today? 👋👋
It's a new day and I want to talk about FTM (Fantom)…
✔️ Before that, I want to remember It's not financial advice.
✔️ I'm just sharing my view and opinion of the chart. Please see and think about that. The situation is so complicated.
It's my duty to tell you something honestly.
But, first, I ask you to Like my analysis, follow me, and Share this analysis with your friends.
It will give me more positive energy to publish more analysis.
So, thank you for your support.
Let's go into details.
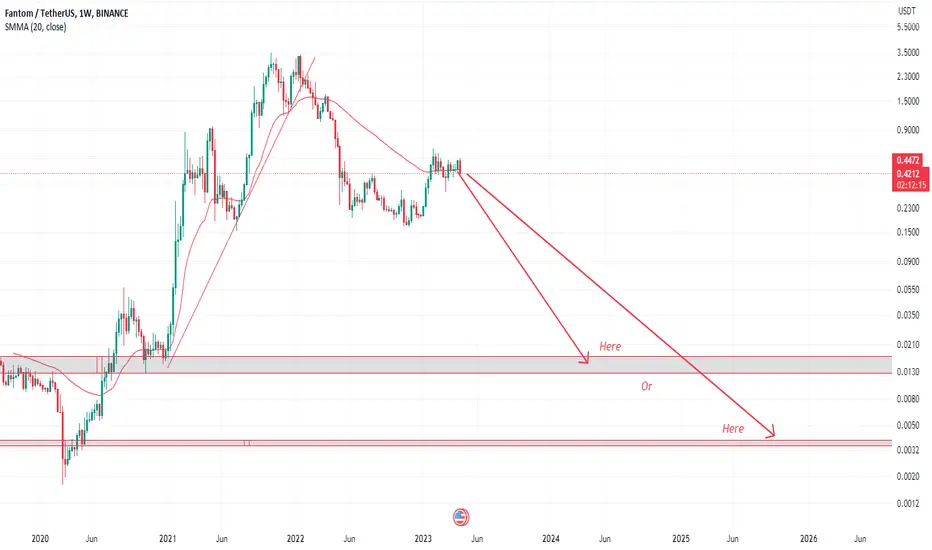
As you see, we have Three Main support zones. The first one is around 10-11 Cent, the second is between 5-6 Cent and the last one is around 3.5-4.2 Cent.
Buying on Shadow will be very exciting. So, I will put my order on 4 Cent.
I'm sure the first support will be lost soon. If you check this asset's chart in the weekly frame, you see a Head and shoulder pattern that the neckline is breaking.
So, we have to focus on this support and it's very important to us to money management.
By the way, there is good news for FTM, if you can buy FTM at the lowest level, this asset will give you a huge profit of more than 50,000% at the end of the Last Bull Market.
If you need to analyze in another time frame, for example, 4H or 1H, please send me a message
It takes about 4-5 Years. I think you should know the worth of this asset and this huge profit … can you imagine this profit? 🙈 🙈
I want to buy and hold FTM on 3rd support zone and my final target to sell is around 20 USD.
I'm sure you are confused right now. But it's ok and there is no problem. Time proves everything.
If you have any questions, or if you need to know more details please don't hesitate to contact me.
🙏🙏 Please don’t forget to like 👍, follow ✌️, and share 👌 this analysis with your friends. Also write your comments below, Do you agree with me? do you think we are still on a downtrend? and what is the last target of this downtrend?
Thank you so much for your attention and participation 🙏🙏
Wish you the best 🧞♀️
Sincerely Yours
Ho3ein.mnD
Fantom

FTMUSDT (Which move will happen? A:FTM 3$ or B:FTM 0.015)Which move do you think will happen?
A : FTM = 3$ ? __or__ B: FTM = 0.015$
It does not stay in the middle. One of these will happen, comment your opinion

FTM will be soon real Fantom))There are 2 ways how the coin can go in the future
1. FTM drops until "Last support line before huge drop" and bounces from there back to 0.21$ price level, which it should break to continue ascending move
2. It comes to the "Last support line before huge drop" , breaks below 0,16 - 0,15$ in this case we will see the price even lower where my FVGs are (green lines)

FTMUSDTHello friends
The price chart has reached an important support zone and the price zone of $0.1724 is maintained.
Ichi Moku has issued attractive signals on the daily and 4-hour time frames. To confirm this signal, we need to look for a break of the relatively long-term downtrend line.
👉 If the downward trend line is broken and the range of $0.1724 is maintained, we expect the formation of an upward trend up to the price range of $0.4846.
what do you think?

FANTOM - Easy Corrective Play ✅Fantom is currently in Wave B correction = 3 subwaves. We have almost finished subwave B and looking to capitalise on subwave C.
Trade idea:
- Watch for a break of the red trendline for confirmation that we've started wave C
- Risk entry can be done on lower timeframe once reversal pattern appears
- Stops below price once red trendline breaks
- Target: 5 and then taper and get ready to short
Goodluck and as always, trade safe!

FTM 1DThis is my final analysis on FTM long and short term. The price of the floor covering and the most important support of FTM is 15 cents. If this support is broken, we will have a 50% drop
MOTHER ALL SUPPORT 15C

🔥 FTM Head & Shoulders: On The Edge Of DarknessFTM has been one of my favorite tokens during the bull-run, but has lost nearly all of its value over the last two years.
In my eyes, there's potential for more bearish price action in the future. I think that FTM can fall as far as 0.05 USD. Consequently, this would be my ideal area to step in for a long-term position.
I'm waiting until the price closes below the neck-line of the pattern before making an entry, which is safer.

Ftm Preparing For Move Towards 0.50seems like has bottomed out and formed falling wedge in daily tf and approaching towards trendline incase of breakout expecting massive bullish rally
incase of successful breakout expecting move towards 0.50$ keep eyes on for breakout

1H SignalHello
You can take long position after fixation breaking out.
Don't forget SL/TP.
A nice double bottom.

FTM could turn bullish soonHi, dear traders. how are you ? Today we have a viewpoint to BUY/LONG the FTM symbol.
FTM ascended from where I entered "origin of motion" and removed 3 supplies and created ascending CH. The move continued until it reached a strong resistance, which I have marked with a yellow circle, and from there it underwent a correction after collecting many sell orders.
Now after a lot of correction it is coming back to the "origin of motion" where I think there are a lot of buy orders left. By hitting this area and collecting buy orders in this area, it can move up.
When the orders are collected and we move up, I have specified 2 TPs, but it is not necessary to be able to move up to the second TP. So you should take some save profit when we get to TP 1 and place your stop on the entry or you can completely exit the market at TP 1. It's really personal and up to you.
Also, in the chart, we have liquidity pools that I have shown with $$$. Pool 1 has been collected, but pools 2 and 3 have not yet been collected.
One thing you should know is that when candles reach a strong support/resistance and we have liquidity pools, after a CH, candles tend to collect liquidity pools ahead.
For risk management, please don't forget stop loss and capital management. Be sure to set a stop loss, because a smart trader will try to preserve capital before thinking about taking profit.
Comment if you have any questions
Thank You

Fantom Clean Long Trigger!!UPCOM:FTM - Long Trigger
#Fantom has reclaimed major support after sweeping the lows. This is a great entry trigger with clear invalidation ( wick low ).
A long here wouldn't be a bad idea IMO.
#ManageYourRisk
--------------------------------------------------------------------------------------------------
Every day the charts provide new information. You have to adjust or get REKT.
Love it or hate it, hit that thumbs up and share your thoughts below!
Don't trade with what you're not willing to lose. Calculate Your Risk/Reward!
This is not financial advice. This is for educational purposes only.

📈Fantom weekly --> 50% price jump📉BINANCE:FTMUSDT
BITFINEX:FTMUSD
Hello Traders, please check out my previous ideas.
If the price stabilizes above the indicated areas in daily or 4H timeframe--> 💥50% price jump💥
targets are on the chart.
optimum stop-loss is below the 0.215$ level.
✌💥If you are satisfied with my analytical content, please share my ideas💥✌
✍🐱👤Otherwise, make sure you leave comments and let me know what you think.🐱👤✍
🤑🍾Thank you for your support. I hope you will gain profit by following my analyses.🍾🤑
CrazyS✌

Dangerous breakdown!Hello
Be carful about your money in this market in particular FTM.
There is a essential trendline like a tons of gas on your money waiting a Spark.
I think it relates to Ukraine and Russia's war.

Good signal for reversing to 0.32Weekly Chart
Fantom BINANCE:FTMUSDT has ChoCh after closed above 0.5185 on Jan 30 2023
Daily Chart
BINANCE:FTMUSDT has buying pressure and it can be done a hammer candle
Chart 4H TF
Fantom is creating a divergence RSI and price, so it's a good signal for reversal
Wait for next move

FTM BULL FLAG ! Fantom has been moving like a snail lately.
I see a bull flag pattern forming up. If bitcoin stops being a bully to altcoins, we can go higher !
PUMP or Breakdown??
NFA,DYOR

Twin Bottom Pattern and Trading Risk MitigationIf we notice a favorable response, particularly around the $0.22 level, there might be a chance of a twin bottom pattern emerging, indicating potential growth for Fantom. As we proceed through this week, keeping a close eye on the $0.22 support level becomes crucial. Additionally, watching for RSI divergence and a break in the downward trend line on shorter timeframes can help mitigate trading risks.
FTM ""Double Bottom"" Weekly ChartFTM is looking great as it is also forming a double bottom on weekly timeframe. The higher the timeframe the better it is.
It also started to form bullish divergence on 4h timeframe as shared in the previous idea.
We need to wait for the BREAK and RETEST of the NECKLINE marked with orange dotted line.
LETS PUMP IT !!
DYOR, NFA

Fantom – Long Entry Based on wick fill.In a previous TV idea, I suggested a S/R flip long trade for FTM (linked).
Unfortunately, the market is bearish, and I think that this trade is not a high-confidence setup.
I would like to suggest another trade setup based on the wick-fill strategy. This trade has a higher chance of success IMO. Trade Idea
Entry: 0.2256 (50% of the wick)
SL: 20.90 (below the wick)
Target: 0.33
TP: 0.258, 0.33
R: R: 1:6.6

FTM Potential ""DOUBLE BOTTOM"" !FTM price consolidating in the GOLDEN POCKET ZONE.
Setting up for an amazing higher timeframe DOUBLE BOTTOM.
Wait for the confirmation to long after breaking the neckline of double bottom.
That is all nice and simple for you guys !
DO NOT FORGET TO DROP A FOLLOW TO GET REGULAR UPDATES AND FREE LONG SETUPS :)
NFA , DYOR !

Fantom FTM price time to "catch up" with the marketToday, let's take a look at the global chart of FTMUSDT
Finally, yesterday the altcoin market revived and started to grow, and XRP was the luckiest with the court decision that recognized it as a non-security)
The FTMUSDT price hasn't really grown much compared to many altcoins.
We can assume that the coin still has growth potential:
- The liquidity zone is $0.45-0.55 , and we would consider this zone as the first medium-term target where you can fix part of the profit on a long position.
- "the final", probably it should be called a long-term target for the FTMUSDT price in our opinion is around $0.80
_____________________
Did you like our analysis? Leave a comment, like, and follow to get more

FTM- Updated Chart 💹 FTMUSDT This has been a phenomenal trade for me and I am still holding half my position from 'entry uno'
0,322 is the resistance we must keep in mind now.
Hopefully Bitcoin will help break higher./.let's see:
0.40 is a valid target that can be achieved this summer and i think we are over 68% possible to see it happening
Then again, we could go parabolic but let's go step by step now and monitor the market and the charts so: 0.3049 is support, under there i do have a SL to secure more profit.
One Love,
The FXPROFESSOR

Fantom Weekly Elliott wave countFantom looking promising on log scale.
Price was rejected into 1.618 fib extension of an impulse that may be Wave 1 than moved down into a correction that may be an expended flat pattern.
The price held an important level from 0.1530.
Keeping 0.1642 level and than clearing 0.5468 it may start an impulse that may be the 3rd wave from a bigger degree 5th wave.
Hit the like button if you like my analysis and follow me for future updates!
Good luck!
