FTMUSDT H1:Long setup for tradeHI Guys ,Hope you well.
I explain you a Long setup in chart but please trade with confirmation in lower time frame .
SecondChanceCrypto
⏰27/JUNE/23
⛔️DYOR
Always do your research .
If you have any questions, you can write them in the comments below.and I will answer them.
And please don't forget to support this idea with your likes and comments.
Fantom

FANTOM 💎👻 - Small break and Off to 1.32Wow what a day... what a good day actually.
Price in ascending channel and probably time to take some profit (i did at least).
We have had many delays but 1.32 remains a valid target for the year.
Bitcoin helps, Alts can follow and FTM is one of the favorites.
one Love,
the FXPROFESSOR 👻
let's go!!!!!
(During the process we leave many followers behind. We remain loyal to those who stay💎)

Fantom – The Path Ahead, Deep DiveTLDR:
Unfortunately, Fantom lost all bullish structure.
The upside of this correction is that FTM’s price is good enough to DCA if you are a long-term investor. I provided the next support levels; in case you are interested.
I charted three scenarios, two relatively bullish and one bearish scenario.
I included two possible swing trade ideas. However, I must say, there are better trades out there, IMO.
Background:
On November 2022 fantom created a bottom in the region of 0.1636 – 0.19 USD in a double bottom.
The first significant resistance FTM had to breach to was in the region of 0.255 – 0.276 USD, which is the same as FTM’s current price.
During FTM’s impulse to the upside it achieved nearly 300% price appreciation in 74 days.
In the past 4.5 months FTM’s price corrected by more than 67%. The time ratio between impulse and correction is 1:2 which is indicative of a deep correction possibly paving the way for the next leg up.
I immediate Support & Resistance Levels:
Resistance:
0.2761. Weekly & Daily Level
Support:
0.255. Previous ChoCh level.
0.2251. 50% of the Wick and 0.786 Fib Retracement (approx.).
0.2124. Daily Wick.
0.1883. Double bottom Support.
0.1637 Double Bottom Support.
Where Do We Go from Here?
Green Scenario:
If BTC and the broader crypto market change direction in the next few days, there is no reason why FTM should be the exception. The first sign of recovery would be a break above the immediate resistance of 0.2761 USD, retest as support and a strong move up.
Orange Scenario:
Assuming that the current correction is not resolved to the upside in the short-term, I expect FTM to retrace at least to the 50% of the wick, move up towards the 0.2761 level resistance and continue up.
Red Scenario:
If the whole market goes to crap, FTM will continue to dip further. However, I don’t think it is likely to drop more than previous bear market low. But, who knows!? Everything is possible (just remember that the good is also possible).
Possible trade Ideas:
1. Support/Resistance Flip
Entry: 0.2761 USD, after retest as support
SL: 0.25 USD, below the last support level
Target: 0.55 USD
TP: 0.33, 0.39, 0.55 USD.
R: R: 1:5 assuming TP2 is achieved.
2. Wick Fill Trade
Entry: 0.2252 USD. 50% of the Wick + 0.786
SL: 0.21 USD. Below the wick.
Target: 0.39 USD
TP: 0.276, 0.33, 0.39 USD. Leave a moon bag.
NFA.
What do you think? Please share in the comments.
Best Wishes to all.

Fantom towards Moon..?👀!! 🚀FTM Today Analysis💎FTM has been tracing a downward channel for approximately a month, signaling a bearish trend. a bullish scenario could unfold if a breakout takes place.
💎If successfully breaks free from the channel, it could signify a change in market sentiment and the onset of a bullish phase.
💎High demand implies substantial buying interest in the token, which could potentially elevate its price.
💎When its price crosses above its EMA 20, it's seen as a bullish signal. This crossover suggests a potential transition from a bearish to a bullish phase.
💎In the dynamic world of crypto, staying informed and adaptable is key. Stay tuned for more updates and enjoy your trading journey!

FTMUSDTHello dear friends
The price range of $0.2929 is very attractive for Phantom, it has reacted interestingly when approaching this range in the past. Of course, it should be noted that the reaction did not create a higher ceiling.
If the downward trend line is broken upwards, provided that the loss limit zone is maintained, there is a possibility of forming an upward trend.

FTM is in Danger of Testing Much Lower Price RangesFTM chart is not looking very good in the near term.
If FTM breaks below 0.20 level, it could accelerate down to 0.04 level which is aligned with the 0.618 golden pocket.
FTM is also forming a head and shoulders pattern and if it breaks the neck line of 0.1660 the price target for that is also right below 0.04.
Fantom at a clean looking channel I don't know, some nice looking touches. Everyone thinks alts are dead, anything is possible but I'm not giving up on the altrun yet, Bitcoin has followed my plan so far, didn't think alts would go this comeback down again but we'll see if we can get going again.

FTM 1WWithout the need for explanation and fully specified in the chart, the important weekly support of the FTM floor is currently 17 cents.

FTM USDT Short TargetsFantom is in asymmetric triangle, If trigger line (Yellow Line) breaks, we can anticipate 2 targets, first target should be $0.2639 and the second target is $0.2592. The first target is the safest target. The R/R is 4, which is great. Use the Stop Loss as indicated $0.2979.
Lastly If the Yellow line did not break, DO NOT open a short position. Always use the STOP LOSS.

FTMUSDT 🤯 Hold or Break Key Level AnalysisPoint of interest right now as we are sitting at a demand zone which price is expected to react however we are coming from a downtrend structure after the bulls got exhausted this could be another correction and/or the uptrend resumes.
1. We get a false breakdown, I believe it will touch 0.30 and buy orders would get triggered.
If that happens then we would at 4h a bullish pattern we can trade and target next supply zone.
Target Upper Downward Channel area: 0.37 - 0.40
2. This level gets pierced through and in that case, we expect price to decline to the next demand zone.
Target Next Demand Zone: 0.24 - 0.20
I'll update as I see this playing out.
All the best,
Kina🤯

#FTM Daily fantomAs you can see in the chart, I think the past trend has been repeated and soon after touching the support of 26-25 , we will go up.

[UPDATE FTM] Ok, they did it again. Next is 0.27.Redistribution is happening fast. Schematic #1 was invalidated. Now we are going down fast.

Ftm Getting ready for another bullish impulse Seems Like getting Ready for another bullish impulse Forming falling Wedge In h4 tf incase Of breakout Expecting 40 to 45% bullish Wave

FANTOM - Get Ready...Fantom is currently in an ABC correction for a move higher.
We've already made the bottom so we have a strict invalidation level to work with. The upside potential is incredible (1500% gains) compared to the downside risk associated with this trade.
Trade Idea:
- For a safe entry, watch for a break of the channel
- For a risk entry, enter on break of lower timeframe trendline
- stops below the bottom
- Targets: 0.97,1.47, 3.5, HODL the rest and manually close.
Goodluck and as always, trade safe!

FTM/USDT Technical Analysis: A Bullish Outlook with Long-Term Ta#FTM/USDT Technical Analysis: A Bullish Outlook with Long-Term Targets
Chart Analysis : UPCOM:FTM forms Cup & Handle pattern on HTF, hinting at breakout and massive gains!
Long-Term Targets: #Fantom could skyrocket to $10 in next bull run, a potential 30x-40x surge!
Support/Resistance:
Support at $0.25 & $0.170
Resistance at $0.46, $0.60, $1.18, $3.31
Breakout above resistance fuels further bullish momentum
Accumulation Opportunity: Every dip is a chance to accumulate
Strong support at $1.75 makes it a sweet entry point!
Takeaw ays:
Cup & Handle pattern = bullish trend
Research before investing
Let's ride the #Fantom wave!
Follow us For More Quality Chart Anlaysis.
Thank you.

FTM longMarket is waking up and FTM, Fantom, are soon in a perfect position for a long trade. Buy the break (after confirmation).

Fantom tradeThere is a big problem for all position long on crypto,that although crypto can have a good long rally but because of after that have a bad short,almost all position before long eat stop,so don't a little stop or heavy position

Fantom is at Support Will It Hold?Fantom had an amazing run between November 22nd until February 23rd . In 73 days Fantom’s price increased by almost 300%. However, In the last four months (116 days) FTM is in a downtrend. The chart structure emerging from this correction is of a Triangle. The question is will Fantom hold support on the Triangle’s diagonal support line, or will it break to the downside?
The short answer: yes, probably. This is why:
Support Levels:
1. The diagonal support line has held Fantom’s price in January and March.
2. If we examine the RSI, we can see a Falling Wedge pattern. A Falling wedge is a bullish reversal pattern. The diagonal support of this wedge has held Fantom’s price on several occasions (blue dots).
3. Regardless of pattern, The RSI level of Fantom is close to oversold. Past experience shows that FTM rejects the oversold level.
4. Should Fantom temporarily lose the diagonal support, the 0.5 Fib retracement (pulled from the low of November to high of February) is at 0.3187 and I expect it to hold.
Admittedly, Fantom is at a stage that it lost some of the hype. Regardless, in the last bull market Fantom performed extremely well and I see no reason why it can’t do just as well in the future.
Targets:
I think FTM is good for a long-term hold. I expect FTM to exceed it’s previous ATH in the next bull market. I also think that short-term FTM provides a good R: R to risk a trade.
My short-term targets for FTM are:
1. 0.41 USD (daily resistance).
2. 0.45 USD (diagonal resistance).
3. 0.55 USD (daily resistance).
4. 0.65 USD (daily resistance).
Trade Idea:
• Entry: 0.33
• SL: 0.3185
• Targets: As mentioned above.
• R: R 1:7 for the first target
NFA
Feedback will be appreciated
Best wishes to all.

Fantom will explosion soonI think that Fantom is ready to fly to return to its top point again.
My Entries
My entry 1: 0.3235
My entry 2: 0.3185
My entry 3: 0.3092
My entry 4: 0.3057
My Targets:
Target 1: 0.03538
Target 2: 0.03865
Target 3: 0.04033
Target 4: 0.4143

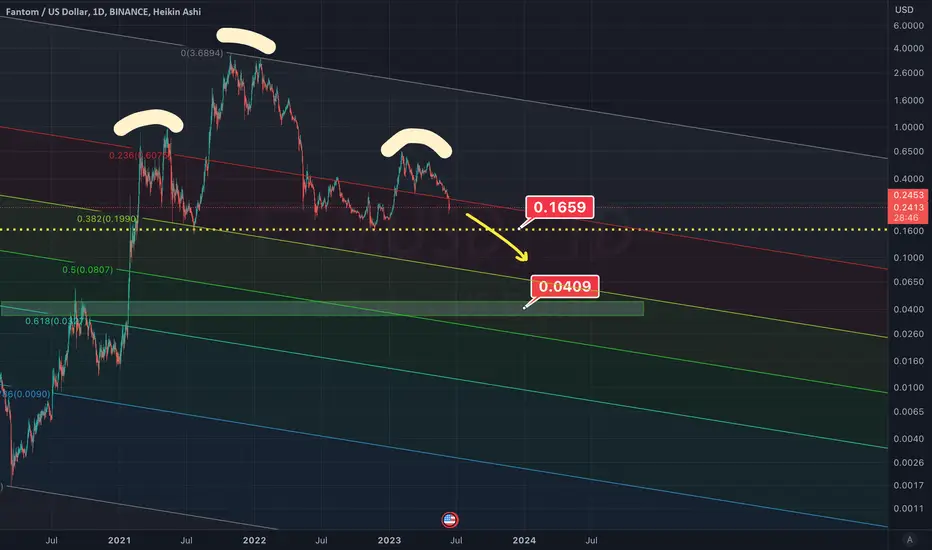
Fantom Faces Potential 60-80% Summer Price Drop Based on HistoryRepeating Patterns Signal Potential for the Cryptocurrency "Fantom" to Experience Rapid Price Drops Again: A Shorting Opportunity with Short-Term Profit Potential. This article displays the observed recurrence of significant price dumps in FTM, presenting a potential golden opportunity for shorting. Traders may consider capitalizing on the anticipated price decline to strategically buy FTM at the bottom for short-term gains. Please note that this analysis does not constitute financial advice but reflects the author's current trade strategy.
**The Foundation has been selling FTM in the past several days, adding up to the millions. This could also be an indicator.**
Legend
Horizontal Lines:
Red: Represents potential support that is highly likely to be breached.
Orange: Indicates support that is still likely to be breached, but with lower probability than red.
Yellow: Suggests a probable bottom.
Green: Suggests a buying opportunity for FTM if the price falls below the Yellow horizontal line.
Trend Lines:
White: Refers to repeated Descending Triangle patterns observed after significant price pumps. If these patterns break downward, historical data suggests a potential freefall, resulting in a potential downside ranging from 60% to 80%.
Yellow channel: The Yellow channel, established in 2021, may offer support for FTM in the near future, potentially leading to a return to the channel.
Yellow Trend line: Beginning in 2020, this trend line could potentially act as support for FTM if the trend continues to unfold.

FANTOM- 😻 Time to Enter? (probably yes!)Charts don't lie and FTM chart is looking great to enter.
Valid major support at 0.326 and 0.3049 with a first target at 0.3778
0.4011 is our Key target and resistance. At that level we could expect a delay (rejection) or a breakout towards 0.5172
News:
Not many and it's worrying me a bit as the community here seems to have lost momentum.
Then again there is this:
Fantom Launches Gas Monetization Feature with Incentives for Developers
Link: www.coinspeaker.com
This incentive can be a great wake to 'wake up, team up, build up!'
So, let's Go FTM
One Love,
The FXPROFESSOR 🌅

Refueling fantom?I'm not really sure about it,but I think mabe it's a refueling for fantom,,,mabe eating....I dont now but trade it with low leverage

FTMUSDT H1 : Situation for Trade Hi guys.
Share three situation for trade with you please do it with your own confirmation .(DYOR)
SecondChanceCrypto
⏰25/May/23
⛔️(DYOR)
always do your research.
If you have any questions, you can write them in the comments below, and I will answer them.
And please don't forget to support this idea with your likes and comment.
