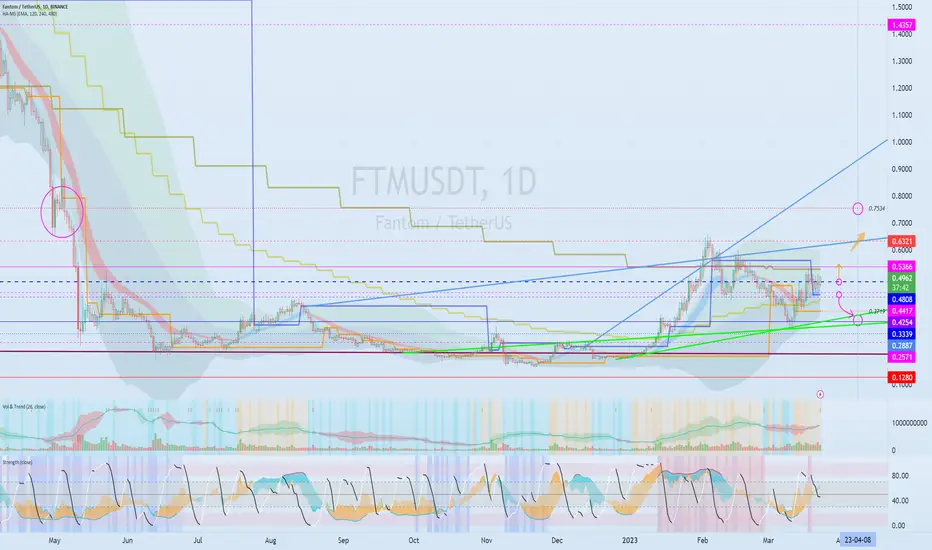
FTMUSDT - Buy Setup!FTMUSDT (1D Chart) Technical analysis
FTMUSDT (1D Chart) Currently trading at $0.492
Buy level: Above $0.485
Stop loss: Below $0.37
TP1: $0.58
TP2: $0.66
TP3: $0.85
TP4: $1
Max Leverage 2x/Spot Market
Always keep Stop loss
Follow Our Tradingview Account for More Technical Analysis Updates, | Like, Share and Comment Your thoughts
Fantom

✴️ Fantom Has So Much More To Give (260% This Wave)Here is another one that looks pretty good.
We looked at FETUSDT and we see the exact same pattern, the exact same chart but this one is lagging a bit behind, which is good because it means that it will go up next.
What one does, the rest follows.
Here FTMUSDT (Fantom) is set to grow now that the correction is over, notice the Doji last week.
All the signals are 100% bullish.
✔️ The current candle trades above EMA100.
✔️ The MACD is bullish with plenty of room available for additional growth.
✔️ The RSI is really strong.
We can see 260% happen on this current wave but there can be more of course, long-term.
This is all only the beginning.
The Cryptocurrency market will grow for years to come. Higher highs and higher lows.
Namaste.

FTM/USDT🐇FTM
🪄 2 Scenarios for FTM Midterm Long
- If Break 0.55 First
- or Around 0.25
+ TP Around 0.9
#Fantom #FTM #FTMusdt #FTMUSD #eth #btc #bitcoin #ethereum #cryptocurrency #blockchain #crypto #coinbase #bitcoins #trading #money #investing #forex #cryptocurrencies #altcoins #bitcoinnews #investor #altcoin #hodl #binance
FTM - Breakout this weekend? 💎👻FTM we have patiently been awaiting a breakout. No complaints as it has grown in the past days but still stuck under this resistance at 0.47
Usually, round number are to be feared (0.50) but in this case what i see is an aggressive rise once and if over 0.4748
Target will be 0.90$ which is nicely far away.. I will keep this trade, it's promising and chances of it happening are increasing.
News:
Fantom (FTM) Attracts New Demand as Investor Confidence Grows but Will It Break Above $0.50?
Fantom (FTM) price has rebounded 36% since recording a local low of $0.33 on March 11. On-chain data shows that FTM has been attracting new demand. Is there a chance for this altcoin to break above $0.50 in the coming weeks?
New participants and investors are joining the Fantom Network, while long-term holders are taking bullish positions.
Fantom Long-Term Holders Are Growing Confident
Fantom is an alternative DeFi smart contract platform that aims to solve the blockchain trilemma using its unique directed acyclic graph (DAG) consensus algorithm. Its native coin, FTM, has made a 30% tear in the last two weeks after dropping below $0.35 in mid-March.
Looks good to me.
One Love,
The FXPROFESSOR

At the beginning of a flight, but wait, we haven't refueled yetGet ready to fly, but don't rush, don't refuel yet. We have a resistance zone ahead. After 6%, if the resistance is broken, we will have a good entry
Follow us and ask us questions, we will be happy

FTM Forming Inverse Head and Shouldersyou can buy FTM once we see 4h close above 0.471
targets 0.53 - 0.65

ftm/usdt buy trigger???in 4h time frame trend has middle white dynamic s&r as support and adx line as support i guess its good trigger for buy!! what do u think????

FTM/USDTpersonal opinion:
Undoubtedly, one of the best shopping opportunities has been achieved in Fantom. There is no need to explain more because everything is clear in the picture.
The goals and extent of the damage have been specified.
ps: DYOR

🔥 FTM Massive Inverse Head & Shoulders: Big Move ComingEver since FTM topped early February, we've largely been trading bearish. However, with FTM finding support around the $0.40, it seems that this token is printing an inverse head & shoulders pattern, which is classically a bullish reversal pattern.
High-risk traders might want to enter the trade already and look for further upside. I will wait for the confirmation & break out of the H&S pattern. Wait for a break of the neck-line.
Near-term targets in blue.

FTM (D) longFantom is in buy-zone on daily time frame. This is a potential 70% trade. You probably can use the 200 MA as a back up support level where it's likely that FTM bounce if it's fall further down. If the altcoins start running this could be a great play. The BTC-dominance is falling right now. I even see this FTM price level (0.38-0.4) as a potential DCA zone for long term hold.

FTM SHORT trade IDEA Hello, due to a lack of volume in the market I haven't been posting as many updates in coins although we are still looking for opportunities everyday.
Analysis: In our previous LONG trade, we long from 0.35 to 0.53 netting a 51.93% profit. Our target was the #3 possible breakout on the white resistance line. However, we have been struggling to break past the resistance and are looking likely for a due correction to 0.38-0.41 level (green box).
Target: 0.39-0.41
Stop loss: 0.47 (break above )
Timeframe: 1D

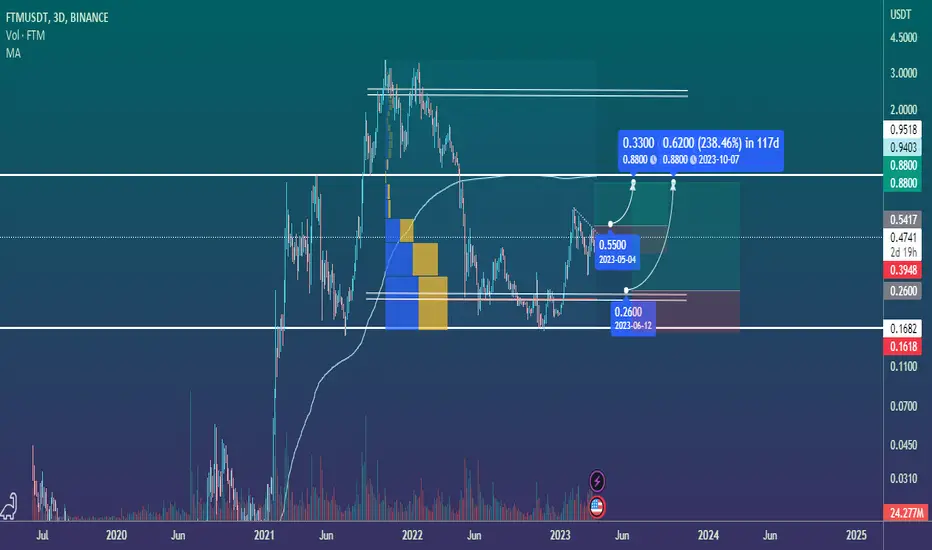
Significance of the interval 0.5366-0.6321...Hello?
Traders, welcome.
If you "Follow", you can always get new information quickly.
Please also click "Boost".
Have a good day.
-------------------------------------
(FTMBTC 1W chart)
The key is whether it can rise with support around 0.0000 1686 ~ 0.0000 2029.
--------------------------------------
(FTMUSDT chart)
(1W chart)
The question is whether it can hold the price above 0.4254 and rise above 0.6321.
(1D chart)
The key is whether it can rise with support around 0.5366-0.6321.
Therefore, if it rises above 0.7534, it is expected to show a sharp uptrend.
To do so, we need to see if the price can be maintained around 0.4808.
A drop from 0.4808 is likely to touch around 0.3339-0.3719.
-------------------------------------------------- -------------------------------------------
** All descriptions are for reference only and do not guarantee profit or loss in investment.
** Even if you know other people's know-how, it takes a considerable period of time to make it your own.
** This is a chart created with my know-how.
---------------------------------
FANTOM- New Flight Inbound 💎👻Nice breakout for FANTOM yet it looks so 'Young and promising'.
0.4454 is now Triple support and that allows for a comfortable SL below that level (risk) and a much higher reward:
0.90 is the next target and it could be soon (2 months?)
1.32 - 2.05 - 2.56 are reasonable targets that we could see between end of 2023-mid 2024
4$ remains my target for FTM. Same as it was last year (was never met during last cycle).
NEWS:
💎 Fantom reveals 30 years runway (without having to sell its token)
The Fantom Foundation’s attempt to dispel concerns about potential FTX exposure has been a success thus far for FTM price.
💎 Fantom releases decentralized funding system called ecosystem vault :
QUICK TAKE
Fantom has released a decentralized funding system to finance new projects, dubbed the “ecosystem vault.”
The vault will get 10% of all transaction fees paid on the network, which will be granted to projects.
To apply for funding, projects will have to make a governance proposal and get approved via an on-chain vote.
FANTOM is awesome and I believe it can stand out.
One Love,
The FXPROFESSOR
WE CAN REPEAT BX12 AND MORE HERE:

[UPDATE FTM] Why do they keep manipulating in the same way? Stay safe and ready. Long + Short at the right moment = Heaven? Let's ee

ftm can make a correctionHi, dear traders. how are you ? Today we have a viewpoint to SELL/SHORT the FTM symbol.
For risk management, please don't forget stop loss and capital management
When we reach the first target, save some profit and then change the stop to entry
Comment if you have any questions
Thank You

🔥FANTOM IS PREPARING TO BLOW UP. $1 IS THE HIGHER TARGET FOR IT🔥Hi, friends! Fantom is the most volatile altcoin for this time. It can blow up more than the other altcoins. That's why you should pay attention to it. Here is my plan for FTM.
📊 TRADING PLAN FOR FTM:
🔥 squeeze to the trendline
🔥 big purchases on DOM and Footprint by the whales give us confidence about this long trade. The whales are right in almost all cases.
🔥 bullish BTC
🚩 The pullback to $0.4-0.41 value area is still possible, so control your risk management. It will be a lot of good long trades will be in the next 2 months.
✅ THE MAIN TARGETS FOR FTM:
1. $0.6 - the key level
2. $0.65 - the key level and local highs
3. $1 - the key level and local level
💻Friends, press the "boost"🚀 button, write comments, and share with your friends - it will be the best THANK YOU.
P.S. Personally, I open an entry if the price shows it according to my strategy.
Always do your analysis before making a trade.

$FTMUSDT: Bullish weekly trend now...Great upside vs risk here in #Fantom. As long as above the consolidation area it will sky rocket within 6 weeks or less.
Best of luck!
Cheers,
Ivan Labrie.

Food for thoughts 18-03 FTM/BTCFTM is looking real juicy here! The USDT pair shows promis with the forming of a ascending triangle, but has to overcome the 57cent resistance
My guess, we will see some real fire! My entry was at 1700 sat. Will take profit at 2650, just below the resistance.

🟢 FTM Falling WedgeFTM Falling Wedge - 25% scalp possible from here and 0.50 target if wedge consolidation breaks out to the upside.

ftm Breaking Another Bullish Pattern Seems Like getting ready for massive Bullish impulse
Breaking Bullish Flag In h12 Tf Incase Of successful Breakout Expecting 50 to 60% Bullish Move

FTM IS VERY BEARISHHi, dear traders. how are you ? Today we have a viewpoint to SELL/SHORT the FTM symbol.
For risk management, please don't forget stop loss and capital management
When we reach the first target, save some profit and then change the stop to entry
Comment if you have any questions
Thank You

FTM prepares for another bullish rallyFTM / USDT
We said before BTC is outperforming everything now (2019 vibe)
But here in Fantom there is something strange it looks so strong these days unlike the rest
Price restored the horizontal support + EMA 200
Also forming a giant bullish flag
Simply As long as we hold above the support we are bullish
Best of wishes

