FTM about to give you 10X profits than Other coins? Yes, FTM has potential progress in the slight bull run of BTC. Though BTC tries to break 24300 USD and if it breaks the 24300 zone surely it will hit 28000 USD within a week. Mark my word.
In the meantime, FTM made us 2.5X profits from 0.18 USDT to 0.49 USDT almost. MOST OF THE COINS NEVER GIVE THAT KIND OF PROFIT IN A SHORT TIME.
So, FTM is the BEST EVER.
If FTM manages to break 0.52 USDT, we will see it in 0.63 USDT, then every break makes it more positive. I even expected to reach at least $2 within August 2023
So fill your bag with FTM at every step.
Thank you
Fantom

FANTOM Bullish Flag!KUCOIN:FTMUSDT
FTMUSDT is sitting now in a bullish flag. Re-entry in the Possible Pullback zone for next leg up.
Break and retest of buildup will make FTM run for about 28% as next target.
If you're more matured you could enter a short when structure breaks to the Possible Pullback zone.
If you liked this idea or if you have your own opinion about it, write in the comments.
The information and publications are not meant to be, and do not constitute, financial, investment, trading, or other types of advice or recommendations.

Fantom FTM price is able to grow to $0.70-0.80, but when?FTM buyers are quite aggressive, and they are currently buying back any price corrections.
We wrote more about Fantom in our previous idea
In today's idea, we have slightly adjusted the dynamic channels and reduced the working timeframe to daily for easier tracking of the idea's development.
It seems that buyers of FTMUSDT can organize another impulsive growth to the range of $0.70-0.80 in the near future . To do this, they need to gain a fixing FTM price above $0.45 and manage to break the stops of shorts above $0.50.
If sellers manage to defend the range of $0.45-0.50, then a fairly deep price correction may begin, to the region of $0.26 as we see in the white scenario.
And after the correction, growth will continue to the liquidity zone of $0.68-0.80.
Which scenario do you think is more realistic now and why?
_____________________
Did you like our analysis? Leave a comment, like, and follow to get more

$FTMUSDT UPDATE! BUY AND HOLD!!!!!!Hi Snipers,
Please refer to the recording for the next price levels and scenarios.
Thanks
MS

FTM Bearish ScenarioTo see such a bearish scenario, we should expect bitcoin to go down to at least 19K. and that might lead to a drop in all altcoins.
but make sure that you don't open short positions with high volume or high leverage. its a high risk/high reward trade.

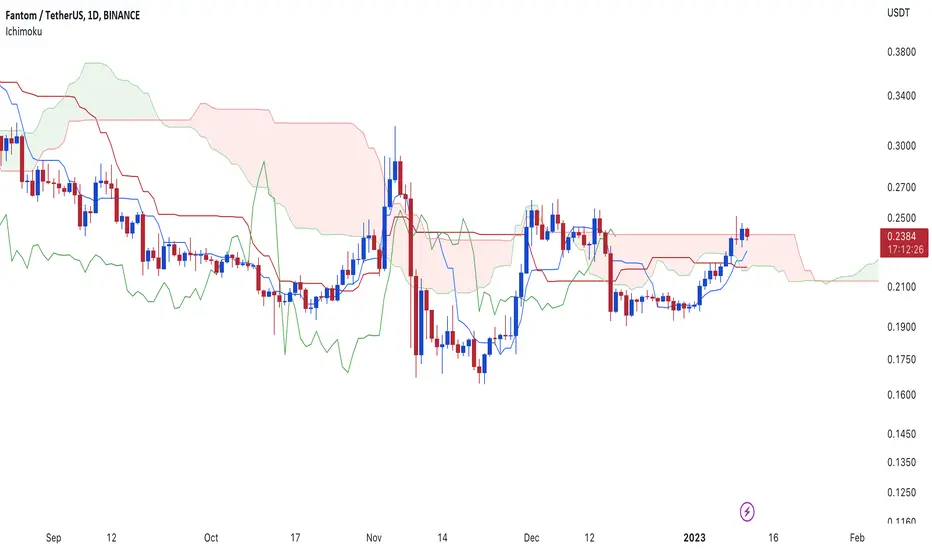
Ichimoku Analysis for FTMFantom could see a 30% run from here as price is closing above the cloud and all the indicators are positive.
FTMUSDTIf the bullish scenario in the crypto market strengthens,
Fantom's movement will be fast.
Therefore, they have more risky in the long run.
Here, keep an eye on the fundamentals so you don't fall into the big bullish trap.
Manage your funds

FTM/USDTIt has risen beautifully from the bottom of its three-year ascending channel, but it has engaged with resistance at the ceiling of its medium-term descending channel. It is noteworthy that near this resistance range, there is also a static support range, which can be encouraging.
By observing the stop loss, the specified goal can be achieved.

💁♂️ FTMUSDT /1D💹 HI TRADERS✌
As you can see, In a daily time frame The price has grown about 80% from the support area of 0.19.
Currently, the price is gathering volume in the resistance range. Due to a price growth, the price needs a return for the next move and the possibility of a pullback to the dynamic resistance.💹
If the daily close candle closes below the 0.31 range. The possibility of further correction can be considered.❗
Otherwise, if the price stabilizes above the range of 0.3580, we may see growth up to the supply area.❗
❎ (DYOR)...⚠⚜
WHAT DO YOU THINK ABOUT THIS ANALYSIS? I will be glad to know your idea 🙂✌
IF you like my analysis please LIKE and comment 🙏✌

FTM 30MIN CHART POSITION !!!Here is a suggested financial setup on Fantom.
Please manage your risk and pay attention to the entry, sl and tp.

FTM SHORT SETUPHi, dear traders. how are you ? Today we have a viewpoint to SHORT/SELL the FTM symbol.
For risk management, please don't forget stop loss and capital management
When we reach the first target, save some profit and then change the stop to entry
Comment if you have any questions
Thank You

Fantom Weekend UpdateBreakout of the ascending channel with a bearish divergence created, the possible retest of the 55 EMA (0.31) the volume does not show a strong breakout, another pump is possible before falling.

Ftmusdt Formed & Breaking Falling Wedge In daily Timeframe Incase Of Breakout Expecting Massive Bulish Move In coming Days
(Note) Entry Will Be Only Valid After Confirmed Breakout
And According Falling Wedge Pattern Safe Stoploss Is Recent Low Its Just An Idea Do Your Own Research Before taking Any action

Fantom levels for this weekeendHigh possibility of touching 0.31 and even a hit to the GP at 0.32, but being at the 0.5 fib level can also initiate a significant retracement.
Strong Resistance 0.31
Fib Levels + Golden Pockets
Volume Level: VAH/POC/VAL
Chartd TF: 1D

Fantom levels for this weekResistance absorption zone at 0.2475, VAL 0.26 with liquidity at 0.25, support zone and key level at 0.2360 and a strong daily at 0.2280 with an interesting POC for purchases of 0.2050.
Right now at 4H is bearish with an EMA (Bearish) crossover at 1H.

Probability of breaking the resistance of the channel ceilingIf the favorable conditions in the market continue, the probability of breaking the resistance of the channel ceiling and moving towards the next target in the range of $0.30 will increase. The second resistance is a range that can be broken in the daily timeframe to change the trend. Therefore, in this week, the way the price hits the ceiling of the channel and the type of its reaction can determine the continuation of the trend. In the 4-hour timeframe, we can consider a narrow ascending channel. If the bottom of the channel breaks, there is a possibility of price reduction and the formation of a range trend.

FTM long - Fantom looking strongFTM are looking strong and now teasing a weakly break. I think it could be a good time to find a FTM-trade on lower time frame that could turn out to be a be a long time hold if the market turn "bullish". This trading idea have 1.0 risk reward ratio. Disclaimer - Fantom is one of my favourite coins all things considered...so I really try to find a good entry for a long time hold.

FTM CAN DROP AGAINHello, dear traders. how are you ? Today we have a setup to SELL/SHORT the FTM symbol.
I think a falling triangle is being completed and we are now in the E wave of this triangle
For risk management, please don't forget stop loss and capital management
When we reach the first target, save some profit and then change the stop to entry
Comment if you have any questions
Thank You

Fantom FTM will dump by 70%Merry Christmas, dear friends!
I wish you be healthy, happy and wealthy! Thanks for huge support you gave me. You are my motivation to make a quality articles.
You asked me to share my opinion about Fantom. It’s fundamentally strong asset which I am going to add to my portfolio, but not today. It will fall by 70% and I am going to explain you why.
FTMUSDT is printing the ending bearish wave 5, like the rest crypto assets. Let’s take a look in details on internal structure of this wave. I consider that wave 1 and 2 have been already finished and now asset is in wave 3. The target for the wave 3 is $0.08 , but the first stop is about to happen at $0.11 because the sub wave 3 target for FTM is located there. These targets have been defined using 1.61 Fibonacci extension levels.
The area between $0.11 and $0.08 suits for placing buy limit order using grid. It is not going to be the end of the bear market, but the potential bounce can be caught. At the same time, the global bottom I expect at $0.05 , but this target is approximate, we should see the wave 4 to define the exact target.
Best regards, Ivan
________________________________________________________________________________________________
If you like my trade ideas, please smash the boost button to stimulate me make more quality analytics!

BUY OPPORTUNITY ON FANTOM !!!The market is still bearish. So should not do risky one (position). But sometimes we see some special signals in opposite way from the main trend, like this one (on Fantom).
Stay tuned for more updates & signals...

0.0093 Fantom.You can make money about 90% in short position.
Blue line is major support for FTM . Please consider SL in blue line zone . I think price will go down from BLUELINE!!!

FTM/USDT Elliott Wave count 12H TFFantom into a falling wedge pattern what I think it is a 5th wave ending diagonal, translated into Elliott wave theory.
Probably we ended the wave A from an ABC 5th wave of a 5th wave bigger degree and now we may enter into wave B from this ABC pattern(red count).
A trade plan here is to sell into 0.5 - 0.618 fib retracement (0.235 - 0.226 zone) of the wave A where also we have a strong resistance, the red pointed slope trend line.
Targets for this 5th wave is 0.150 - 0.145 zone where we have previous low from July 2021. We may take into consideration a truncation here as 0.618 fib extension 3rd vs 4th it perfectly aligns with the previous November 22 bottom.
Bigger picture remains bearish on FTM.
Any breakup of the wedge pattern will invalidated the count!!
If you want me to analyze other coins that interest you, please write in the comments, I will gladly do it within the available time.
Good luck!

🔥🚀FTM: OPEN A TRADE AFTER THE PULLBACK🔥 Hi friends! Fantom is a most volatile and strong altcoin. It makes a huge pump at time when the other alts just consolidate.
Now we see the local dump with BTC, so we should wait for the pullback or continuation of dump. I make the idea that help you to open a trade at any case.
📊 SHORT TRADING PLAN FOR FTM:
🔥 pullback and the false breakout of the local key level
🔥 test the value area as the resistance
🔥 volume growth
🚩 Volume growth is the key thing. As you can see, the huge massive growth in volumes was almost at the very bottom. Now we see that volumes are also starting to grow significantly.
✅ TARGETS FOR FTM:
1. $0.21 - the key level and local low
2. $0.2 - the key level and even number
3. $0.18-0.183 - the value area
Take a look on the $0.21 key level, because here we could see the reverse of the trend so book at least 50% of profit from short trade.
Traders, what your thought about FANTOM? Is it promissing altcoin and can bring us good profit? Write your opinion in comments!
💻Friends, press the "boost"🚀 button, write comments and share with your friends - it will be the best THANK YOU.
P.S. Personally, I open an entry if the price shows it according to my strategy.
Always do your analysis before making a trade.
