The point to turn to the medium-term uptrend is...Hello?
Traders, welcome.
If you "Follow", you can always get new information quickly.
Please also click "Boost".
Have a good day.
-------------------------------------
(FTMBTC 1W chart)
It is in a position to radiate the power of ascension.
------------------------------------
(FTMUSDT 1W chart)
The key question is whether it can rise above 0.3339.
To do so, it is necessary to confirm that it can rise with support in the 0.2280-0.2571 range.
(1D chart)
The key is whether it can rise above 0.2571 and receive support.
If not, a decline below 0.2280 is likely.
A break below the downtrend line is expected to lead to an attempt to rise above 0.2887.
At around 0.2887, the M-Signal line on the 1W chart is passing, so a move to a medium-term uptrend is needed to keep the price near 0.2887.
-------------------------------------------------- -------------------------------------------
** All descriptions are for reference only and do not guarantee profit or loss in investment.
** If you share this chart, you can use the indicators normally.
** The MRHAB-T indicator includes indicators that indicate points of support and resistance.
** HA SRRC indicators are displayed as StochRSI (line), RSI (columns), and CCI (bgcolor).
** The CCI indicator is displayed in the overbought section (CCI > +100) and oversold section (CCI < -100).
(Short-term Stop Loss can be said to be a point where profit or loss can be preserved or additional entry can be made by split trading. This is a short-term investment perspective.)
---------------------------------
Fantom

FTMForming Falling Wedge In Daily Tf
rsi Printed Bulish Divergance
incase Of Breakout Expecting Massive Bulish Rally
Expecting Minimum 3 to 4x

FANTOM - FTM flexing - Andre's ProphecyFANTOM - FTM flexing - Andre's Prophecy
Update DEC 2022 ;
Andre posted some pumpy financial stats. FTM immediately initiated an off the bottom pump structure.
His stats etc are indeed very bullish for FTM's future (basically have massive cash dev runway/managed/ponzid their way to a very strong position going forward). That means DEFI round 2 will prob see FTM rocket up the ranks faster on the next bubble.
Long term accumulation imo.
May have one leg down; if BTC does the 10k thing then make no mistake FTM will PLUMMET; even if it has a big future. because; its a shitcoin and it went up so much already. like RUNE.
We seem to always be at a pivot, but here is another one here. if the price action produces another strong roll over, exit all markets and watch out below; if we keep grinding up like this its going to quick moon and buckle up.
Catch the ratio with higher risk FTM small cap plays; SPIRIT - BOO - LQDR etc

$FTM - doomed in Lower TimeFrameHello my Fellow TraderZ,
In my previous analysis about $FTM on Daily, I made a cautious statement regarding its PULLBACK to test the EMA55 on Daily at the least.
If you see here on lower TF, price has broken the support TL. So, I am expecting a slight above move to retest the broken TL(looking at S.RSI) and continue the down path.
BUT If the price reclaims the TL then this down move would be a FAKEOUT & price could once again tend to retest the Major above TL(Daily).
Be patient, anyside $FTM will move rapidly.
Happy Trading. CHEERS!!!

FTMUSDT Short Setup!FTMUSDT technical analysis update
Short level: $0.230 - $0. 235
Stop loss : $0.241
TP 1 : $0.225
TP 2 : $0.216
TP 3 : $0.205
Always keep stop loss

FTM touched the first target!FTM touched the first target!
FTM had good price growth during the last week. After buyers supported it in the $0.17-$0.18 range, Fantom's rally pushed the price closer to the ceiling of the descending channel. A resistance was considered in the range of 0.260 to 0.258 dollars, and the first contact to this range was associated with a negative reaction. But there is an important resistance in Terri in the $0.300 range, which can be a profit-saving place for some short-term buyers.
Given Fantom's impressive rally against many altcoins in the event of a correction, the target range for reactive support is $0.190-$0.20, which is yet to see a pullback to this level. In the 4-hour time frame, a range zone is observed below the $0.260 range. If the resistance is broken, the price growth can continue as long as the width of the channel range until the price hits the ceiling of the channel. So as mentioned, resistors are prone to negative reactions and should be monitored carefully.

$FTM - Just a matter of TimeHello my Fellow TraderZ,
#FANTOM $FTM - consolidating near the TL. Well I wish this one to break upward for some handsome profit.
But if you see on DTF, S.RSI is on overbought territory, which could bring price further down towards $0.2050-.2175.
Well I am just sitting and waiting for either the pullback or break the TL.
CHEERS!!!

FANTOM Cup & Handle Bullish Build UpKUCOIN:FTMUSDT
FTM is still looking strong for a Long and this is an update to previous idea.
Not broken yet but printed build up for more reliable breakout.
On breakout SL under breaking candle.
Entering the breakout before the breakout? ... stop loss under build up
Possible upside targets 0.2733, 0.2910, 0.3128.
* Learn to buy support - see the lower horizontal rays to understand how to build edge.
If you liked this idea or if you have your own opinion about it, write in the comments.
The information and publications are not meant to be, and do not constitute, financial, investment, trading, or other types of advice or recommendations.

FTM 4H BUYFTM 4H support is at ~$0.21
Enter 50% at the current price
and try to set some BUY orders near the support zone
If FTM stays above the trendline,
the Take-Profit target would be 5%, 10%, and 15% from your entry
Cheers

FANTOM Bullish Pennant!KUCOIN:FTMUSDT
FTM has had a strong run and possibly breaking out of Bullish Pennant for upside to 0.2733, 0.2910, 0.3128.
Learn to buy support - see the lower horizontal rays to understand how to build edge.
If you liked this idea or if you have your own opinion about it, write in the comments.
The information and publications are not meant to be, and do not constitute, financial, investment, trading, or other types of advice or recommendations.

$FTMUSDT UPDATE!!!Hi Snipers,
Please refer to the recording for the next price levels and scenarios.
Thanks
MS

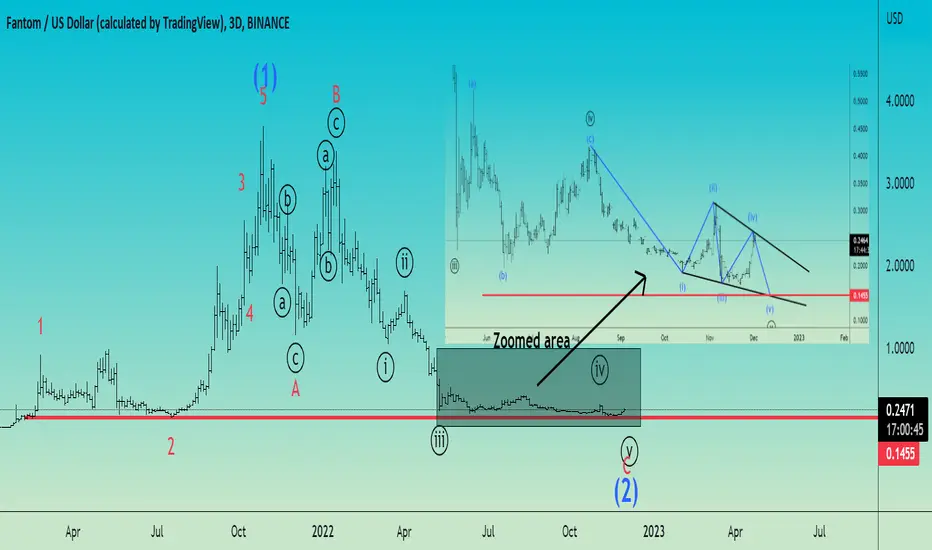
FTM/USDT Elliott Wave count 3D TFFantom may drop soon to end a 5th subwave from a 5th wave of a C wave from an extended flat correction that probably is wave 2.
What I expect next is a downward movement of the price to the 0.1455 zone marked by fib projection 3 vs 4 that you see in the zoomed picture of the last price action moments to complete this 5th wave from an ending diagonal .
I think that soon we will have the end of wave 2 and the Fantom will start the formation of wave 3 from a higher degree.
At this time I expect this wave 3 to start from 0.1455 zone where probably we will have the bottom of the correction.
I will stay short untill this ending diagonal is completed!
I have also a scenario with wave 4th a triangle but I will put it as a comment so as not to clutter the view but the overall things are bearish .
If you like my analysis please hit the like button and subscribe for future elliott wave counts!
Good luck!
The next resistance levels!FTM has recorded very good growth in the last 24 hours. Its price, which was above the resistance level of $0.20 with increasing demand, continued to move upward yesterday and today. The next resistance levels that we can consider for FTM are in the range of $0.26 and $0.29-0.31. . Fantom is still bearish on the daily time frame, and the resistances it targets could come with a reaction. But in the 4-hour time frame, the trend is upward, and the pullback towards the supports can bring signs of support again for the short term.

Fantom Has More To Give | 70% Potential Short-TermJust two days ago we looked at Fantom vs Tether (FTMUSDT) and would like an update as the chart looks really strong.
Previous trade idea | 28-Nov. Fantom Early Recovery | 100% Easy Potential Mapped
Fantom is already moving but this is only the beginning, more is on the way.
Today we have the 3D chart with an incredibly strong bullish bias.
First, we have the last 3 candles closing green, that's 9 days total where FTMUSDT has been bullish.
We have a strong RSI and prices already trading above EMA10 and EMA21.
The immediate resistance is set at 0.2575.
The main target is set at 0.4078 for a total of 70%, short-term, that is within a month...
We should start seeing things speed up for the cryptocurrency market as a whole.
Namaste.

FTM Pumps Higher! What Levels Are Next? FTM has been quite the outperformer today pumping more than 15% and leading the charts on Coinmarketcap! Let's take a deep dive into some technical analysis and where my current targets lie:
1. Looking at the 12h chart for Fantom, we can see the Whales buy-sell indicator flashed a buy and combined with our RSI that was also over the signal line, that gave us our entry at 0.18. Since then, it's pumped over 33% :)
2. The next big resistance level for FTM is 0.245. This coincides with our previous resistance on Oct 31st. I'm watching this level closely and starting to take profits as we are very over-extended. I would look towards the 0.21 level if you're thinking of entering. That was key support on Oct 28th and was previous resistance turned support on Nov 11th. If it falls through that, then 0.19 is your next bet as it was previous resistance turned support on Nov 16th.
3. I believe FTM still has room to run this year as Andre (founder of Fantom) has been publishing various articles confirming it's longevity and continued progression in the space.
If you enjoyed my TA, please give this article a boost to help spread to the masses! And if you have any questions about my TA or indicators used, leave a comment please or send me a PM :)
Thanks for reading!

FTMUSDT Bullish short-term + break-out target.*** ***
For this particular analysis on the Fantom token we are using the FTMUSDT symbol on the OKX exchange .
*** ***
The idea is on the 1D time-frame where FTM has been trading within a Falling Wedge pattern since the May 23 2022 Lower High. Today it broke above the 1D MA50 (blue trend-line) for the first time since November 08 and that alone calls for a bullish extension towards the top (Lower Highs trend-line) of the Falling Wedge.
That would mean hitting the 1D MA200 (orange trend-line), which has been intact since March 03 2022. That would fall nicely on the 0.618 Fibonacci retracement level, which both previous Lower Highs either approached or marginally broke. A break above the 0.786 Fib (above the Falling Wedge) will be a bullish break-out signal for us, targeting the 0.4200 Resistance (August 13 High).
-------------------------------------------------------------------------------
** Please LIKE 👍, SUBSCRIBE ✅, SHARE 🙌 and COMMENT ✍ if you enjoy this idea! Also share your ideas and charts in the comments section below! This is best way to keep it relevant, support me, keep the content here free and allow the idea to reach as many people as possible. **
-------------------------------------------------------------------------------
You may also TELL ME 🙋♀️🙋♂️ in the comments section which symbol you want me to analyze next and on which time-frame. The one with the most posts will be published tomorrow! 👏🎁
-------------------------------------------------------------------------------
💸💸💸💸💸💸
👇 👇 👇 👇 👇 👇

Fantom (FTM) - November 29Hello?
Traders, welcome.
If you "Follow", you can always get new information quickly.
Please also click "Boost".
Have a good day.
-------------------------------------
(FTMBTC 1W chart)
It must rise above 0.0000 1374 to gain the strength of the rise.
--------------------------------------
(FTMUSDT 1W chart)
The key question is whether the price can sustain the move above 0.3339.
(1D chart)
The key is whether the price can sustain above 0.2280 to break out of the downtrend line.
If not, you should check for support around 0.1799.
-------------------------------------------------- -------------------------------------------
** All descriptions are for reference only and do not guarantee profit or loss in investment.
** If this chart is shared, you can use the indicators normally.
** The MRHAB-T indicator includes indicators that indicate points of support and resistance.
** HA SRRC indicators are displayed as StochRSI (line), RSI (columns), and CCI (bgcolor).
** The CCI indicator is displayed in the overbought section (CCI > +100) and oversold section (CCI < -100).
(Short-term Stop Loss can be said to be a point where profit or loss can be preserved or additional entry can be made by split trading. This is a short-term investment perspective.)
---------------------------------

Fantom vs Bitcoin Moves Above EMA50 (85% Target Mapped)The Bitcoin pair for Fantom (FTMBTC) is producing a bullish breakout now just as the Tether pair but it looks better.
We can see a volume breakout today, above-average/high volume, as prices move above EMA10, EMA21 and EMA50.
We also have higher lows since June 2022.
These signals are enough to support the bulls.
Based on these signals we can say that Fantom is baised to grow.
The targets are mapped on the chart.
85% is doable in the short-term.
As usual, mid- and long-term there can be so much more.
Namaste.

Fantom Early Recovery | 100 Easy Potential MappedThe inverse H&S or 3 drops pattern that I just mentioned on the Bitcoin chart has shown here on FTMUSDT.
After the 6-9 Nov. Drop, we have two more drops and then we see Fantom starting to recover.
The last drop happened earlier today and we already see this pair moving above EMA10 and EMA21.
The 100% mapped on this chart is just the easy target, there is room long-term for so much more.
Enjoy.
Namaste.

FANTOM technical analysisPrice is currently ranging in an ascending channel respecting the support line. I am waiting for price to break below this support to liquidate it and move down towards the 5h demand around $0.17 where we would be then looking to long from.

Fantom prediction 1,000 days from nowThe Pitchfork indicator tool suggests on the logarithmic chart that if Fantom follows through with its historical data, this is the bottom and we could see gains anywhere from 18000% to 180000% within the next 1,000 days cycle.

Fantom (FTM) formed bullish Shark for upto 11% pumpHi dear friends, hope you are well and welcome to the new trade setup of the Fantom ( FTM ) coin with BTC pair.
Previously I shared a long-term trade setup of FTM , which is still in play as below:
This time on a 4-hr time frame, FTM has formed a bullish Shark pattern. At the moment, after the completion of final leg the priceline has slightly moved up, therefore, we can wait for some correction to buy it from the buying zone.
Note: Above idea is for educational purpose only. It is advised to diversify and strictly follow the stop loss, and don't get stuck with trade

FTM Breaking Support and Looks to Be Heading to Half a CentFTM is Breaking Bearishly below Weekly Support and is also Breaking through the confirmation line of a 3 Falling Peaks Pattern and the next logical level for it to retrace to will be the 61.8% Retrace at 3.2 Cents and the 88.6% Rretrace at Forty-Two Hundredths of a Cent.
I don't really have an entry on this one i just wanted to document the price action of this chart.
