FTMUSDT - SETUPFTMUSDT price getting resistance from EMA 21 trading into a Symmetrical Triangle and holding the Higher Low. So we are expecting that if bulls get sentimental support from the market Fantom can print a good upside rally. Keep following the price action.
Fantom

FTM - Daily Daily chart for FTM
support zones & resistance zones
Information purposes only
Like if u like chart
@Cringeego

FTM/USDT BUYING SETUP$FTM Look's like make a bullish pennant. big volume on support , close with bullish enqulfing on support line. Potensial breakout
Buy zone : 0.365 - 0.34
Target : 0.3817 - 0.3994 - 0.4348 - 0.4747 - 0.5233
Stop : 0.32

$FTM$FTM or Fantom was on a down trend for a long time
Now its near a big support level
I've catched it before on 1.03 and sold at 1.64
now im buying at
0.34 20%
0.29 20%
0.23 60%

Fantom areas of interest above 0.65 centsFantom is down a huge -81% from the sell signal all the way back in February at just under $2. Above 0.65 cents and maybe we start to see some signs of recovery but right now anything below that level is just downtrend continuation. Stay away until things start to look a bit better.

FANTOM - Step By Step We Rise AgainFANTOM has risen a good 21% today and given that the number was almost 30% a few candles earlier this could be time for it to rise again.
Nasdaq is rising nicely on support, Crypto is recovering and weekend is coming. We expect the rise to continue 🦉💹
We are Long on Fantom and our expectations remain high. The market has taken a beating but the Great projects will prevail and FANTOM is in this category.
Our Bitcoin chart:
One Love,
the FXPROFESSOR

FANTOM ESSENTIAL STEPS FOR HOLDING ...!Given the Fibonacci and Price Action correction levels, I have identified two very important areas of support for you. In the current situation, you can enter some of these ranges.

Come On Fantom 💎(deserves much Higher)FANTOM, oh Fantom...
NEVER GIVE UP - NEVER SURRENDER - Let's go higher.
Love Hurts and so does crypto but come on now: FANTOM below 30 cents looks like bargain to me.
PLEASE - Higher...Now
One Love,
the FXPROFESSOR

FTM Entering Accumulation ZoneFTM entering accumulation zone. Time to start stacking up!
Key takeaways:
1. Respectable descending channel - looking to create a final LL
2. Major key support from last summer
3. Based on historic records, altcoins have a tendency to reach maximum drawdowns from ATH's at 90-97% thresholds. We have entered that territory.

We been SMASHED but can we Come Back? (YES!!!)FANTOM has come back to base, following the overall market performance (troubles).
Technically speaking the price is on support and a good 9% rebound is in place.
The 60 cents resistance is mild, the 50 cents support is much stronger.
time to Buy again? Who know.. we will be honest with you: things are scary but Fantom has a great project that we like to beleive in..so yes, time to BuY!
One Love,
the FXPROFESSOR

Bullish divergence in daily RSI FTMUSDT $FTM with ichimokuWe have a nice bullish divergence on RSI daily and 4h.
We have to break FLAT SSB + TENKAN 4H ORANGE to go to TENKAN BLUE (0.70$)

Levels to maintain in Daily FTMUSDT $FTM - analysis ichimokuHere you can see the price to maintain.
--> We've just made a rebound on flat SSA daily.
By the way, we make a falling wedge with RSI weekly. It's often bullish than bearish!
In weekly chart, we get out of this falling wedge probably next week but not in daily chart as you can see.
We see also a bullish divergence in 4H and in daily chart !
I hope that the 30k$ for BTCUSD will be huge support.
have a good day Fantom Family

FTM - Levels to watch.Fantom is still rekt, down over 60% from the sell signal and down 77% from its highs back in October 2021, there is still a lot of room for this to fall. The way the chart is now I wouldn't really start paying attention until around $0.95 cents. I would neither buy or sell here, just add an alert and stick it in your watch list. If following the DCA signal the average position here would be around $1.65 with between 5% and 10% allocation. Risk here is currently very low so there could be a chance to move that average down a bit further but personally I would wait for further confirmation of a trend change.

FANTOM- Time to Buy The Dip FANTOM Could be next to Pump.
Apart from the market's overall correction in April, Fantom ended up having extra reasons to suffer; named Cronje.
At this stage we see 99cents being the critical resistance which at least should be checked...and most likely breached over.
Let's see how the market does today and take it step by step but remember this: FANTOM deserves to shine again and it will.. sooner than later.
One Love,
the FXPROFESSOR

GOLD Can Bullish?Gold in the daily timeframe has reached the support range of its trend line and I have identified possible scenarios in the chart. If it loses $ 1850 support, we will have more drop to the specified limits. And if the resistance price increases, we will have $ 1900 and $ 1995.
Its not Buy or Sell SIGNAL
DYOR
BY : Mohamad Teriz - @AtonicShark

FTMUSD DailyHi Guys, very important days for markets because of FED , I update charts for you to get better decision.
👤SecondChanceCrypto
📅04.May .22
⚠️(DYOR)
Thanks for your Likes and Comments

My predictions to Fantom's RSIBecause Fantom hit oversold in the RSI indicator, it is probable that it goes up towards the resistance line, then bounces back and consolidates, breaking through the resistance line. This means Fantom will revert and turn bullish.
DISCLAIMER: This is a theory and can’t be approved till further notice
BINANCE:FTMUSDT

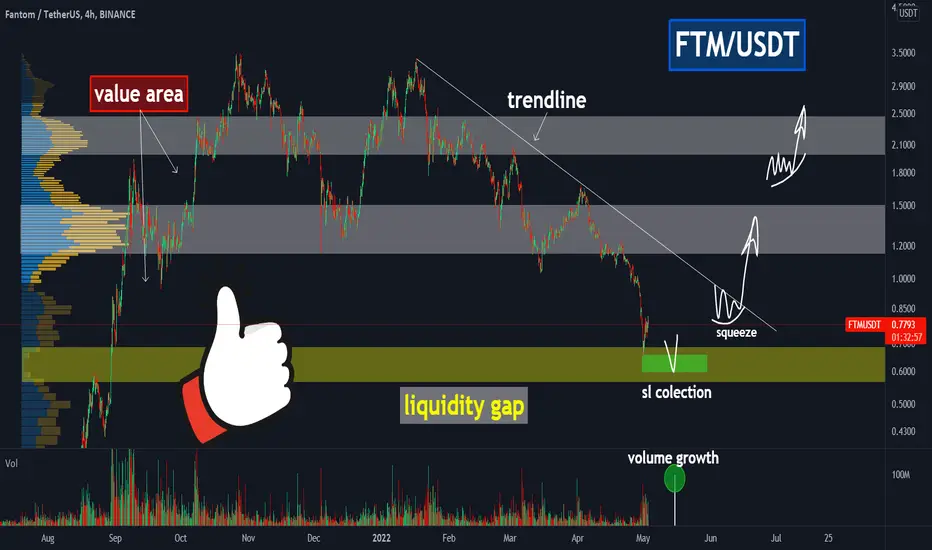
📈FTM: when to open a trade? Is sl collection still possible?📈Fantom(FTM), we have to wait for the RIGHT setup or pattern to open a trade to earn +10%, 20%, 100%, and not mindlessly open trades and lose -2%, -5%, -10%. That's what I'll talk about in this idea.
🚩The key zones on the chart are:
🔶$0.564-0.686 - liquidity gap
⬜$1.15-1.50 - huge value zone
⬜$1.98 -2.45 - value zone
The price touched the liquidity gap , and since there are no buyers or sellers there , the price quickly bounced off that area. To open a long it is necessary to wait for the collection of stop-losses, the whales manipulation, of course, with the growth of volumes on the indicator. That' s why local collection of traders' stop-losses below the level of $0.66 is still possible. After that it is possible to open long trades❗
📍The trendline. When the price touches the global trend line, it is necessary to pay attention to the squeeze. The squeeze shows the willingness of traders to buy and a possible break up soon. You can see manipulation and local stop loss collections sometimes, but the squeeze is one of the most successful and simple strategy I use .
🎯Targets. The first target will be the value zone of $1.15-1.50. If Bitcoin and the entire crypto market will be in uptrend, the price have the chance to reach the second value zone of $1.98 -2.45.
Every crypto (BTC or alts) is unique. Fantom, for example, grows very fast, pumping by 10-20%, so don't miss the entry point😉
🎥You have to wait for the right set-up on the chart, not to trade everything you see. Check out my yesterday video review on Bitcoin, it's relevant to all cryptocurrencies!

FantomFantom technical analysis basically on elliott waves Principles and Priceaction Strategy
fantom can be 5$
Wait and watch.

⭕️BUY crypto FANTOM ; Now is the best time to Buy ❗️🧐🔰You see the analysis of the crypto FANTOM in four hours ( FTMUSDT , 4H) ❗️🔎
🔰BUY FTMUSDT at 1.0300
✅TP ; 2.0600 (+10300 pips)
❌SL ; 0.9180 (-1120 pips)
📊R/R ; 0.1 (This number is derived from the division of Risk to Reward and must always be less than one, and the less it is, the better🧐)
🔰BUY FTMUSDT at 1.0300
✅TP ; 3.1000 (+20700 pips)
❌SL ; 0.9180 (-1120 pips)
📊R/R ; 0.05 (This number is derived from the division of Risk to Reward and must always be less than one, and the less it is, the better🧐) 🔥🔥
🔰Due to the price in the demand area and the fatigue that is evident in the price movement, if the price breaks the white downtrend line. Buying in this area seems low risk. The first target is located in the nearest supply area and the second target is located in the main supply area, which was previously the highest price for this crypto.💰👌
⚠️⚠️🔥Take a look at Phantom Analysis step by step on YouTube🔥⚠️⚠️
⚠️⚠️Please observe capital management and open a low volume transaction❗️❗️
I hope this analysis is useful for you🙏🏻🌹
📌Please introduce the "TRADER STREET" to your friends 🙏🏻
_______________________📈TRADER STREET📉________________________

FTM ANALYSISOn daily timeframe chart is forming a "descending parallel channel"
If the candle closes below the major support zone of $0.74 then price will reach the weekly support zone of $0.5.
Wait for breakout of the resistance trendline of the parallel channel or touch to weekly support zone to build a position.

FTM/USDT ChartHi, I try to post often so if you could follow and like it would mean a lot to me.*
FTM has been droping for a while and it can drop even more. However with the low volume that is going on any trade is welcome. FTM is undervalued in the 1D chart and in the 4H chart so I am preety confident that in the short/mid term the coin will perform well. I don't think that FTM will run again so this is just based a lower time frame trade. MACD is also looking strong. I expect higher volume in the next hours so don't miss on this long oportunity. Be careful and don't trade with high leverage. Comment what you think.
* Its been a while since my last post and I apologise for that. I have been really busy in the past weeks and my next 2 months will be exactly the same. I didn't spend enough time to research for ideas that I think that are worth posting and with low volume trading became even harder. I will try to stream every friday but I can't promise anything. I am truly sorry and when I can I will make a huge comeback for sure
