FANTOM Daily TA : 01.04.22 : $FTM🟡 Results so far (HH) : +104% 🔥
Well, according to the previous analysis, as you can see, the price hit the 4th target so far and it has brought us more than 104% Profit . Amazing , Isn't it ??
Follow our other analysis & Feel free to ask any questions you have, we are here to help.
⚠️ This Analysis will be updated ...
👤 Arman Shaban : @ArmanShabanTrading
📅 04.Jan.22
⚠️(DYOR)
❤️ If you apperciate my work , Please like and comment , It Keeps me motivated to do better ❤️
Fantom

ATOMUSDT (Cosmos) : Time to take profitWell, according to the previous analysis, as you can see, the price hit the all its targets so far and it has brought us more than 90% Profit . Amazing , Isn't it ??
☑️ TP1 Reached 🔥
☑️ TP2 Reached 🔥🔥
☑️ TP3 Reached 🔥🔥🔥
☑️ TP4 Reached 🔥🔥🔥🔥
✅ All Targets Reached ✅
✅ Results so far : +90% 😍
⚠️ Time To Take Profit for everyone . Cheers 🥂
Follow our other analysis & Feel free to ask any questions you have, we are here to help.
⚠️ This Analysis will be updated ...
👤 Arman Shaban : @ArmanShabanTrading
📅 04.Jan.22
⚠️(DYOR)
❤️ If you apperciate my work , Please like and comment , It Keeps me motivated to do better ❤️

How to trade FTM? Hello dears as you see on the chart Fantom is moving up inside a parallel channel and it seems wave 3 is completed and i expect a correction as wave 4. Don't buy here because it's too risky also you can book profit here. At the bottom of the channel you can decide to buy or not.
Good luck

FANTOM PROTOCOLGood Project = Future Good Gains. Looks very strong right now.
DYOR it.
What Is Fantom (FTM)?
Fantom is a directed acyclic graph (DAG) smart contract platform providing decentralized finance (DeFi) services to developers using its own bespoke consensus algorithm.
Together with its in-house token FTM, Fantom aims to solve problems associated with smart-contract platforms, specifically transaction speed, which developers say they have reduced to under two seconds.
The Fantom Foundation, which oversees the Fantom product offering, was originally created in 2018, with the launch of OPERA, Fantom’s mainnet, coming in December 2019.
Who Are the Founders of Fantom?
The Fantom Foundation was founded by South Korean computer scientist Dr. Ahn Byung Ik. Currently, the platform’s CEO is Michael Kong.
The team behind Fantom has extensive experience primarily in the field of full-stack blockchain development, and aimed to create a smart contract platform which privileges scalability, decentralization and security.
According to its official website, Fantom’s team also consists of specialist engineers, scientists, researchers, designers and entrepreneurs. Employees are located throughout the world, matching the ethos of a distributed platform.
Trading Parts :
- Buy Zones ( with conditions ) :
- Buy Zone 1 : 0.85+$ ( After it breaks ATH, not before !)
- Buy Zone 2 or Rebuy : 0.5$ (if u don't want go in while rising, you can wait this retracement Zone )
Take Profits :
TP1 : 1.49$
TP2 : 1.95$
Stay safe and follow BTC king !
Happy Tr4Ding !

FANTOM - Yesterday's Resistance is now SupportFANTOM has been our favorite posts in the last 3 weeks and you can say it has been a Perfect call.
Price keeps rising and yes, we expect 4$ mark next.
Take a look at our previous posts. Close to perfection.

FTMUSDT - LONGBased on technical factors there is a long position in FTMUSDT Fantom
FTMUSDT Fantom
Score 1️⃣
🔵Long Now or set on Key Level 2.8330
🟢Target 1 3.0165
🟢Target 2 3.1630
❌Stop loss 2.7550
#K_Level
Every signal has a score from 1 to 5, so accordingly adjust your risk for each signal. The signals with the score of 5 are the most probable ones.
Please support our activity with your likes and comments.

Fantom (FTM) all time high next door - looking strongFantom (FTM) all time high next door - looking strong.
The last breakout is confirmed on RSI and OBV as well - very nice.
What do you think? 😎
Drop me a nice comment if you'd like me to analyze any other cryptocurrency.
*not financial advice
do your own research before investing

FTM Fantom bounced from supportFTM Fantom bounced from the strong support and it looks to aim higher.
But what is FTM?
Fantom is a fast, high-throughput open-source smart contract platform for digital assets and dApps.
Fantom’s aBFT consensus protocol delivers unparalleled speed, security, and reliability.
Enjoy almost instant transactions and extremely low fees.
Looking forward to read your opinion about it.

FTM / USDT - On track to ATHHello!
FTM seems unstoppable, im trading at the 4 hours chart at the moment.
The bull flag has broken out, so we set our target.
On the long term the technical perspective looks good as well.
We'll see! first things first lets reach our ath target earn some profit and look further.

BITCOIN 6H TA : 01.04.22 : $BTCThe Last Analysis is Still Valid ... Which was :
In the 6-hour time frame, we see that the price is still trading in the neutral range, but last night the monthly candle did not close in good condition , but again, if we want to be 1% optimistic, we can say that the Close of the monthly candle was higher than the Open of October candle. Also, it is better not to prejudge the market and wait for a strong breakout (either from below or from above) until the price is out of the neutral range.
Follow our other analysis & Feel free to ask any questions you have, we are here to help.
⚠️ This Analysis will be updated ...
👤 Arman Shaban : @ArmanShabanTrading
📅 01.04.2022
⚠️(DYOR)
❤️ If you apperciate my work , Please like and comment , It Keeps me motivated to do better ❤️

Fantom ($FTM) New FIBFantom ($FTM) New FIB: $FTM mini-pump is "on the horizon" Oscillators showing strong support for more BULL-ish action. If you bought during the RED DAYS, congrats! We don't chase pumps, we buy dumps. If $FTM re-traces back to the 50MA, I would be very interested in buying

FANTOM vs ETHEREUM: Today's Perfect PostsBuy the strongest, Sell the weakest.. in other words Hedge
Best case scenario? Watch both trades deliver profits!
In such a volatile and unclear crypto environment, Hedging is probably a necessity. Unless you can be a long term hodler ( Hope you didn't buy XRP at 3$ in 2017 and still holding tight. That sucks).
Ethereum dropped as expected whereas Fantom ended up 10% higher in a bearish market.
Stick around, we will try to do it again tomorrow~
Two loves (1 short 1 long),
the FXPROFESSOR

FTM LEVELS BEING METFTM making HH on 4HR & DTF.
1st target met, lets see if the BULLS can keep the momentum going to FIB 1.0 @ $3.49 as seen on the chart.
Currently consolidating under FIB 0.786 as RESISTANCE.
NFA.

Fantom FTM Usdt breakout and retest of the all time highmessage me for any questions,
here i am using ichimoku, concencio moving averages and the resistance of the ath where i believe there is space for the price to move freely into and retest the All time high here.
we may also see a break out from the all time high having looked at the weekly chart, FTM hasnt really been affected by this downturn too much in the market and still is bullish printing a no, 1,2 and now 3 bullish candle (on the weekly Tom demark sequential)
My game plan here is to see a no8 print close to the resistance of the ath, take some profit, leave the rest, use trailling stop and wait for a break of the ATH.

🔥 FTM Exceptionally Strong: $10 Long-Term Target?After several weeks of bearish price action, FTM has seemingly found itself in another bullish move. The bottom support held strong and investors are pouring in. FTM seems unstoppable.
Since we're trading in a long term bullish channel, I'm assuming that this channel will hold in the coming months. For now, my long-term target for FTM will be $10.
Happy trading!

FANTOM- Bullish No matter What!FANTOM is our favorite these days.
Same way that Cardano was our favorite from 20 cents to 3 dollars, Avax from 15% to 117$ and so many more.
No matter what Bitcoin and Ethereum will do most alts will follow. Some will correct less and others more and just a few will be able to rise.
Fantom is our best hope for a nice January. This is our personal opinion here and our main trade at this very moment.
Hope you like the updated chart.
One Love,
the FXPROFESSOR

Fantom CUP & HANDLE!!!!FTM/USDT formed nice cup & handle on Daily. It broke trigger line and PB to that.
It also broke Ichi clouds with volume and PB to the clouds.
Its has support of trendline also.
We have also support of 0.382 Fibbo Retracement level right here.
We have strong Demand area on 1h right here.
Tight SL + Decent R:R
Very nice trade.
Entry: 2.3-2.5
Targets:
1) 2.77
2) 3
3) 3.3
4) 3.6
5) 3.75
6) 4
7) 5.2
SL: Daily close below 2

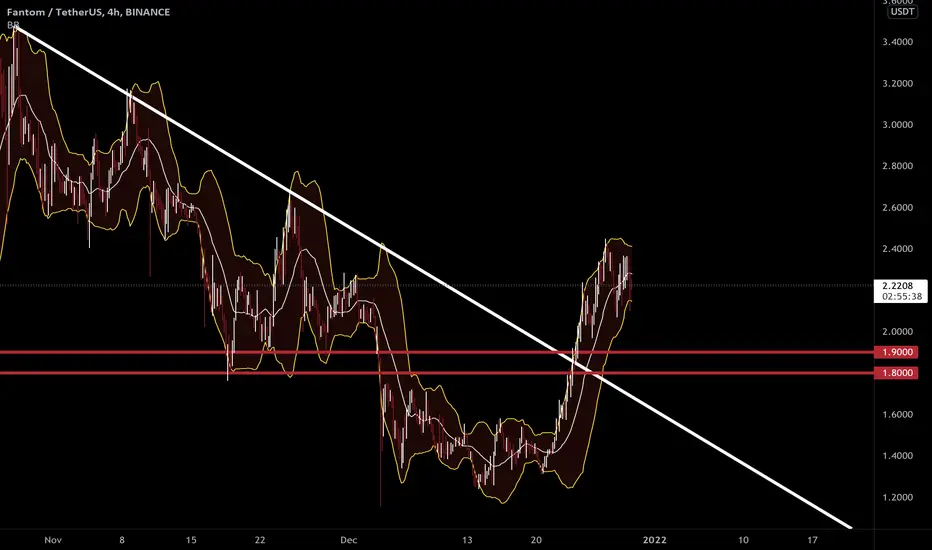
FTM - It can be prepared for a pullback to the trend lineOn a four-hour time frame, the negative trend line is broken, and now there is a weakness in the trend and a negative divergence, and it can be prepared for a pullback to the trend line. Enter for $ 1.9 and $ 1.8 targets if it re-tested.
FTM RELATIVE STRENGTHFTM is a very good Layer 1 Blockchain and I believe it is very undervalued with high TPS and low transaction fees.
Highly scalable with a great ecosystem and staking rewards. This one has huge growth potential in 2022.
Very good spot buy area on the chart.
Not Financial Advice.

FTMUSDT - LONGBased on technical factors there is a long position in FTMUSDT Fantom
FTMUSDT Fantom
Score 1️⃣
🔵Long Now or set on Key Level 2.4650
🟢Target 1 2.5850
🟢Target 2 2.6665
❌Stop loss 2.4220
#K_Level
Every signal has a score from 1 to 5, so accordingly adjust your risk for each signal. The signals with the score of 5 are the most probable ones.
Please support our activity with your likes and comments.


MY PERSONAL POSITION ON FANTOM...! I'm still waiting for a pullback on rsi bearish trendline...
Open position at your own risk (Don't forget to add sl)! -My sl is around 2.20-

$FTM Fantom 4H chart updatelevels ww still
what a beast shoutout ct fr @eliz883 @ninjascalp put me on early
trimmed way too early lmao
