Fantom

FANTOM- 1,98$ and HigherFantom is one of the few DeFi chains that has managed to amass a variety of protocols on its network . Presently Fantom has more protocols running on it than Solana, Terra and Tron combined. However, the issue is deeper than the number of protocols.
Fantom on Binance
Fantom’s listing on Binance U.S. on 17 December was a huge advancement for the network, which hasn’t been in the best place recently. Deposits on the exchange are now open and this is another addition to the ever-expanding adoption of Fantom.
In fact, just recently OKEx had added Fantom to its staking service. But even then the lack of participation continues to be a problem for the DeFi chain.
As it is, in less than two weeks the network has lost over 60% of all its active addresses. Consequently, the number of transactions on the chain dropped by 57% to 1.9k. The same at one point used to be at 4.5k.
The daily chart shows the Fantom price is consolidating above the 200-Day Moving Average (DMA) at $1.207. Notably, the Moving Average Convergence Divergence (MACD) indicator signals growing bullish momentum. Furthermore, FTM has crossed the mid-point of the Bollinger Bands at $1.500 (20-Day Moving Average) and should therefore extend towards the top of the BB channel at $1.800.
However, the 100-DMA at $1.985 and the 50-Day at $2.043 provide robust confluent resistance above the market. For that reason, FTM’s gains may be limited unless the broader market embarks on a sustained bull run into year-end. On the other hand, if BTC fails to hurdle $50k convincingly, altcoin gains may be fleeting. In that event, the 200-DMA comes back into focus.
Our chart says 1,98 and if breached then much higher.
One Love,
the FXPROFESSOR


FTM Fantom: Channel Inside A WedgeHello friends, today you can review the technical analysis idea on a 4H linear scale chart for Fantom (FTMUSD), a cryptocurrency.
The chart is self-explanatory. The Fantom price is inside a small Channel Pattern which is inside a Descending Broadening Wedge Pattern. Based on the indicators, price has the potential for upside, however the Ichimoku Cloud shows heavy resistance ahead. If Volume comes in and price breaks outside of the Cloud, it may be possible to see a nice move upside. Otherwise, price has potential to break below the local S/R line and fall much lower.
Additionally Shown: Ichimoku Clouds, RSI (Relative Strength Index), Stochastic RSI (Stoch RSI), MACD, MFI (Money Flow Index), Fear and Greed Indicator, Support and Resistance Trendline, and Volume.
If you enjoy my ideas, feel free to like it and drop in a comment. I love reading your comments below.
As the year is coming to an end and holidays are almost here. I want to wish my friends Happy Holidays and ready for an exciting 2022! What are your thoughts for the coming year?
Disclosure: This is just my opinion and not any type of financial advice. I enjoy charting and discussing technical analysis. Don't trade based on my advice. Do your own research! #cryptopickk

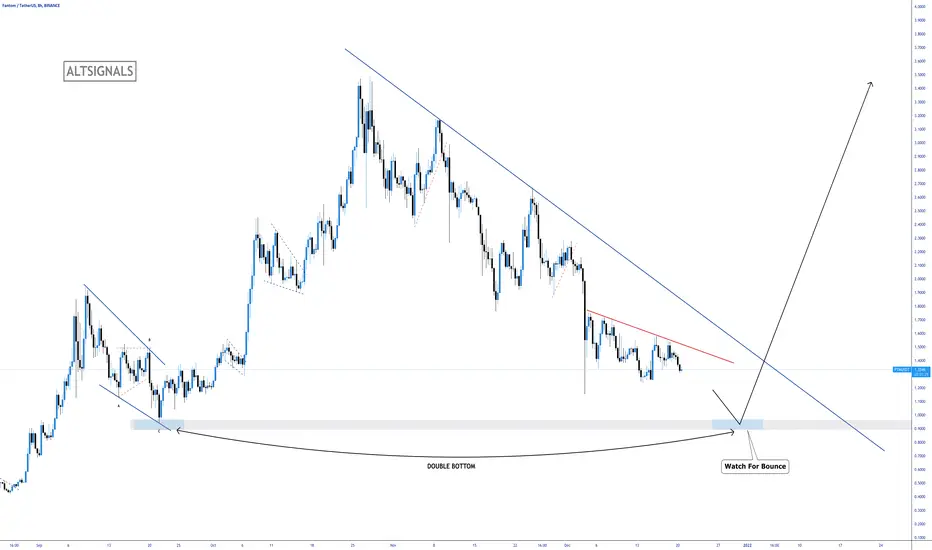
FANTOM - Watch For Breakout ⚡️Fantom is approaching a key area where we are expecting a bounce off. Expecting one more drop back down to the $1 level.
Trade Idea:
- Watch for price to go down once more to the $1 level
- Once bullish price action appears, enter with stops below that level
- Targets: 2.00 - 3.00 - 3.50 - Actively manage the rest
Goodluck!
Fantom FTMUSD Charting on the fly. Learn with me. Target $4.00! In this video:
* I chart on the fly with you all so that you can see how I do what I do
* I chart trendlines, levels, fibonacci, and bullish divergence on the 4 hr.
* We can see a longer term swing trade target of $4.00
Best of luck traders!

FTMUSDTAs I mentioned the death cross occured! Our new bottom around 1$
Previous bottom was 0.15
From 0.15 to 3.48 FTM did 23x
NFA!!!


FTMStatic support of $ 0.9 to $ 1 is very important and I do not think we will miss it
But if we are going to reach the bottom of the canal for a long time ...
The head-to-shoulder pattern is created in which the right shoulder is probably at a point with the descending trend line
.
.
If you have any questions, you can write it in comments below, and I will answer them
And please don't forget to support this idea with your like and follow, thank you...

Possibility to buy FTM on dip and make 28%Uncertainty in market. The time on FMT hit the nearly the rock bottom at Fibonacci's 23.6% will exactly match with the time of FDS making an announcement on further actions. It will either be a good time to buy FTM or a time for FTM to drift past its big resistance level and reach the lowest price since September.

FTMUSDT updateFantom
As I mentioned only after breakout major resistance price is bullish again! All depends on BTC
Btc depends on;
1) Evergrande payment which is last day tomorrow 13th December
2) US senate meeting:Hearings to examine stablecoins, focusing on how they work, how they are used, and their risks.14th December
3) FOMC Press Conference 15th December
Reminder:) We are not in bear market because BTC persentage on exchange - Decreasing! As long as this percentage decreasing we are in bull market!

FTM Price prediction. Megaphone Pattern. VERY Conservative price prediction of $4.32. in the next month.

Fantom ($FTM) New FIBFantom ($FTM) New FIB: $FTM doing a good job staying above the 200MA as the RSI avoids trading under the lower limit. MACD could see some improvements. Death Cross is on the horizon

FTM to $5 by March 2022FTM is doing a nice pull back to my buy zone of $.95 to $1.05. I will consider adding more there to my existing position for the long term hold.

FTMUSDT (Fantom) : 10.DEC.2021 (HODL)Examining the #FTM , we see that the price has reached a strong support range and is one of the lowest risk cryptocurrencies on the market for investment. I suggest you have a personal review on it for buying and invest and if you already have it, I suggest you to keep it (HODL) .
FTM Price Live Data
The live Fantom price today is $1.50 USD with a 24-hour trading volume of $366,331,518 USD. We update our FTM to USD price in real-time. Fantom is down 1.70% in the last 24 hours. The current CoinMarketCap ranking is #42, with a live market cap of $3,815,478,891 USD. It has a circulating supply of 2,545,006,273 FTM coins and a max. supply of 3,175,000,000 FTM coins.
Follow our other analysis & Feel free to ask any questions you have, we are here to help.
⚠️ This Analysis will be updated ...
👤 Arman Shaban : @ArmanShabanTrading
📅 10.DEC.2021
⚠️(DYOR)
❤️ If you apperciate my work , Please like and comment , It Keeps me motivated to do better ❤️

FANTOM - Still Have HIGH Expectations HereFANTOM has been struggling (like most cryptos) and still beloww the 1,98 resistance.
We still have high expectations from FANTOM and a breakout is most likely going to happen when Bitcoin manages to rise.
The past few weeks have been nothing less than a roller coaster ride for Fantom . Since October, every uptrend has more or less been followed by a downtrend and vice versa.
However, this time around, things have been a little different. December has been quite merciless to most of the coins. FTM, in effect, wasn’t spared either. In fact, at press time, this alt was seen trading at a value that was half of its $3.41 high.
London Bridge is falling down?
With respect to fundamentals, things seemed to be quite disappointing for Fantom. Consider this – the aggregate value of assets locked up on Fantom’s protocol witnessed a steep 4-fold incline in October. Post that, in November, the value managed to create a new high, slightly above the previously pre-set level only to dunk in December.
The protocol witnessed over $800 million erode away from its ecosystem since the beginning of this month. Well, loss of liquidity isn’t really a healthy sign on any given day.
One Love,
the FXPROFESSOR

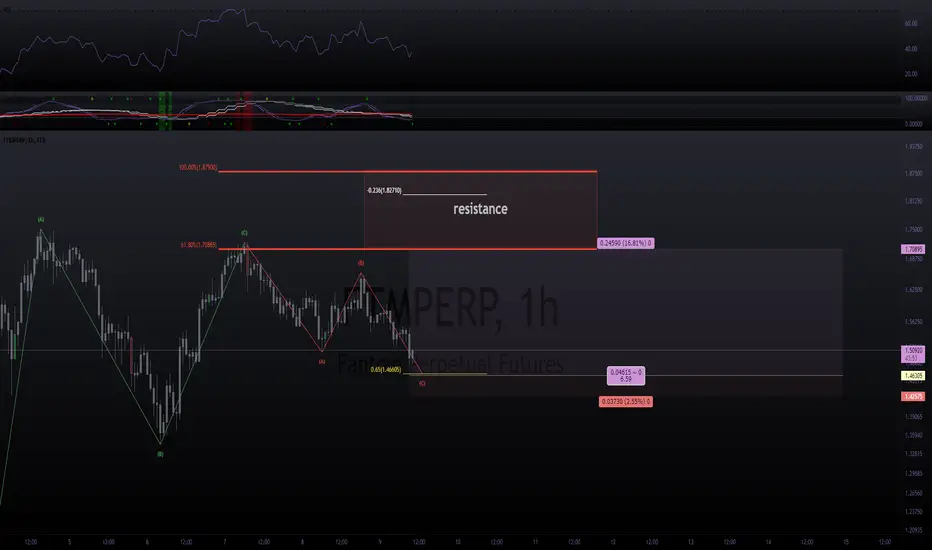
ftm swing ~our indicator is picking up a nice buy signal right here in this lower region ~
ftm looks solid for a swing from this local golden zone --> to the 0.618% extension.
it can certainly go higher, but i'm out at the first sign of weakness.
if you take this one with me, keep an eye out for my exit, or just move your stops up as it goes.
----
buy - 1.466
target - 1.70
Fantom Analysis [November 9, 2021]The picture explains it all.
AB = CD pattern is saying take profit around $4.0 zone.
FIB is saying take profit around $4.1 zone.
Feel free to comment.
Kindly note this is not a financial advice. As we know, the cryptoverse is a highly volatile world. Do your due diligence.


$BAND/BTC 3D (Binance Spot) Big falling wedge near breakout Band Protocol is starting to show some reversal signs, next impulse should be enough to regain 50MA support!
Current Price= 0.0001362
Buy Entry= 0.0001368 - 0.0001164
Take Profit= 0.0002209 | 0.0003189 | 0.0004976
Stop Loss= 0.0000889
Risk/Reward= 1:2.5 | 1:5.1 | 1:9.84
Expected Profit= +74.49% | +151.90% | +293.05%
Possible Loss= -29.78%
Fib. Retracement= 0.236 | 0.382 | 0.559
Margin Leverage= 1x
Estimated Gain-time= 8 months
Website: bandprotocol.com

FANTOM $5-10 EOY After the current drop in the cryptomarket, there are a number of altcoins that have corrected sharply and I still consider to be very undervalued. Fantom is one of them.
In the short term, a new all time high is certainly achievable with targets between $5 and $10. In the longer term for Q1 2022, I certainly expect Fantom to have even more in store ($10-30) if the cryptomarket remains in its bullish momentum.

Fantom $FTM path to $16This isn't an exact science, but if BTC chops sideways for a few months, we could see altcoins reset.
If BTC decides to start moving up past $100k, I would expect altcoins to rise.
I hope Fantom resolve network issues and also announce some new innovation in that time.
