Fantom 600% Potential in Long TermElliott Wave Pattern:
The chart shows a complete Elliott Wave pattern with the sequence 1-2-3-4-5 followed by an ABC correction. Currently, FTM is in the initial phase of the third wave of the new cycle, which signals the potential for significant upside ahead.
Fibonacci Retracement Level:
FTM has tested the 0.382 Fibonacci retracement level several times as strong support. This provides an indication that the price is likely to respect this technical level, which is usually a positive sign for potential further upside.
Moving Average:
The 21-week Exponential Moving Average (EMA) shows an uptrend. When price is above this EMA, it usually indicates bullish momentum.
Price Target:
The price target projection using Fibonacci extensions suggests that the price could reach around $5.55 in the anticipated wave 3 phase. This provides interesting upside potential from the current level of around $0.82.
Sentiment and Fundamental Analysis:
Based on the latest analysis and predictions, the Fantom project has growth potential supported by the adoption of new technologies and collaborations in the DeFi and dApps ecosystem.
Fantom

Fantom: Ready or not?FTM fell back to the upper edge of our magenta Target Zone ($0.7680 – $0.5047) last week and ran sideways above this level. Primarily, we continue to grant the coin the opportunity for a deeper dive into our range in order to reject the low of the magenta wave . Only then should it turn around and rise above the resistance at $1.22. Should this level be exceeded earlier (37% likely), however, we will have to place the price in this uptrend now.

Fantom (FTM): Bullish Setup with Strong Support Levels!Looking at Fantom on the daily timeframe, we see a promising setup following the completion of Waves 3 and 4. Wave 4 ended around $0.567, and since then, we have observed a consistent formation of higher lows. This pattern suggests a continuation of the upward trend.
The recent rise has left behind a breakout gap. Our plan is to see this gap touched or closed, and subsequently, we aim to use the underlying demand zone for Dollar-Cost Averaging (DCA) if further pullbacks occur. Within this area, we have two significant supports: the Point of Control (POC) and the High-Volume Node Edge. These levels should provide enough support to prevent the price from falling below this range.
Our target is set at a minimum of $1.22, though it could go higher, considering this is likely Wave 5. This target aligns with the expected continuation of the bullish trend as indicated by the Elliott Wave theory.
It is relatively easy to see that there are many liquidation levels above the current price for FTM. Significant liquidations have already been taken out, particularly just shortly after the ETF approval when many overleveraged positions were liquidated. Currently, there aren't many liquidation levels below the current price.
Therefore, we believe this might be a good time to dip again to clear out any remaining liquidation levels. After that, we expect to absorb the remaining short positions and push upwards. There is significant room to move higher, reaching our first target and potentially taking out more liquidations along the way.
Focusing on Fantom (FTM) on the quarterly VWAP chart, the 2024 Q1 VWAP has acted as a significant resistance level, respected four times. This consistent resistance often becomes a powerful support once broken, marking the start of a bullish phase. We anticipate the 2024 Q1 VWAP will transition from resistance to support, signaling strength and potential upward momentum. Additionally, the 2024 Q2 VWAP is providing strong support, reinforcing our bullish outlook and underpinning the price action.
With the combined support from the 2024 Q2 VWAP and the potential flip of the 2024 Q1 VWAP, Fantom is poised to gain momentum. We expect this to drive the price upward, leading to a retest of the 2024 Q1 VWAP soon. In summary, the interaction between these VWAP levels is pivotal. The 2024 Q1 VWAP is likely to become new support, bolstered by the 2024 Q2 VWAP. This setup suggests Fantom could move higher in the near future, retesting and possibly surpassing previous resistance levels.
We also need to consider the monthly VWAP chart for Fantom (FTM). Resistance was encountered between $0.915 and $0.925, defined by the Previous Monthly VAH and the March VWAP.
Currently, the May VWAP is holding, along with the Previous Monthly VWAP. However, we might fall below this level, where the Previous Monthly VAHL and May VAL should provide support. This alignment offers solid support and aligns with market structure and Elliott Wave principles.
Maintaining these levels is crucial for sustaining the bullish outlook and allowing the market to stabilize before moving higher. Holding the May VWAP and the Previous Monthly VWAP shows Fantom's resilience, potentially facilitating upward movement. If a dip occurs, support at the Previous Monthly VAL and May VAL should stabilize the price and provide a foundation for the next bullish phase.

Analysis for FTM (Fantom USDT) for Next MonthHistorical Performance: Fantom USDT (FTM) has shown significant growth over the past three months, with a steady increase in its market value. This positive momentum could indicate potential for further growth in the future.Resistance Levels: The coin has faced resistance at various price levels, with the most significant being around the $0.80 to $0.85 range. These levels may act as psychological price barriers, but they could also be potential breakout points if the price action surpasses them.Support Levels: FTM has found support at price levels between $0.60 and $0.65. These levels have been strong, with the price bouncing back up after touching them, which suggests strong buying interest and potential for future growth.Technical Indicators:Moving Averages: The coin is currently trading above its short-term and medium-term moving averages, which could indicate a bullish trend. However, it is also important to monitor its performance relative to its long-term moving average.Relative Strength Index (RSI): The RSI is near the midpoint at around 50, which suggests that the coin is neither overbought nor oversold. This could indicate potential for further price movement in either direction.Market Sentiment: The overall market sentiment for FTM has been positive, with a steady increase in trading volume and a growing number of active addresses. This suggests increasing investor interest and could be a positive indicator for future growth.Conclusion: Given the strong performance and positive momentum of FTM over the past three months, along with its current trading above key moving averages and strong support levels, there is potential for continued growth in the short term. However, it is important to monitor the coin's performance against its resistance levels and market sentiment for signs of potential reversals. Investors should also stay informed about regulatory developments and market trends that could impact the broader cryptocurrency market and, consequently, FTM's performance.

Muttski - high risk - fantom trading bot - huge potentialThis one catch my eyes...
Muttski telegram trading bot - 3 million market cap.
Fantom Sonic is about to go live soon and they will kick off with a huge meme season - 1 month competition with big prize pools.
If,
I say if,
Fantom Sonic deliver a transaction speed like Solana, I smell success for solid trading bot that seems to be supported by Fantom foundation.
This is not a financial advice - just speculating in things with high risk and high reward :)

$FTM Possible Double BottomKUCOIN:FTMUSDT - Huge Double Bottom possibly in print
Measured move +40%
Divergence at support in 0.635 levels would be preferred entry provided entry trigger activates via candlestick or candle stick formation.
Neckline break and retest at 0.78 level will provide further impetus for initial Target to 0.94.
Remember UPCOM:FTM can go higher can is dragged around like all altcoins by the ring master $BTC.
Always having Plan A and Plan B scenarios so we can react once the markets provide an opportunity to execute our edge.
If you liked this idea or if you have your own opinion about it, write in the comments.
The information and publications are not meant to be, and do not constitute, financial, investment, trading, or other types of advice or recommendations.

On the right strong support | Long BiasOn 4h TF
FTM is creating a candle long wick on the support so I think FTM can bounce back from this support, just wait confirmation
Time will tell

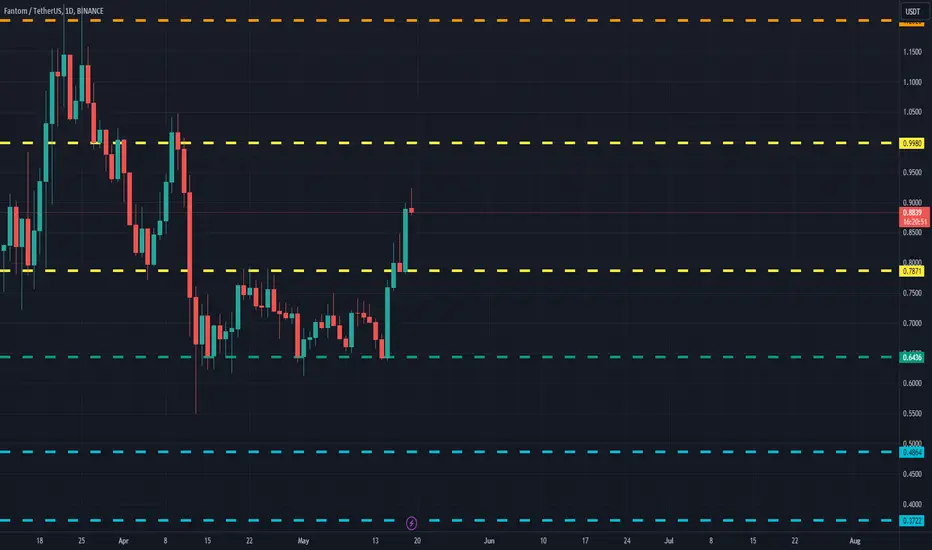
FTMUSDT(Fantom) Daily tf Range Updated till 19-05-24FTMUSDT(Fantom) Daily timeframe range. not very far away from 0.9980. way is pretty much open till 0.9980 but it needs to stay above 0.7871 for that. it got a reasonable PA all it needs some more retail interest.
🔥 FTM: Huge Reversal Possibility From Major SupportFTM has been trading in a very strong bullish trend since October of last year. This analysis is based on the idea that FTM will keep trading alongside the bottom purple support.
I'm waiting for a minor sell-off towards the entry, or when the price hits the bottom support line. Target at 2$ and the stop below the most recent local low.
The stop is very tight. If you prefer a higher probability trade (but lower RR) put the stop at 0.54

FTM: best bull candle📊Analysis by AhmadArz:
🔍Entry: 0.743
🛑Stop Loss: 0.708
🎯Take Profit: 0.771 - 0.817 - 0.914 - 1.121
🔗"Uncover new opportunities in the world of cryptocurrencies with AhmadArz.
💡Join us on TradingView and expand your investment knowledge with our five years of experience in financial markets."
🚀Please boost and💬 comment to share your thoughts with us!

FTM/USDT bullish reversal from support? 👀🚀FTM analysis💎 Paradisers, get ready for a compelling trading opportunity with #FTMUSDT, a coin that demands close attention. Currently, there is a heightened probability of a bullish reversal from the key support at $0.5620. If the price can maintain its momentum at this level, there’s a strong chance it could initiate a bullish push, aiming to breach above resistance and potentially revisit our targeted strong resistance area.
💎 Should $FANTOM fail to rebound from the $0.5620 support and instead break below it, this would likely indicate a continuation of the downward trend, with the next critical support being the bullish Order Block (OB) area around $0.4497.
💎 If #FTM reaches this Bullish OB area, it is imperative for the price to secure a bounce from this level, which is pivotal for maintaining support. A failure to rebound could exacerbate the bearish momentum, affirming negative market sentiment and possibly driving the price further down.
MyCryptoParadise
iFeel the success🌴

FTM/USDT it shows price will be back test on the support!💎 Paradisers, #FTM is indeed catching the eye as a coin worth monitoring closely.
💎 After facing rejection at the resistance area, it appears poised to revisit the support region around 0.568 in search of renewed momentum.
💎 Should FTM successfully find support and bounce from this level, it could potentially form a double bottom pattern, with the neckline acting as resistance around the 0.798 mark.
💎 To validate this pattern and shift back to a bullish trajectory, FTM must break above both the resistance and the descending trendline of the pattern. If successful, this breakout could pave the way for further upward movement, possibly leading FTM to retest our target strong resistance area.
💎 However, if FTM fails to find support at the aforementioned level and instead breaks below it, this could signify a bearish continuation, with the price likely heading towards the next significant level, the Bullish OB area around 0.449.
💎 Reclaiming the support at 0.568 would be crucial for FTM to maintain its bullish momentum. Should FTM fail to bounce even after reaching the Bullish OB area, it would signal a bullish invalidation, indicating a continuation of the bearish trend.

FTM to pull back to my buy zoneFTM is setting up a nice consolidation to continue the up trend in the long run. However, in the short term we will experience sideways to down action.
As shown in the chart, we are seeing the money flow come down, VWAP about to cross zero line and MOM (modified macd) signal crossing below. These all indicate the potential down price action in the coming weeks.
My accumulation zone is around 0.65 to 0.70 range. Not a financial advice. DYOR.

📈FTM: Unveiling Potential Trading Opportunities in the Market🔥☀️In today's analysis, we dive into the realm of Fantom (FTM), a coin exhibiting promising potential in the market. Focusing on the daily timeframe, we dissect FTM's price action and chart patterns to uncover strategic entry points for traders seeking bullish opportunities.
📈Since October last year, FTM has delivered remarkable gains, surging approximately 570% to reach the $1.1485 ceiling. Currently undergoing a corrective phase, FTM appears poised for its next significant upward movement, presenting an opportune moment for traders to capitalize on potential profits.
🔍Zooming into the daily timeframe, we observe a prevailing high wave cycle indicative of an upward trend. In alignment with trading principles, our focus remains on identifying entry points within the prevailing bullish trend. FTM's recent retracement to $0.6267, coinciding with the 0.618 Fibonacci level and forming a strong point of reversal zone (PRZ), underscores the potential for a bullish continuation.
📊 As volume gradually diminishes, both primary traders and whales remain absent from the market, contributing to increased market volatility. In such conditions, refraining from trading presents the optimal choice, ensuring prudent risk management amid erratic market behavior.
📉Observing SMA99's proximity to price action, we recognize its significance as a key entry point during upward trends, often catalyzing significant price movements. Furthermore, the trend curve exhibits a gentle slope, indicative of a parabolic ascent, albeit with associated risks of trend curve breakdowns leading to sharp market declines.
🛒For spot traders, multiple entry points exist. Firstly, identifying a strong bullish candle within the current range presents a high-risk, high-reward opportunity. Alternatively, entry upon breaching the box resistance at $0.7971 offers a more conservative approach, minimizing risk while ensuring confidence in the bullish momentum. Lastly, a breakout above $1.1485 signifies a strong confirmation of the uptrend, albeit with potentially lower profit margins.
⚠️While near-term targets include $1.6673, a crucial resistance level, and ultimately the all-time high (ATH), it's essential to employ fibo extension tools post the $1.1485 breakout to refine target levels and mitigate risks.
📝As we navigate the complexities of FTM's market dynamics, exercising caution and strategic decision-making remain paramount. Stay tuned for ongoing updates and insights as we continue to navigate the ever-evolving landscape of cryptocurrency trading.
🧠💼It's important to acknowledge the inherent risks in futures trading, with the potential for margin calls if risk management is neglected. Always adhere to strict capital management principles and utilize stop-loss orders, ensuring that the initial target offers a risk-to-reward ratio of 2

[FTMUSDT] - TIME TO BUY! the Crucial S/R level Breakout/Retest has Confirmed on the 3-day timeframe Chart.
time to buy the dip!
buy between: 0.75 . 0.70
targets: 0.80 - 1.12 - 1.85 - 3.5
stoplose: 0.56
thanks and for more signals and idea hit "like" and "follow"🎯

SPELL Token --- Potential for a Inverse head & shoulders to formDCA buying in the right shoulder area
could be prove to be fruitful
when we get out general Altcoin rally
The investment thesis is quite simple
people will see that Fantom might be trading at a $1.50 soon enough
And think damn , I missed a 10X
what can I buy in the fantom the ecosystem to catch up that 10X
So they venture further down the risk spectrum
And find spell, spookyswap, tomb etc
You get the idea don't you
It's the same with people seeing BTC trade at 80K and thinking damn I missed that train what else can I buy???

Fantom: Docked in 🚢⚓FTM has reached our magenta Target Zone ($0.76 – $0.50). Here, we expect the low of this same-colored wave (ii). Long positions could be opened here accordingly. Stops could be placed around one percent below the lower edge. With the low in place, a rise above the $1.22 mark should be on the cards.

fantom ready to flyfantom after many days corresction now ready to fly
matbe go back to entry point maybe pump from there.

FantomFtm usdt analysis
Time frame 15m
2 strategy maybe happen
First blue arrow . Break the rectangle and go to target 1.1$
Second. Yellow arrow. Play in up and down in rectangle, break it . Come back to green up trend line and go to first target 1.1$ then 1.3$

Fantom (FTM/USDT) - Bullish Long TermPay close attention to Fantom, in the short term could be bearish due to not having any daily or 4hr candles etc close above minor Resistance at: "1.02". Rejections off this level could leave the bulls behind and get pushed futher downwards from the bears to "$0.89" roughly.
Long term, if you decide to take this trade, a potential to make a +46% will be with ease. Next target is= $1.46 so keep close details on the key levels I provided on the chart to take advantage.
Line of Support= $0.89🟢
Line of Resistance= $1.02🔴
Target!= $1.46🌟
‼️DISCLAIMER PLEASE READ CAREFULLY‼️
*(THIS NOT FINANCIAL ADVICE, ALWAYS DO YOUR OWN RESEARCH! I AM NOT RESPONSIBLE FOR ANY LOSS OF EARNINGS FROM ANY INVESTMENTS THAT YOU MAY MAKE BASED OFF ANY OF MY IDEAS. ONLY INVEST WHAT YOU CAN RISK TO AFFORD TO LOSE IF YOU MAKE THE DECISION TO DO SO. DO NOT INVEST, UNLESS YOU'RE PREPARED TO LOSE MONEY, IF NOT ALL.)
(CRYPTOCURRENCY CAN BE HIGH-RISK INVESTMENTS DUE TO THE VOLATILLITY OF IT'S NATURE, AND YOU SHOULD NOT EXPECT TO BE PROTECTED IF SOMETHING GOES IN THE WRONG DIRECTION. SEEK PROFESSIONAL ADVICE FROM A CERTIFIED FINANCIAL ADVISOR.)

Fantom: Strong Bulls 🐂FTM rose sharply over the last seven days. We now consider the low of the turquoise wave 4 to have been placed in our Zone ($0.76 and $0.87). With the last leg of the turquoise-colored five-part wave, the price should now rise above the resistance at $1.22.

FTM/USDT planning for bullish move? 👀 🚀 FTM Today analysis💎 Paradisers, let’s dive into the #FTMUSDT analysis! A fascinating shift has unfolded as it breaks free from its descending channel, creating an exciting stage for a potential bullish surge.
💎 Over an extended period, #FANTOM has meticulously traced the contours of a descending channel. Presently, the price is testing a critical support level at $0.9116. Our confidence in its potential to embark on a bullish trajectory remains unwavering, challenging the overhead bearish order block (OB).
💎 However, prudent preparation is essential: should the price dip below the pivotal support zone, we may witness a pronounced bearish downturn. In such a scenario, our focus shifts to anticipating a bullish rebound from the lower support level at $0.8536.
💎 Remember to employ sound trading strategies and implement proper stop-loss measures! Stay vigilant, monitor market movements, and eagerly await further insights.
MyCryptoParadise
iFeel the success🌴

FTMUSD support and resistance Hi, welcome to my Fantom analysis
Today we have 3 level support,
Support 1 are previous higher low at fibonacci 0.382. If 0.9242 able to hold bearish movement, our target at 1.2289 with 33.75% profit projection
Support 2 also as strong support, becuase this level are fibonacci 0.618 support and also previous strong support. If this level hold bearish, our target at same level as target 1, with 69.25% profit projection
Support 3 are the last support for Fantom. If this level stop bearish movement, target at 1.2289 with 136% profit projection.
I will update more about Fantom if I get a new key level or a new pattern.
