FTMUSDT(Fantom) Daily tf Range Updated till 04-03-24FTMUSDT(Fantom) Daily timeframe range. crossed through 0.6490 clean within textbook rules. but if btc end up in volatility it may loss it. overall it needs to stay above 0.6490 to get to 0.8799. it is that simple.
Fantom

FTM FANTOM EW COUNTFTM had great run up off the lows but has been sluggish and weak since. Perhaps can be viewed as consolidating/accumulation
AM favoring 'the top' is close but also considering another leg higher might be in play after current pullback.
We will have to wait and see how the current pullback plays out and see how markets behave over next few days/weeks.
Opportunity to go long may be a favorable trade as I personally do favor another leg higher; a stop loss at previous low is ideal area to consider for managing risk.
Will update the wave counts as candles print. For now, nothing major.
Current sequence appears to be impulsive sequence of wave i-v to complete the corrective ABC as a wave ((4)).
We shall see how this plays out.
As always trade safe. If you would like to leave comments or share, please feel free.
If you found this helpful please click like to show support
Happy Trading
Cheers

DCA on FTMI just took a position on FTM, great potential. I will accumulate in the DCA zone if the correction is stronger, no worries.
Potentially a cup and handle formation taking shape, to be confirmed.

#FTM #FTMUSD #FTMUSDT #Analysis #Eddy#FTM #FTMUSD #FTMUSDT #Analysis #Eddy
(("All the relevant areas and explanations on the chart are clear and clear, the trading setups need to get confirmation to enter, if you don't know how to get a trigger and confirm entering into transactions, this analysis is not suitable for you, the above analysis is for professionals. and if you are a beginner, my suggestion is that you don't destroy your capital and first learn technical analysis and basic trading along with psychology and risk and capital management from reputable sources and courses, and then enter the financial markets."))
(("The above analysis and setups and points and areas are combined with most of the combined styles such as price action, supply and demand, RTM, ICT and also with the analysis of important indicators such as Dominance Tether and Bitcoin.
If you are familiar with the mentioned styles and know how to get approval to enter the above styles, use the above analysis.
This is not an investment proposal and only my opinion, please act based on your experience and decisions."))
~~~~~~~~~~~~~~~~~~~~~~~~~~~~~~~~~~~~~~~~~~
BTCUSDT.P Setups 1+2 :
BTCUSDT.P Setups : 3+4 :
I also suggest you to view my #Analysis of #Bitcoin from the link below :
Related Tether Market Cap USDT Dominance Analysis : (( USDT.D )) : Check Link :

FTM heating up, first really big move about to comeFTM price lagging but not the technology.
If you're not already in FTM you should consider.
The first big FTM bull run wave hasn't started yet, big opportunity before the weekly resistance break.
This idea is simple - buy on touch on the daily trendline (front run the big move) or wait for breaking the daily and weekly resistance area.
Ride FTM to close to 1 dollar (0.99 or so) or hold longer - non financial advice.

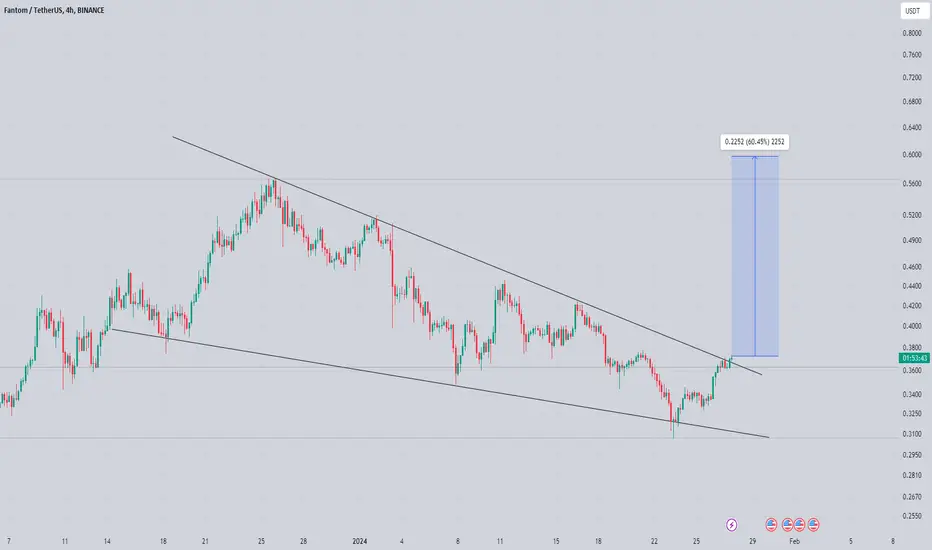
FTMUSDT,🟢Is it bullish?🟢
Well, the price reached the important demand zone that formed as a rejection block and had a bullish reaction, and then the price hit the bearish order block that broke the previous low.
Now if the price can stabilize above 0.3965, we can expect a more bullish move.
the first target can be the liquidity above 0.446 and the FVG.
💡Wait for the update!
🗓️03/02/2024
🔎 DYOR
💌It is my honor to share your comments with me💌

3DAY cup and handle forming on FTMFTM 3day chart looks bullish. Already had decent move up recently.
.55 level would be the level to break, then consolidation and then run to the upside.
The first target being 1.00 maybe little higher
Thanks for your time!
Not financial advice, just my 2cents

FTM Big Potential a head , dont miss the train FTM Big Potential a head , dont miss the train
Sleeping giant ready to fly , we are on demand zone
DCA from here to 0.6 short term and 3 $ long term
3 $ is very near than you think

FTMUSDTHi traders!
All is clear!
Fantom USDT , Entry: 0.4235
Stop: 0.3989
TP: 0.5
Duration: about 7 Days. (Until Feb 23th)

🔥 FTM Cup & Handle Pattern: Patience For Break!As BTC pushes up, FTM and many other alts are experiencing bullish moves as well.
As for FTM, it appears to be forming a huge cup and handle pattern. A risk-averse trader would want to wait for the price to break through the neckline around 0.575, a risk seeking trader can already make an entry now, accepting the fact that it's a much riskier trade.
Personally, I think that FTM will make comeback in the next few months, hence the target at 2$.


FTMUSDT IMMENSE LONG POTENTIAL !FTMUSDT broke of a long downtrend and retested support successfully.
It is now setting up an optimal entry at a demand area that could potentially lead to large gains in the mid-long term, while the RSI is testing a new uptrend line after breaking a long term downtrend line and testing support.
Invalidation of this trade would be breaking and closing below this area while RSI breaks structure.

ftm getting ready for another leg higher seems like getting ready for another 50 to 55% bullish rally
trend is up and strong currently breaking falling wedge consolidation in h4 timeframe incase of successful breakout expecting solid bullish rally towards 0.55 to 0.60$
keep eyes on ftmusdt for successful breakout
Fantom soon ready for 33% move!? - longDaily trend is broken.
But we see some resistance from 20 moving average for FTM/USD and FTM/BTC pair
If we break the 20 MA with a solid candle buy the retest and you should have a good entry for FTM.
The idea is that FTM will find some momentum after 20 MA is broken - Zoom in on lower time to reduce the risk and find that perfect entry.
I see a potential 33% trade here

fantom ⇒ get a short positionhello guys...
get a short position on 0.3794
tp1: 0.3685
tp2: 0.3280
tp3: 0.3070
______________________
always do your research.
If you have any questions, you can write them in the comments below, and I will answer them.
And please don't forget to support this idea with your likes and comment

FTM/USDT Key Support Bullish reversal?👀🚀Fantom💎 Yello Paradisers, let's zoom in on #FTMUSDT! It's caught in a fascinating moment, right at a pivotal support level, sparking whispers of an upcoming bullish leap.
💎 Taking a closer look at #FANTOM latest moves, we've seen it dipping to fresh lows, painting a somewhat gloomy picture. But don't let that dampen your spirits! There's a silver lining here: the stage is set for a bullish turnaround from the key support mark of $30.78. Holding firm at this ground could launch us into a bullish bounce, challenging any resistance that lies ahead.
💎 We, the quick-witted traders, are always on our toes, ready for whatever comes our way. If #FTM doesn't kick off the rally we're rooting for, we're eyeing a plan B at the support backup of $3.58. Should things slip below that, it might signal a deeper dive into the bear zone.

FTM Long term Analysis - Buy the Dip at and below 0.32FTM on the weekly chart is coming down to my Buy the Dip zone at 0.32.
I will be accumulating FTM for my long term portfolio at 0.32 and below. I will also open up high leverage trades between 0.31-0.32 levels based on my HLTS system signals (pink and yellow arrows on my charts).
My first target 0.56 for profit taking. 2nd one is at 0.82. My longer term price target for FTM is at $2.
This is a weekly chart so it will take some time to play out. Not a financial advise. DYOR.

Fantom: Recovery? 🩹The Fantom price has managed to slow down its decline a little. Our primary expectation is that it should recover soon and continue its rise. After all, the magenta-colored wave (3) the coin is currently working on should continue well above the $0.65 resistance level. Only the 35% probable alternative would see a different course. It considers the upward swing that the price has made since October as merely part of the substructure of the magenta-colored wave alt. (2) and would require a drop below the support at $0.16 before this move is completed.

It's not time to sell Fantom, yet... $1 soonFTM coin price will surpass the $1... More precisely as long-term savings

FTMUSDTBINANCE:FTMUSDT Long idea
2 entry point
4 targets
❌every TP can act as a resistance and dump the price
⛔"Daily crypto market analyses I provide are personal opinions & not financial advice. Trading carries risks, so do your own research & seek advisor's help. #DYOR
Don't forget to 🚀 and comment

FTM: Pullback in UptrendTrade setup : Price remains in an Uptrend. After reaching our target of $0.55 resistance, price got overbought (RSI > 75) and pulled back on some profit taking. Pullback near $0.40-$0.45 support zone could be a swing trade entry in Uptrend with +25% upside potential back to $0.55. Stop Loss (SL) at $0.35 (prior swing low).
Trend : Neutral on Short-Term basis and Uptrend on Medium- and Long-Term basis.
Momentum is Mixed as MACD Line is below MACD Signal Line (Bearish) but RSI ~ 50 (Neutral). MACD Histogram bars are rising, which suggests that momentum could be nearing another upswing.
Support and Resistance : Nearest Support Zone is $0.41 (previous resistance), then $0.33. The nearest Resistance Zone is $0.55, then $0.65.

Fantom replicates the macro formMethod : Fractal Geometry Research
White Line : Fantom
Purple Line : Geometry fractal predictions
Observing historical data from the smallest particle frame to larger time frames using fractal and Fibonacci, methods are very suitable for investors, spot traders, long-term or swing trades.
!However, it's not suitable for scalping, short-term, or future traders!
" Previous history has been a repeated failure; the more I delve into this method, the closer I get to patterns that resemble the actual future. The more it fails, the more patterns/options I find that approach success in analysis. Because this method is an ancient one, rarely utilized, and challenging to comprehend, references are scarce."
Note: that personal observation does not constitute financial advice. It's important to seek advice from a licensed financial advisor before making any investment decisions.

FTM/USDT Bullish Continuation ahead? 👀 🚀 FTM Today analysis💎 Paradisers, prepare for a promising opportunity with #FTMUSDT. It's currently exhibiting an intriguing pattern, having recently faced rejection at a resistance point, pointing towards a likely bullish continuation from the demand zone.
💎 UPCOM:FTM has shown a tendency to follow a descending trendline, breaking above it to embark on a bullish journey. Now, after a strong rejection at resistance, there's a considerable chance for a bullish movement starting from the demand level of $.2770. Upon successful continuation, #Fantom aims to challenge resistance levels at $.3810, with the potential to climb as high as $.5484.
💎 For the discerning Paradisers, timing is of the essence. Identifying optimal entry points during this upward trend is key, and it's equally important to avoid entering at the peak. Moreover, it's crucial to be prepared for the possibility of $Fantom dipping below the $.2770 demand level. Should this occur, a bullish rebound from the support level of $.2354 might be on the cards. Nonetheless, a fall beneath this support level could bring into question the likelihood of a sustained upward move.
💎 In these evolving market conditions, strategic planning and decision-making are paramount. Employing a comprehensive trading strategy that focuses on money management and a keen understanding of support and resistance levels is essential for achieving successful trading outcomes. 🌴💰
