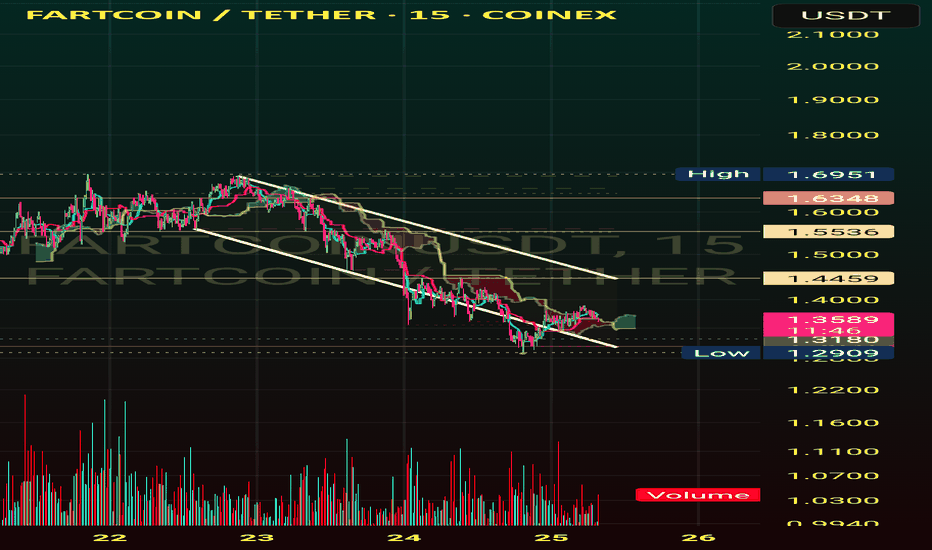
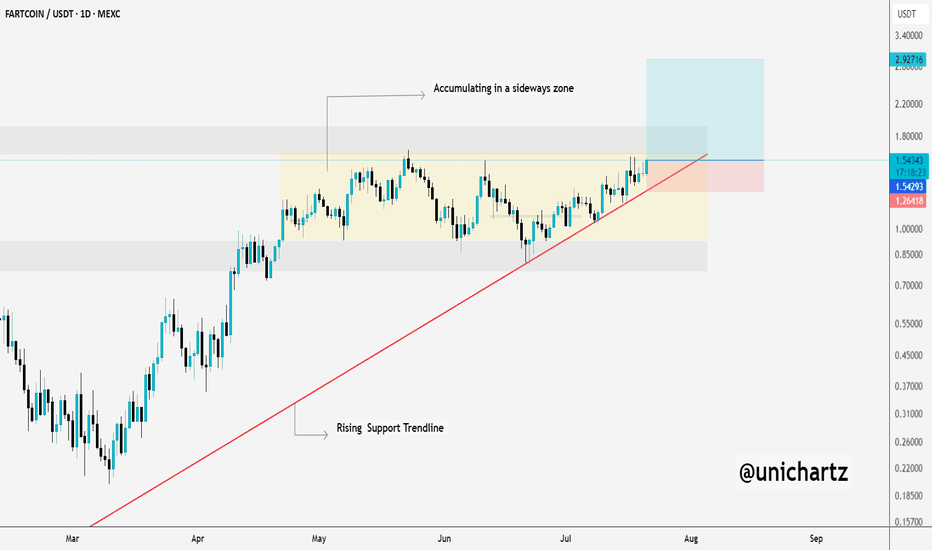
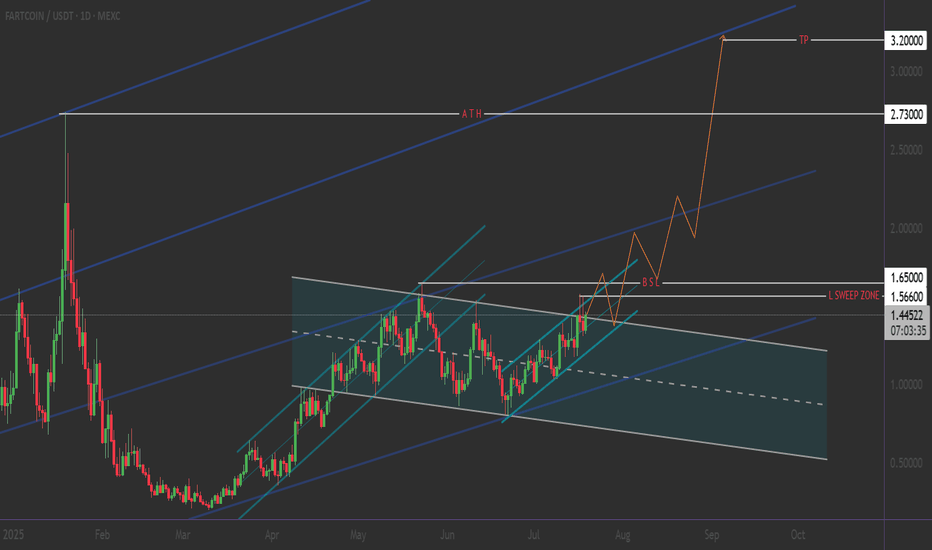
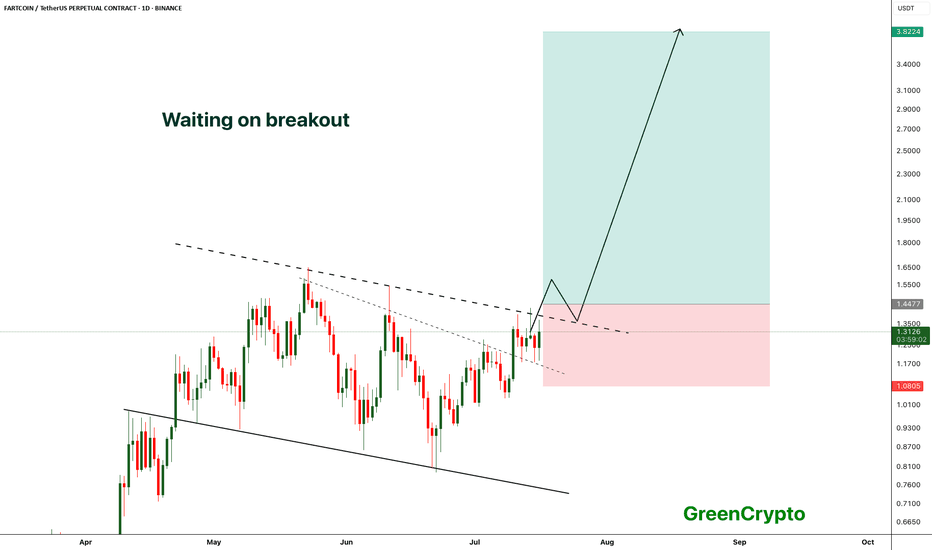
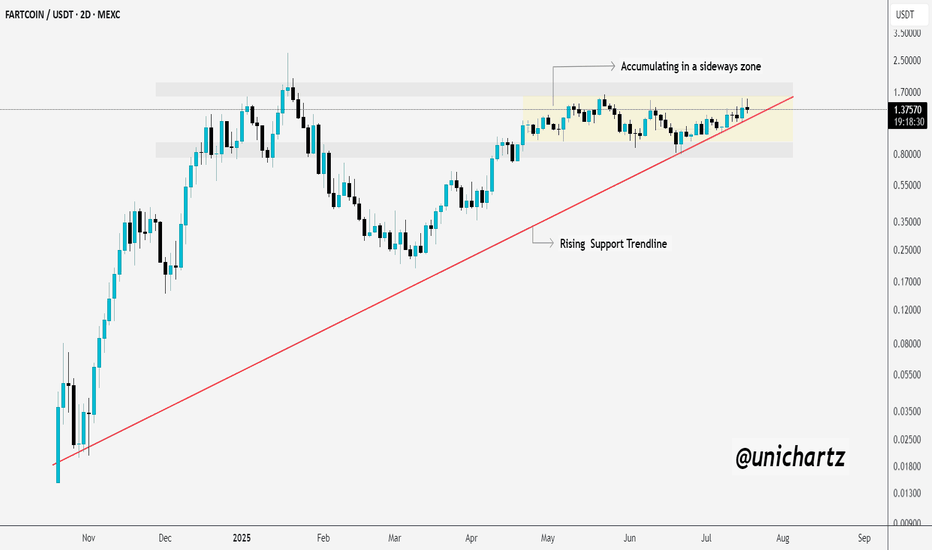
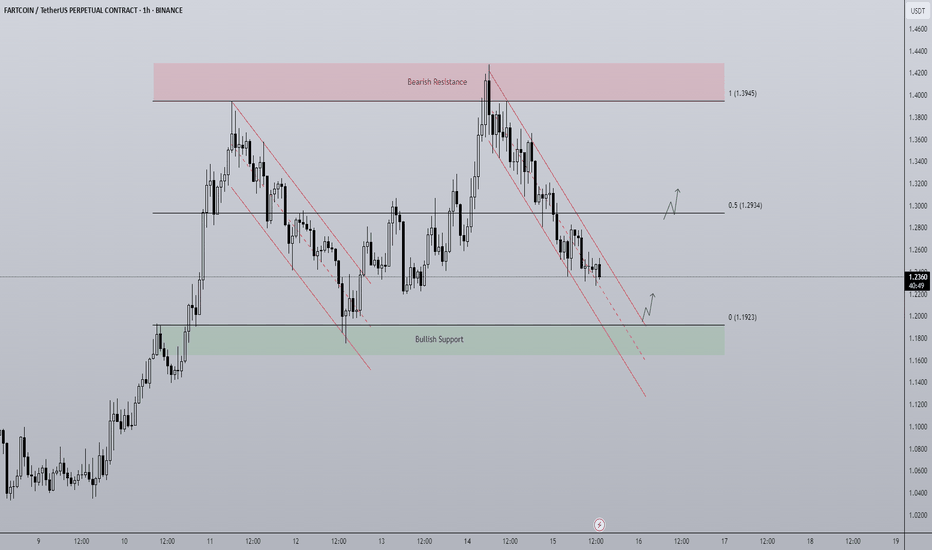
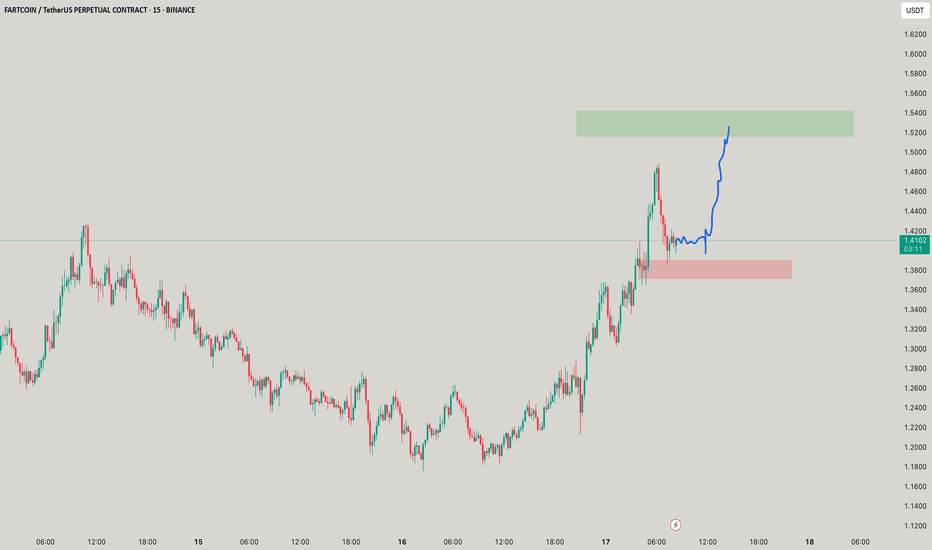
FARTCOIN: Buy and sell strategy around the Channel Down.FARTCOINUSD is about to turn neutral on its 1D technical outlook (RSI = 43.244, MACD = -0.099, ADX = 22.114) as it is approaching the 4H MA50. This is a little under the top of the short term Channel Down and is where the last sell signal flashed. Consequently it is a technical sell entry to target near the S1 level (TP = 0.55000) but tight SL needed. The reason is that if it crosses over the top of the Channel Down, the sentiment will turn bullish and we will abandon shorts, turn to longs and aim for a +300% increase (TP = 2.000), same as the Jan 13th-19th bullish wave.
## If you like our free content follow our profile to get more daily ideas. ##
## Comments and likes are greatly appreciated. ##
Fartcoin
Fart is below the critical zone, but ...The previous daily candle closed below the previous month's low as well as the long held ascending trendline. Both 5D and Weekly momentum indicators and price action are strongly bearish.
It seems that the current crypto market is heavily manipulated by market makers and it often happens on weekends when the volume is low. The price seems to drop sharply on Fri and Sat so I am being cautious with such price action and I have been avoiding opening and or closing a position on weekends. The Friday daily candle formed a big fat red candle below the critical zone, and it can trigger some people to panic sell. I might be wrong, but it seems manipulative move to me.
As I said in my previous article, I hold a small bag of Fart coins. I don't leverage trade. I allocate a small capital in various meme coins. My approach is if it goes to zero or clearly goes to zero, I accept my fate. But if it goes up, I take profit when negative divergence forms in either the 4H or daily chart.
Currently, the price is below the previous month low and below the trend line. However, the price reached Fib 0.786 and is hovering above that level. The price is at this stage holding that area. In my experiences, fib 0.236 and Fib 0.785 are quite stubborn areas for the price to penetrate. I look at these lines as the last line of defence for the bull and bear.
I will continue to observe how the price will behave in the area marked in the blue rectangular block in the chart. All momentums are bearish so it is not the time to be buying, or get involved in any way!
Do not buy the dip. If you are interested in investing in this asset, wait for the momentums to come back for the bull and buy the strength.
Buy soon There is one major trendline that is gently sloping up in the daily chart. The price seems that it always comes down to the trendline like a magnet and is making higher high.
All momentum indicators in the daily chart show hidden divergence which supports the continuation of the trend.
Daily stochastic has reset and now is moving to the upside from the oversold territory. So, my plan is when MACD enters the bull zone in the 4H chart, I am going to add more to my existing position.
Fartcoin: Navigating the Pullback for a Long EntryGreetings, traders,
I'll forego an extensive analysis of Fartcoin's recent price surge and subsequent pullback. Instead, I'll offer a concise trading suggestion: Following a potential retracement to the $0.91000 area, prepare for a long position entry. Upon confirmation of a renewed uptrend after this correction, consider entering above the $0.96000 level.
Profit targets are set at:
$1.13000
and
$1.36000
Implement a stop-loss order at $0.785, equivalent to your first profit target's distance from your potential entry price, maintaining a 1:1 risk-reward ratio.
Happy trading!
Disclaimer: This analysis is for informational purposes only and should not be considered financial advice. Trading cryptocurrencies involves significant risk, and you could lose some or all of your investment. Conduct your own research and due diligence before making any trading decisions. I am not responsible for any losses incurred.
$UFD Set to Surge 50% Following Symmetrical Triangle BreakoutThe Solana-based memecoin, Unicorn Fart Dust ($UFD), is generating significant buzz in the crypto space. Following a 40% rally that broke through the upper trendline of a symmetrical triangle pattern, $UFD is now positioned for an additional 50% surge. This anticipated move is supported by robust technical and fundamental indicators, signaling a potential bullish continuation for the token.
Technical Analysis
The breakout from the symmetrical triangle pattern is a classic technical indicator of strong upward momentum. Key metrics further bolster this bullish outlook:
1. Relative Strength Index (RSI): At 66, the RSI indicates strong momentum while remaining below the overbought threshold, suggesting room for further gains.
2. Candlestick Pattern: The emergence of a Three White Crows pattern—a series of three consecutive bullish candlesticks—often signals a trend continuation. This pattern aligns with the breakout, adding further credibility to the bullish scenario.
3. Volume Surge: A notable increase in trading volume accompanies the breakout, highlighting heightened market activity and strong investor interest.
Origins and Story
Unicorn Fart Dust’s journey from a humorous concept to a serious market contender is remarkable.
Launched by a 54-year-old first-time crypto enthusiast, $UFD was created in just three hours as an experiment in the memecoin market. The founder’s documentation of this journey on YouTube has added a personal and relatable narrative, attracting a loyal community.
Similarly, $UFD’s trading volume has surged to $34.8 million in the past 24 hours, a 49.7% increase from the previous day. This spike underscores growing market interest and activity. $UFD is actively traded on both decentralized exchanges like Raydium and Orca and centralized exchanges such as MEXC. Raydium’s UFD/SOL pair alone has recorded a 24-hour trading volume of $20 million, demonstrating strong liquidity.
Since its all-time low of $0.06018 on January 1, 2025, $UFD has risen by 367.9%. While it recently hit an all-time high of $0.2887, its current price is only 2.47% lower, indicating sustained upward momentum.
The Road Ahead for $UFD
Unicorn Fart Dust’s combination of technical strength and compelling fundamentals positions it as a standout player in the memecoin market. The symmetrical triangle breakout and accompanying technical patterns suggest a bullish continuation, with a potential 50% price surge on the horizon. Meanwhile, its unique origin story and growing community support solidify its place as more than just a fleeting meme.
As $UFD continues to gain traction, it exemplifies how creativity and market dynamics can converge to create significant opportunities in the crypto space. Whether you’re a seasoned trader or a curious newcomer, $UFD’s journey is one to watch closely.
Simple trading idea for long position with RSI and FibI have a bag of Fartcoin. I am planning to hold it for a while, but there is one possible trade idea using RSI in the daily chart.
On Dec 8th, RSI lines cross to the upside in the bull zone and the price continue to go up until RSI lines reached the overbought territory and crossed to the downside. If you opened a long position at the close of Dec 8th's candle and closed at the close of Dec 20th's candle, the risk reward ratio was 1:3.
The same set up just appeared two days ago. RSI lines crossed in the bullzone. MACD lines have also crossed and the first green histogram appeared as well, which is pretty bullish.
If you are interested in swing trading it, you can open a long position now with stop loss just below the previous week low and profit target at $2.97. It will be a risk reward ratio of 1:3. You can also take profit in stages according to the Fib extension levels - 1.618, 2, 2.618 and 3.
It is just an idea.
Fixing the Stinky Fart... A Trader’s TaleFixing the Stinky Fart? 💨😂 – A Trader’s Tale
Crypto is full of surprises—and memes—and nothing captures that better than Fartcoin (FART). This is the story of a stinky trade, a lesson in patience, and why managing emotions is as crucial as managing your charts.
What is Fartcoin?
Honestly, who knows? 🤷♂️ Whether it’s a meme, a joke, or just the stinkiest coin in crypto history, one thing’s for sure: Fartcoin moves fast. With an all-time high of $1.60 and a recent drop to $0.68, FART has been a gas-filled ride for traders brave enough to take it on.
My Fartcoin Trading Story
💨 January 3:
I decided to short Fartcoin at around $1.50. The setup looked perfect, and I was feeling confident.
💨 The Drop:
From $1.50, FART tanked all the way to $0.68—a brutal -54% drop. But guess what? I didn’t stick to my plan. I closed my trade early and missed the best part of the move.
💨 January 13:
At the very bottom, I sent a message to my friends:
"This will be remembered as the Fartcoin Dip. Crypto farts all the way."
💨 The Bounce:
FART exploded back up by +73%, leaving me to wonder…what could have been if I had just managed my emotions?
The Stinky Lesson
Crypto isn’t just about numbers—it’s a wild world of memes, crazy moves, and emotional turbulence. But here’s the truth:
If I had stuck to my chart, I would have nailed a 54% drop and then ridden the +73% pump—possibly the best trade of my career.
Instead, I let my emotions take over, and…I farted as a trader. 💨😂
Why This Matters
The stinky side of crypto is real, but it’s also part of the game. We have to embrace the chaos, the memes, and yes, even the Farts. More importantly, we need the patience and discipline to follow our charts, manage our emotions, and learn from every mistake.
Fixing the Fart
Here’s the takeaway: I’m working on managing my emotions—not just for me, but for all of you too. Together, we’ll trade smarter, cleaner, and maybe even make the next Fartcoin moment our greatest win. 🚀
What’s your funniest crypto story? Share it below, and let’s laugh through the chaos together! 👇
One Love,
The FXPROFESSOR 💙
Fart is starting to pop - buy? Fart just formed higher high in the daily chart. Stochastics (9,3,3) reached the overbought territory and are moving up. The price also closed and moved above the previous week mid.
The next hurdle for the bull is to move above the the previous higher high which is the previous month high at $1.30 area.
Daily MACD is in the bull zone and daily stochastics are resetting, which signals the upside momentums are building up.
The 4H MACD is entering the bullzone, but the only problem is 4H stochastic has already reached overbought territory. Once the stochastics comes down, resets and starts to move upwards, it might be a good area to open a long.
My general trading rules are below:
I use two time frames - weekly/daily and daily/4h.
1) MACD in the higher timeframe needs to be in the bull territory which is above 0. The angle of MACD is not important. It needs to be in the bull zone.
2) Stochastics (9,3,3) in the higher timeframe needs to reset and stochastics needs to cross and starts to move upwards. It cannot be in the overbought territory.
If these two conditions are met in the higher time frame, I go to the lower time frame to start looking for an exact entry point.
3) MACD lines in the lower timeframe properly cross and enter the bullzone or cross and move upwards above the bull zone. And ideally the stochastics in the lower time frame hasn't reached the overbought territory.
FARTCOIN Analysis - What Shall we Expect !!!The price has formed a wedge, and if the wedge breakout is confirmed with the daily candle closing, it can be said that the price will be bearish towards the 0.618 Fibonacci line. After that, if good volume enters, it can be said that the price may be bullish; otherwise, the price can be bearish down to 50 cents.
Give me some energy !!
✨We spend hours finding potential opportunities and writing useful ideas, we would be happy if you support us.
Best regards CobraVanguard.💚
_ _ _ _ __ _ _ _ _ _ _ _ _ _ _ _ _ _ _ _ _ _ _ _ _ _ _ _ _ _ _ _
✅Thank you, and for more ideas, hit ❤️Like❤️ and 🌟Follow🌟!
⚠️Things can change...
The markets are always changing and even with all these signals, the market changes tend to be strong and fast!!
Fartcoin - it is a bit deflatedI was anticipating the price to continue to move up higher when it broke above the previous month high. However, I need to acknowledge that the daily RSI is showing a clear negative divergence. 4H MACD is also starting to dive into bear territory. RSI and Stochastic also are pointing downwards. The candle closed below 1.2932 zone (strong resistance/support level) and the recent 4h candle closed below the buy block.
It is still too early to conclude it is the start of the bear trend. The price is still travelling along the ascending trendline. I will wait to see what the price will do around $0.95 area where Fib 0.786 meets the trendline.
I intend to hold the tokens for this bull cycle. I won't be considering to sell the tokens or open a short position. I will just wait for an opportunity for re-entry. The blue rectangular area in chart might be the area of interest for re-entry. The most important condition for me personally is that I won't go long when MACD in 4H (time frame I am trading in) and Stochastic in Daily (time frame I get a confirmation from) are not moving upwards. The angles of these momentum indicators are very important in my experience.
FARTRCOIN losing...steam?..no... gas!?If you find this information inspiring/helpful, please consider a boost and follow! Any questions or comments, please leave a comment!
#Fartcoin Analysis: Key Levels and What’s Next
When it comes to Fartcoin, the recent price action has been, well, a real gas. There are several ways to interpret the current move, but one thing that stands out is the sharp swing up from the 0.773 level. With in this move we can see good separation between corrections, catching the eye as a potential impulse. But if this swing was the orthodox end of a larger degree downtrend, we might still expect one more wave 4 and wave 5 to complete the structure.
The 1.30 Level: Breaking Wind or Breaking Through?
The key area to watch is 1.30. Historically, this level served as resistance but flipped to support during the last leg up. Recently, however, Fartcoin has broken structure by dipping below this level, taking out the previous wave 4. While this isn’t a confirmed game-over moment for the bulls, it’s not exactly a breath of fresh air either. To keep the momentum alive, the bulls need to retake 1.30 and push upwards decisively. Otherwise, this rally might just be running on fumes.
What Happens If 1.30 Fails?
Should Fartcoin fail to reclaim 1.30 and instead break further below, a retest of this level from the underside would likely solidify the bearish case. In this scenario, it might be time to consider a short position, as the rally could officially let one rip—straight to lower levels.
Scenarios to Watch
Bullish Redemption: Price retakes 1.30, flipping it back to support, and continues upward. This scenario would validate the potential for further impulsive moves and a continuation of the uptrend. In other words, Fartcoin could blow past expectations.
Bearish Breakdown: Price breaks below 1.30 and retests the level from the underside. This would indicate a loss of bullish control and a potential shift to a deeper correction or a full reversal. It’s the kind of situation where the market might just leave bulls holding their noses.
Final Thoughts
While Fartcoin’s recent moves have been impressive, the current structure is at a critical juncture. Whether it’s going to explode back upwards or blowing the rally to pieces, the 1.30 level will be pivotal in determining the next direction. Bulls need to regain control, but if they fail, it could be time for the bears to toot their own horn.
Trade safe, trade smart, trade clarity.
Phemex Analysis #49: How to Trade FARTCOIN Like a Pro. FARTCOIN ( PHEMEX:FARTCOINUSDT.P ) has taken the crypto world by storm this week, skyrocketing nearly 100% in value and capturing the attention of traders everywhere. This meteoric rise is fueled by its unique positioning as a blend of AI agents and meme coin culture, a combination that has resonated with the market. Riding the wave of the surging AI Agents category—led by heavyweights like VIRTUALS and AI16Z—FARTCOIN has solidified its place as one of the hottest tokens in the space.
But with such explosive growth comes volatility, and traders are now asking: What’s next for FARTCOIN? Today, we’ll analyze its key support and resistance levels to craft a trading plan that prepares for multiple scenarios. Whether you’re chasing highs or looking to buy dips, understanding these levels is crucial to navigating FARTCOIN’s unpredictable journey.
Scenario 1: The Bullish Surge Continues
Imagine this: FARTCOIN’s rally shows no signs of slowing down. Buyers keep piling in, pushing the price past its immediate resistance at $1.433, followed by $1.482—both key levels that could signal continued bullish momentum. If this breakout happens with high trading volume, it might present an opportunity for traders to ride the wave higher.
However, it’s essential to remain cautious as prices approach psychological resistance levels like $2.00 and $3.00. These round numbers often act as profit-taking zones where traders cash out, creating potential pullbacks. For those looking to capitalize on this scenario, timing is everything—chasing highs can be lucrative but also risky if momentum fades.
Scenario 2: A Healthy Retracement
Even the hottest coins need to catch their breath after a massive rally, and FARTCOIN might be no exception. In this scenario, we could see a temporary retracement as the price dips back toward $1.25—a key support level—to consolidate and build strength for another move upward.
If trading volume decreases during this pullback, it could signal that sellers are losing steam while buyers quietly accumulate positions. Prices might bounce between $1.25 and $1.43 during this phase, forming a base for the next leg up.
For traders considering an entry during this consolidation phase, risk management is critical. Setting a stop-loss just below $1.25 can help protect against unexpected drops. Alternatively, you could wait for a confirmed breakout above $1.43 before entering to ensure momentum is back on your side.
Scenario 3: The Bearish Reversal
While optimism surrounds FARTCOIN’s recent performance, it’s important to remember that anything is possible in the volatile world of crypto trading—including a bearish reversal. If prices break below $1.25 with high selling volume, it could signal a deeper correction ahead.
In this case, traders should watch for support levels at $1.08, $1.00, and even as low as $0.88. These zones might attract long-term bullish investors looking to “buy the dip,” but caution is warranted if bearish momentum continues to dominate.
For those who believe in FARTCOIN’s long-term potential, these lower levels could present attractive buying opportunities—but only if you’re prepared to weather short-term volatility.
Trading FARTCOIN Like a Pro
Navigating FARTCOIN’s wild price movements requires discipline and adaptability. Here are some tips to trade like a pro:
•Stay flexible: Prepare for all three scenarios—bullish breakout, consolidation, or bearish drop—and adapt your strategy accordingly.
•Manage risk: Use stop-loss orders to protect your capital in case of unexpected reversals.
•Take profits strategically: Don’t get greedy; consider taking partial profits near key resistance levels like $2.00 or $3.00.
•Follow the Volume: High trading volume often confirms the strength of a breakout or breakdown, so keep an eye on this critical indicator.
•Be patient: If you’re unsure about entering during consolidation or retracements, wait for clear signals before committing your funds.
FARTCOIN’s story is far from over—it’s just getting started. Whether it continues its meteoric rise or takes a breather before its next move, understanding key levels and scenarios will help you trade with confidence amidst the chaos of crypto markets!
Tips:
Elevate Your Trading Game with Phemex. Experience unparalleled flexibility with features like multiple watchlists, basket orders, and real-time adjustments to strategy orders. Our USDT-based scaled orders give you precise control over your risk, while iceberg orders provide stealthy execution.
Disclaimer: This is NOT financial or investment advice. Please conduct your own research (DYOR). Phemex is not responsible, directly or indirectly, for any damage or loss incurred or claimed to be caused by or in association with the use of or reliance on any content, goods, or services mentioned in this article.
Fartcoin - Fart is going to blast off The price has been consolidating since 21st Dec. Since 25th Dec, the price had been consolidating in the descending wedge pattern. It broke above it, retested, the top descending trendline and bounced back up. Now, the price is about to break previously week high. All momentum indicators in 4H and Daily are signalling the price to move up. ai16Z and Virtualprotocol both had the very similar set up in Daily chart before they had a parabolic leg up.
I think it is a good place to go long.
The profit target for me is $2. I don't trade with leverage.
Fartcoin - Fart is about to explode? Fartcoin decisively broke out above the descending wedge, retested the top ascending line and is moving up. Momentum indicators are all in the bull territory. However, there is a large sell block sitting above. I think the price will eventually break out to upside, but until the sell block disappears the price might move sideways for a while, struggling to move above Fib 0.786 level (last line of defence for the bear). I don't trade meme coins, but if I have to trade, I will enter at $1 zone with stop loss at $0.69 and profit target at $1.68 (1.618 Fib extension level). Ris/Reward ratio is 2:08. I own a bag of fartcoins and intend to take profit in stages when momentum indicators show clear negative divergence in 4H or Daily chart.
Fartcoin/Usdt BITGET:FARTCOINUSDT
### FartCoin Current Price Structure
- **Current Price:** The price of FartCoin is currently **0.8353**. This is a key price level that could determine whether the coin moves upwards or downwards in the near future. It's crucial to observe whether the price holds here or if it moves significantly.
### Resistance Levels
Resistance levels are price points where the coin is expected to face selling pressure, which could prevent the price from going higher. These levels act like "ceilings" in the market, and traders watch them closely because if the price reaches one of these levels, it could struggle to break through without a significant increase in buying volume.
For FartCoin, the resistance levels are:
- **0.100**: This is a very low resistance level, meaning FartCoin may face a bit of resistance here, but it’s likely part of a short-term price structure.
- **1.124**: If the price reaches here, expect more significant resistance. The market may start to slow down or reverse, so watch closely for any signs of price rejection.
- **1.33**: This is another key resistance level. If the price reaches 1.33, it would signal strong resistance, and the coin may have difficulty moving higher unless there’s a surge in buying interest.
### Support Levels
Support levels are where the price tends to find buying interest. When the price reaches a support level, traders might buy, which can push the price higher. If the price falls below a support level, it might indicate further downside potential.
For FartCoin, the support levels are:
- **0.7000**: If the price drops to 0.7000, this could be a level where buying pressure may increase, potentially helping the price bounce back up.
- **0.5000**: If the price continues to fall and reaches 0.5000, it is considered a stronger support level. This could be a point where investors see an opportunity to buy, potentially leading to a rebound in price.
### What to Watch For
- **Price Holding at 0.8353:** If the price holds around this level (0.8353), it could potentially test the resistance levels, especially if there is enough buying interest. This would suggest a bullish outlook where the price might continue to climb toward those resistance levels of 1.124 and 1.33.
- **Price Dropping Below 0.7000:** If the price doesn't hold above 0.8353 and drops below 0.7000, it could be a sign that FartCoin is moving into a bearish phase. In this case, the next major support level would be around 0.5000, and traders would watch for signs of stabilization or reversal there.
Disclaimer : Not Financial Advice