Fartcoin

$FARTCOIN Update!!$FARTCOIN has successfully bounced off the ascending channel support, aligning perfectly with the 200 EMA and previous breakout zone.
This confluence adds strong confirmation to the bullish setup. The price now targets the channel's upper boundary around $1.63, offering a solid risk-to-reward trade opportunity.
The momentum favors the bulls as long as the structure holds and the price stays above the breakout zone.
Any pullback can be seen as a chance to accumulate with a tight stop-loss of $0.92 just below the support area.
This setup looks technically sound and is for a continuation toward higher levels.
Keep your eyes on volume!

FARTCOIN Breakout and Potential RetraceHey Traders, in today's trading session we are monitoring FARTCOIN for a selling opportunity around 1.1650 zone, FARTCOIN was trading in an uptrend and successfully managed to break it out. Currently is in a correction phase in which it is approaching the retrace area at 1.1650 support and resistance zone.
Trade safe, Joe.

Fartcoin: Is the Smell of a Downtrend in the Air? 📉 Fartcoin: Is the Smell of a Downtrend in the Air? 💨
🚨 Alert: The RSI is holding its nose... and so should we.
After a suspiciously bubbly rally, $FARTCOIN is now showing bearish RSI divergence on the 4H chart — and let’s be honest, it’s starting to stink. 🦨
The recent price action looks like someone tried to pump it... but forgot to ventilate. 💣💨
🧻 Support is about to get wiped.
💩 MACD says momentum is going down the drain.
🚽 Volume drying up like gas after Taco Tuesday.
TA Summary:
RSI Divergence ✅
Rising wedge (aka clogged pipes) ✅
Community still in denial? ✅

FARTCOIN! Yet another move to come??HEYYY Fart is back!! I have attached my recent mega fart pattern which would be able to be relocated at the bottom of this page!
Look at this it - it shows a notable slowdown and rotation phase after a strong move.
From the left of the chart, price had a bullish breakout around April 27–28, with a large session where VAH and POC shifted up aggressively and volume built high near $1.24. However, that impulse seems to have faded. Since May 1st, we can observe balanced profiles with POCs aligning flat near $1.12 to $1.09, indicating market indecision and acceptance in this range.
Importantly, the last session has compressed with VAH, VAL, and POC almost overlapping near $1.09–$1.10, showing low conviction and suggesting a potential breakout build-up. If price breaks above $1.11 with good volume, it may retest $1.14–$1.17. If we lose $1.08, we could rotate lower to $1.05 or even $1.00 where older value sits.
NOwwwwwww what I can say is - in the mean time look at the charts on my doodle, the green downfall is necessary for a more good move, but can defy that in an extent because it already fell!!

FART-The 200% Explosion That's About To Correct – PREPARE now
## The Most Deceptive Chart Pattern In Crypto Right Now 💣
The 4-hour FARTCOIN/USDT chart reveals a textbook example of parabolic extension that's setting up for a critical reversal. This explosive move (+13.93% today) has created the perfect storm for smart traders to position ahead of what appears to be an inevitable correction.
🔥 TECHNICAL ALARM BELLS SCREAMING:
💥 Triple Channel Overextension
* FARTCOIN trapped in powerful ascending yellow megaphone pattern
* Secondary gray channel providing momentum framework
* Price hitting upper boundaries of BOTH channels simultaneously
* Current price ($1.06284) testing resistance cluster
💥 Unsustainable Vertical Rally
* 200%+ gain from April lows ($0.35503) to current levels
* Extreme volume spike (634.2K) signaling potential exhaustion
* Parabolic acceleration far exceeding mean channel growth rate
* Candle structure showing early reversal signals at resistance
💥 Blue Forecast Path: The Smart Money Road Map
* Initial testing of $1.20 psychological resistance
* Multiple retests of the $1.00 psychological support
* Final capitulation toward $0.85-0.90 channel support area
Why This Pattern Is SIGNIFICANTLY More Important Than It Appears
This isn't just another correction—it's the classic "blow-off top" formation that has historically preceded major reversals in speculative assets. The confluence of technical factors suggests we're witnessing the final phase of a multi-week uptrend.
🧠 The Psychology Behind This Pattern:**
* Retail FOMO creating final buying surge
* Smart money distribution happening during high volume spike
* Divergence between price action and momentum indicators
* Pink consolidation zone formed perfect launchpad for final push
## The ACTIONABLE STRATEGY For Maximum Protection & Profit
For CURRENT HOLDERS:
* Consider taking partial profits above $1.10
* Set trailing stops at $1.03 to protect gains
* Prepare for 20-30% retracement possibility
For NEW POSITIONS:
* Primary entry zone: $0.88-$0.92 (lower channel support)
* Potential secondary entry: $0.98-$1.02 (psychological support)
* Invalidation point: Sustained trading above $1.20
Risk:Reward = 1:3 on counter-trend positioning
The Hidden Market Dynamics Few Are Noticing
The explosive move coincides with broader altcoin rotation and appears to be sector-specific rather than fundamentally driven. The technical pattern suggests institutional distribution rather than accumulation—a critical distinction for timing the reversal.

Mega FartCoin Analysis - Is it the beginning? $3 when?SO previously if you have seen me analyzing fartcoin, its on this basis that all OB works in place so well, So would decipher it better. Also you can see my old posts to get a conclusion on whats to be done.
Coming to the Market Profile -
we can see that the market has built a solid volume base around the $1.08–$1.11 zone, with multiple POCs (Point of Control) stacking here — indicating strong buyer interest and fair value acceptance. This region is acting as a strong demand zone. The structure is developing a higher-low pattern since April 22nd, suggesting bullish intent, especially as price is trying to hold above the VAL/POC levels of the last two profiles. However, each upward push is still getting capped near the $1.14–$1.16 VAH area, which now becomes a critical breakout zone. If price can close above $1.16 with volume, we can expect expansion towards $1.20+. On the flip side, if price loses $1.08 and starts building value below it, that would shift the bias bearish again with potential retest of $1.03–$1.00.
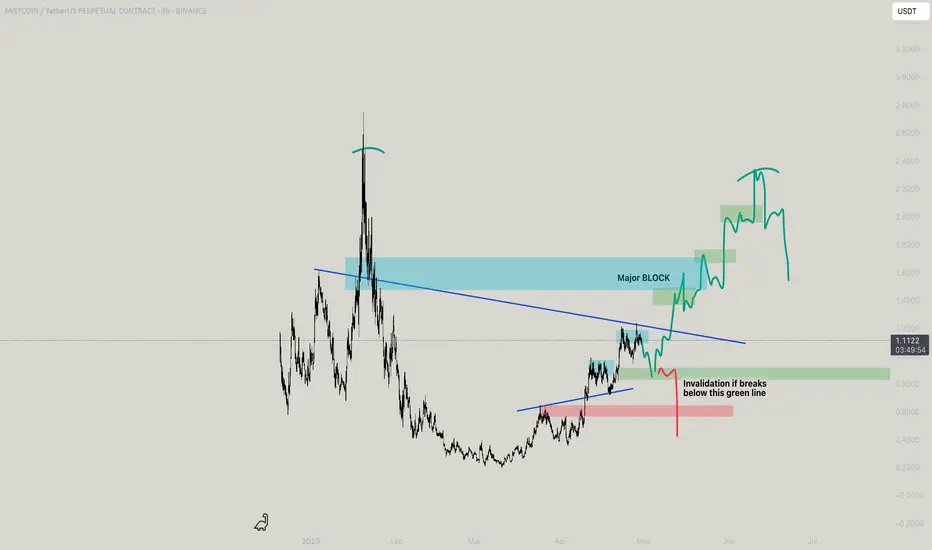
Now based on this, ive drew a lower TF 1H parabolic steep curve, which is also marked on my channel for better understanding. Now at this very point of time on 4H LTF the same pattern is being formed where invalidation is done (which is a prior to a swing before a UTAD move)
As you see cyan boxes say the pattern to get achieved and for the green is yet to be achieved!! Also have marked a major block, where most settlement of big longs and new buyers would be encouraged!!
Ready for more farts?Fartcoin is on critical 4H OB, owing to the moves earlier, it shall move in the way drawn,

FARTCOIN/USDT.P – Smells Like a Clean Short Entry’s cooking, and this setup is dripping with RR juice. Let's break it down:
📍 Entry Gameplan:
Short Zone: 1.0660 – 1.0710
SL: 1.1195 (tight and right above the wick)
TP1: 1.025
TP2: 0.9835
TP3: 0.9055 (send it 💨)
Why I Like This Setup:
That choch ➝ BOS combo? Chef's kiss.
Price tapped into supply and reacted fast = strong sellers present
Beautiful RR — no overcomplications, just structure, imbalance, and timing
This thing's been cooking sideways long enough. Now that it’s broken structure and filled its pockets with early buyers, we might finally see a solid dump.
Let’s see if FART delivers the gas.

Breaking: $FARTCOIN Surge 17% to Reclaim $1 Resistant Point The price of Fartcoin ($FARTCOIN) saw a notable uptick of 17% today to reclaim the $1 resistant flipping competitors like SEED_DONKEYDAN_MARKET_CAP:BONK , $PONKE, etc. to reclaim the $1 billion market.
This move is truly historic for $FARTCOIN as the asset has been swinging between the $0.80- $0.90 zone before reclaiming the $1 resistant point.
The 4 hour price chart shows the formation of a U-shaped pattern that is a hinting at a bullish continuation pattern with a 150% surge in sight.
Since January 2025, $FARTCOIN loss about 93% of market value dipping from a high of $2.76 to as low as $0.109. But current chart patterns and metrics hints at a bullish continuation move.
Furthermore, data from CMC shows an increase of about $352.1M in 24 hour trading volume representing 92.72% increase for $FARTCOIN.
Fartcoin Price Data
The Fartcoin price today is $1.07 USD with a 24-hour trading volume of $354,166,937 USD. Fartcoin is up 17.57% in the last 24 hours. The current CoinMarketCap ranking is #62, with a market cap of $1,068,365,252 USD. It has a circulating supply of 999,998,256 FARTCOIN coins and a max. supply of 1,000,000,000 FARTCOIN coins.

FART - YOU ROCK!I wont suggest fartcoin now but to those who hold the coin they may trail to book profits. Parabolic move commenced, means either it gets hold of the blue box making 4 stages before a fall, or might reverse from the last green box as said. The yellow is what if the last green box gets in place

Small Silent Farts for a BIg FART!Okay so I have posted each and everywhere how fart can move, considering this, small farts below the red point marked to get work done! Can churn liquidity on the red box!

Watch These 4 Crypto and Thank Me Later!I analyze several crypto assets that have strong potential to rebound nicely next week
They are:
TRUMP
GALA
TAO
FARTCOIN
Enjoy the analysis!

Gas ready? for FARTSFARTS is having a lot of beans and this coin you see with all fall rise like a beast! 4H 1H loooks very very strong, LIKE VERY!!!

Breaking: $FARTCOIN Gearing For A Breakout To 1 Bln Market CapThe price of fartcoin has been surging consecutively, but failed to break the $1 pivot or resistant point withholding the asset from breaking the $1 billion market threshold.
The memecoin was created on the Solana blockchain through pump.fun, shortly after the community took over the project making it graduate to Raydium- a DEX on Solana ecosystem. Gaining momentum, the asset was listed on few CEX like Kucoin, GateIo, BingX, etc.
Fartcoin ($FARTCOIN) has made 3 attempts to break pass the $1 resistant but each move was denied making the asset to form a short-term head and shoulder pattern. while the asset is consolidating after the recent fit, failure to break the $1 resistant for $FARTCOIN might resort to a retracement to the $0.60 support point before picking liquidity up for a reversal.
Fartcoin Price Data
The Fartcoin price today is $0.760227 USD with a 24-hour trading volume of $292,550,722 USD. Fartcoin is down 15.66% in the last 24 hours. The current CoinMarketCap ranking is #77, with a market cap of $760,225,448 USD. It has a circulating supply of 999,998,256 FARTCOIN coins and a max. supply of 1,000,000,000 FARTCOIN coins.

Are you a fart fan?I am how does it have soooo fkin liquidity!!!! I mean it has soo much liquidity god forbids it reaches 1 dolla easily but now with the arrows marked!

Is FartCOin gonna blow?Well the stacked OB and if cushions well and not breaks or below 0.7312 then expecting a move which all anticipates!

FARTCOIN/USDT – HIGH PROBABILITY SHORT FROM PREMIUM ZONEMarket structure shift confirmed with CHoCH, signaling bearish intent.
Price is retracing to fill the Fair Value Gap (FVG) — a premium zone where institutions are likely to re-enter shorts.
Entry: 0.8971 – 0.9010
Target: 0.8571 – 0.8264 – 0.7689
Stop: 0.9254
This is a high-RR setup with clean structure, imbalance, and trend alignment.
Entry in FVG with confirmation = sniper entry.
Targeting downside liquidity zones with ~1:3.5 RR.
Always do your own research, manage your risk, and use proper confirmation before entering any position. Trade responsibly.

A Not so smelly Fart by Fartcoin!So parabolic move where one more move is left, enjoy the farts enjoy the move!

$FARTCOIN Short-Term OutlookHello Friend!
Let's have and take a look on Fartcoin
The relative strength and volume here are unreal. Can we hit $1 before a pullback?

FARTCOIN Is About to Make or Break—Massive Correction Incoming ?Yello Paradisers — have you seen what’s brewing on #FARTCOINUSDT? After our spot-on predictions in previous waves, this might be the final shakeout before the real show begins. But one wrong move here… and it all falls apart.
💎#FARTCOIN has recently shown aggressive movement, completing the third wave of a classic Elliott Wave impulse. Waves 1 and 2 are in place, and with the third now printed, there's a strong probability of entering an ABC corrective phase — forming the 4th wave — which could retest areas near the previous resistance-turned-support.
💎Zooming out, the asset has been shaping a long-term Cup and Handle formation, and while we’ve seen a breakout above the neckline, a retest is highly likely before any continuation. This aligns with a potential ABC structure, adding confluence to a possible pullback scenario.
💎On top of that, FARTCOIN is flashing signs of strength within a bullish inverted Head and Shoulders pattern, with a neckline around 0.6273. A retest of this key level is probable and would further validate buyer interest in this zone.
💎Additional confluence comes from Holding the multi-timeframe EMA 20 as dynamic support. A visible order block at the 0.618 Fibonacci golden pocket (0.5217), which could act as a magnet for price during the correction.
💎If this area holds, the bullish case remains intact, with probable targets at 0.8913, and an extended move into the 1.0542–1.1361 zone. However, this structure would be invalidated on a candle close below the right shoulder, or a breakdown below the 2nd Elliott Wave low.
This is the point where the weak hands get shaken out and smart money reloads. If you're aiming for long-term success, wait for high-probability setups and protect your capital. Strive for consistency, not quick profits. Treat the market as a businessman, not as a gambler, Paradisers.
MyCryptoParadise
iFeel the success🌴

FARTCOIN Surges Over 35% in 24 Hours, Trading Volume Nears $444FARTCOIN, built on the Solana blockchain, has posted a strong daily gain. The token has risen 35.44% in the last 24 hours, 41.99% in the last seven days, and 227.62% in the last 30 days.
The current price stands at $0.7494, with a circulating supply of 999,998,256 tokens out of a total of 1 billion. Its market capitalization has reached $749.48 million while the 24-hour trading volume has spiked to $443.51 million, up 79.72%.
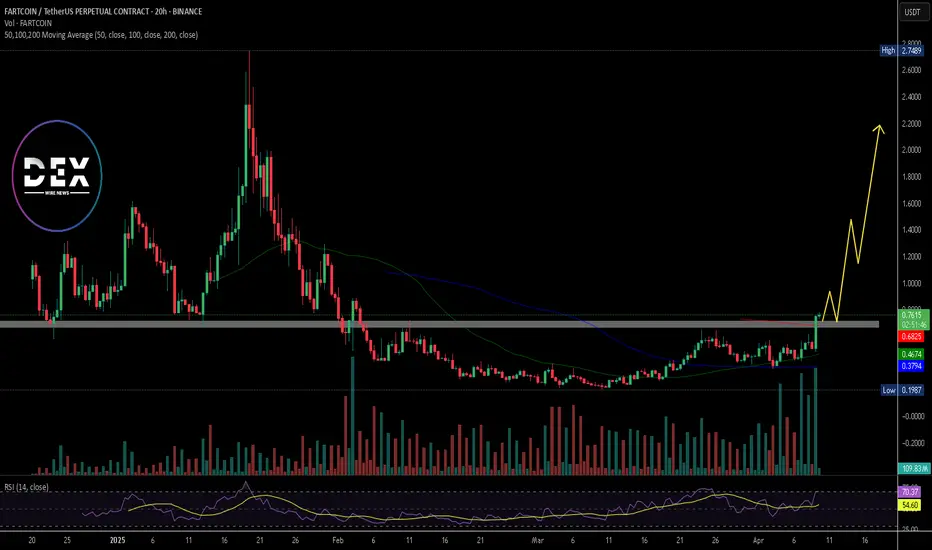
Technical Analysis: SEED_WANDERIN_JIMZIP900:FART Tests Key Resistance. Can It Break Above?
SEED_WANDERIN_JIMZIP900:FART is trading at $0.7494, showing bullish momentum. The price is trying to break through a major resistance level of around $0.7000, which has acted as a key level for prices for months.
The breakout comes with a strong volume, confirming buyer strength. The RSI is near 69.06, which also clarifies the bullish momentum in play. If a successful breakout is seen at the current resistance level, a move toward the previous high at $2,7 could follow.
Looking further at the 50 and 100 moving averages, they back up the bullish momentum as they all are below the current market price, reading at $0.46 and $0.37, respectively.
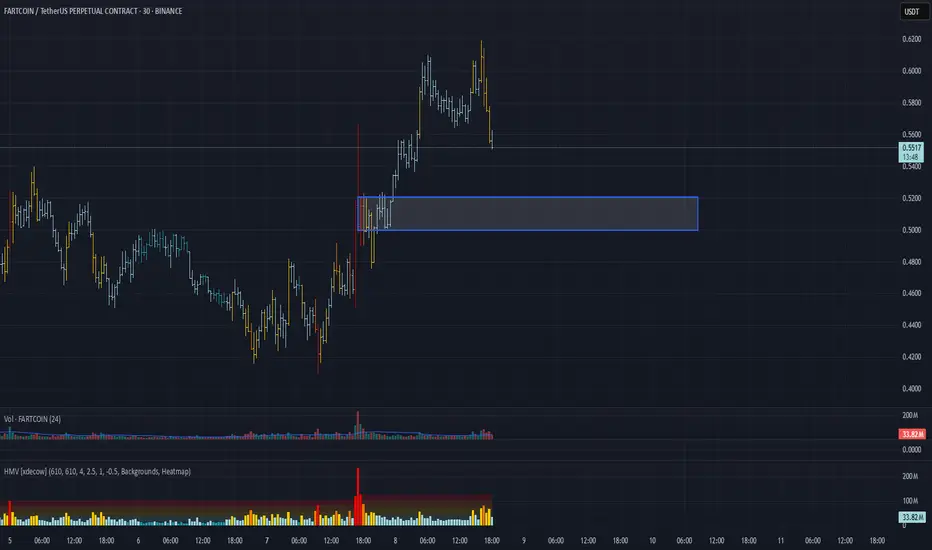
FARTCOIN/USDT Analysis – Long Setup in a Bearish MarketThis coin appears stronger than the overall market. Even during Bitcoin's sharp decline, it maintained its position and only slightly corrected.
Currently, a strong volume zone has formed at $0.50–$0.52. We expect a reaction from this level.
If confirmed, we are considering a long position with the potential to test the $0.65 high.