Is Fartcoin Meme Coin About to Crash Hard?In the ever-evolving world of crypto investment, memecoins continue to attract waves of speculative interest, even as their real-world use remains effectively nonexistent. One such meme coin token that’s recently caught the attention of traders and meme enthusiasts alike is Fartcoin—a cryptocurrency as ridiculous as its name implies. While Fartcoin may not be suitable for serious applications, it presents a fascinating case study in how to trade memecoins based purely on supply and demand imbalances.
The Origins of Fartcoin
Fartcoin emerged, predictably, as a joke. Like most memecoins, it was born not out of innovation but out of internet culture. Designed with no technical edge, no roadmap, and no ecosystem, its primary function is virality—riding the waves of social media hype and influencer shills. Fartcoin’s creators never intended it to disrupt finance or decentralize the web; they just wanted to make people laugh (and perhaps get rich in the process).
Yet, despite the lack of fundamentals, Fartcoin gained traction, thanks to Twitter and X memes, Reddit threads, and YouTube influencers who thrive on ironic tokens with humorous names. This is the bizarre paradox of memecoins and crypto investment: irrational exuberance often beats utility.
Why Fartcoin (Like All Memecoins) Can’t Be Used in Real Life
Let’s be clear—memecoins like Fartcoin offer no practical use. Unlike Bitcoin (store of value) or Ethereum (smart contract infrastructure), Fartcoin can’t pay for goods or services, nor does it solve any technological or economic problem. It exists solely for speculation.
Most real-world businesses won’t touch it. It lacks a stable price mechanism, a credible development team, and a long-term value proposition. In other words, Fartcoin is entirely unfit for real-life utility, making it a textbook example of a speculative asset detached from fundamentals.
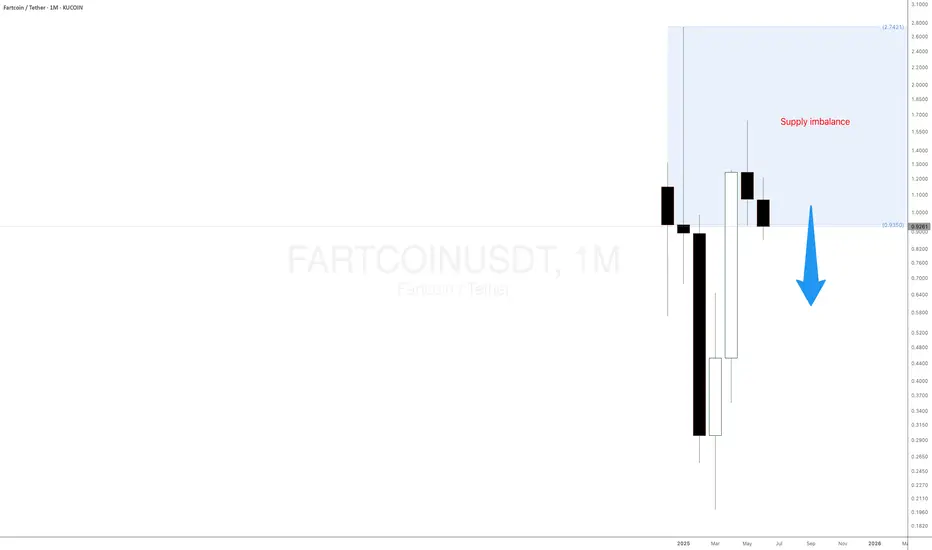
Technical Analysis: Supply Level Suggests a Dump Is Imminent
While Fartcoin may lack intrinsic value, it offers opportunities for active traders who understand market psychology and how to trade cryptos. Currently, the price action reveals a notable supply imbalance around the $0.8982 level—a monthly supply zone that has acted as a key area of institutional selling pressure.
This level is currently “in control,” meaning buyers have consistently failed to push through this resistance. Price is now hovering close to this supply level, suggesting a high probability of rejection. For traders familiar with trading memecoins, this presents a prime opportunity to take short positions using futures contracts available on select cryptocurrency exchanges, such as Kucoin, Binance, and ByBit.
FARTCOINUSDT
New Day and NEW FARTS!!This 4H SVP chart of FARTCOINUSDT continues to show strong bearish structure. The price has consistently moved lower, forming a clear downward POC trail, and the most recent profile shows value acceptance below previous VALs and POCs. The current price near 0.9344 is forming new acceptance in a lower region, with no signs of aggressive buying response. This indicates no initiative buying yet, and unless reclaimed above 0.95–0.96 (old vPOC zone), the trend remains bearish with potential continuation to lower value zones. Order Flow: Heavy absorption on the ask side and sell pressure remains dominant, what i observe is a wyckoff fall and a full pullback to the thing as stated!!

FATCOIN – Eyeing Sub-$1 Accumulation
Liking what I’m seeing—early signs of weakness showing up at key levels across a number of alts.
This opens up the chance for a healthy market retrace before any continuation.
As for $FATCOINUSDT, I’m expecting sub-$1 levels over the next couple of weeks. That’s where I plan to accumulate a substantial position.
$FARTCOIN

Do you smell what Fart gonna do?Okay so this is the only thing which smells alot - How? Smell of money! Invalidation below the black line!!

$FARTCOINUSDT – Breakout in Progress!#FARTCOIN is breaking out of a bullish pennant while riding within a strong ascending channel. After multiple successful retests of dynamic support and the 200 EMA, price is pushing higher with strong momentum.
📊 Technical Highlights:
Bullish pennant breakout
Support from channel + 200 EMA
Strong consolidation before breakout
🎯 Targets:
TP: $1.8137
🛑 Stop-loss: $1.0998
📍 Entry Zone: $1.35 area (current breakout level)
The trend remains bullish, and continuation toward the upper channel resistance is in play.

Fartcoin price analysis😕 In such a market, it is probably safe to buy only #FARTCOIN
But seriously, price has been holding quite well in recent days, despite the "bloody market"
You shouldn't rush to buy, but why not take it "on the pencil".
🐳 A safe purchase is made after the blue route will fix up
💔 Risky buying - by the red road.
What will you choose?)

FARTCOIN Bearish Head and Shoulders – Testing Blue Support🚨 $FARTCOIN Bearish Head and Shoulders – Testing Blue Support 📉
$FARTCOIN has formed a bearish head and shoulders pattern and is now testing the blue support. There’s potential for a breakout, so we need to watch closely for any signs of further movement! 📊
Let’s monitor this closely! 💼💸

TradeCityPro | FARTCOIN: Watching Trendline & RSI for Next Move👋 Welcome to TradeCityPro!
In this analysis, I’m going to review the FARTCOIN token. This project is one of the meme coins that launched in 2024 and has shown good growth so far.
🔍 This meme coin currently has a market cap of $1.31 billion and ranks 65th on CoinMarketCap.
📅 Daily Timeframe
On the daily timeframe, as you can see, the price recorded a major top at the 2.16674 zone in early 2025 and then entered a correction phase.
✨ This correction phase was quite long and extended down to 0.21562, but after a bottom was formed in that area, bullish momentum returned to the coin and it started moving upward again.
✔️ Currently, the price has moved up to around the 1.53002 level and has a rising trendline that it has touched several times, serving well as a dynamic support level.
📊 For now, the issue with this trend is that the volume has significantly decreased compared to the previous leg, which could indicate weakness in the upward trend. We need to wait and see whether buying or selling volume increases in the next move — either a correction or another bullish leg — to confirm whether the trend will reverse or continue.
📈 For a long position, 1.53002 is the closest trigger to the current price. If this level is broken, the price could move toward 2.16674.
🛒 The main confirmation for a bullish continuation and a strong long position would come after the breakout of 2.16674. That’s also our trigger level for a spot buy.
🔽 To turn bearish, the key trigger is breaking the 0.63121 support. However, a riskier trigger would be breaking the trendline and activating the 1.00301 trigger. If that happens, we can consider it confirmation of the beginning of a correction.
💥 The RSI oscillator is currently forming a clean box between 50 and 70 and is now near the top of this box. If RSI enters the Overbuy zone, it would strongly confirm a long position.
📉 For a trend reversal or the start of a correction, a sustained RSI move below 50 would provide confirmation.
📝 Final Thoughts
This analysis reflects our opinions and is not financial advice.
Share your thoughts in the comments, and don’t forget to share this analysis with your friends! ❤️


$FARTCOIN Update!!$FARTCOIN has successfully bounced off the ascending channel support, aligning perfectly with the 200 EMA and previous breakout zone.
This confluence adds strong confirmation to the bullish setup. The price now targets the channel's upper boundary around $1.63, offering a solid risk-to-reward trade opportunity.
The momentum favors the bulls as long as the structure holds and the price stays above the breakout zone.
Any pullback can be seen as a chance to accumulate with a tight stop-loss of $0.92 just below the support area.
This setup looks technically sound and is for a continuation toward higher levels.
Keep your eyes on volume!

FARTCOIN! Yet another move to come??HEYYY Fart is back!! I have attached my recent mega fart pattern which would be able to be relocated at the bottom of this page!
Look at this it - it shows a notable slowdown and rotation phase after a strong move.
From the left of the chart, price had a bullish breakout around April 27–28, with a large session where VAH and POC shifted up aggressively and volume built high near $1.24. However, that impulse seems to have faded. Since May 1st, we can observe balanced profiles with POCs aligning flat near $1.12 to $1.09, indicating market indecision and acceptance in this range.
Importantly, the last session has compressed with VAH, VAL, and POC almost overlapping near $1.09–$1.10, showing low conviction and suggesting a potential breakout build-up. If price breaks above $1.11 with good volume, it may retest $1.14–$1.17. If we lose $1.08, we could rotate lower to $1.05 or even $1.00 where older value sits.
NOwwwwwww what I can say is - in the mean time look at the charts on my doodle, the green downfall is necessary for a more good move, but can defy that in an extent because it already fell!!

FARTCOIN/USDT.P – Smells Like a Clean Short Entry’s cooking, and this setup is dripping with RR juice. Let's break it down:
📍 Entry Gameplan:
Short Zone: 1.0660 – 1.0710
SL: 1.1195 (tight and right above the wick)
TP1: 1.025
TP2: 0.9835
TP3: 0.9055 (send it 💨)
Why I Like This Setup:
That choch ➝ BOS combo? Chef's kiss.
Price tapped into supply and reacted fast = strong sellers present
Beautiful RR — no overcomplications, just structure, imbalance, and timing
This thing's been cooking sideways long enough. Now that it’s broken structure and filled its pockets with early buyers, we might finally see a solid dump.
Let’s see if FART delivers the gas.

Breaking: $FARTCOIN Surge 17% to Reclaim $1 Resistant Point The price of Fartcoin ($FARTCOIN) saw a notable uptick of 17% today to reclaim the $1 resistant flipping competitors like SEED_DONKEYDAN_MARKET_CAP:BONK , $PONKE, etc. to reclaim the $1 billion market.
This move is truly historic for $FARTCOIN as the asset has been swinging between the $0.80- $0.90 zone before reclaiming the $1 resistant point.
The 4 hour price chart shows the formation of a U-shaped pattern that is a hinting at a bullish continuation pattern with a 150% surge in sight.
Since January 2025, $FARTCOIN loss about 93% of market value dipping from a high of $2.76 to as low as $0.109. But current chart patterns and metrics hints at a bullish continuation move.
Furthermore, data from CMC shows an increase of about $352.1M in 24 hour trading volume representing 92.72% increase for $FARTCOIN.
Fartcoin Price Data
The Fartcoin price today is $1.07 USD with a 24-hour trading volume of $354,166,937 USD. Fartcoin is up 17.57% in the last 24 hours. The current CoinMarketCap ranking is #62, with a market cap of $1,068,365,252 USD. It has a circulating supply of 999,998,256 FARTCOIN coins and a max. supply of 1,000,000,000 FARTCOIN coins.

Small Silent Farts for a BIg FART!Okay so I have posted each and everywhere how fart can move, considering this, small farts below the red point marked to get work done! Can churn liquidity on the red box!

Gas ready? for FARTSFARTS is having a lot of beans and this coin you see with all fall rise like a beast! 4H 1H loooks very very strong, LIKE VERY!!!

Breaking: $FARTCOIN Gearing For A Breakout To 1 Bln Market CapThe price of fartcoin has been surging consecutively, but failed to break the $1 pivot or resistant point withholding the asset from breaking the $1 billion market threshold.
The memecoin was created on the Solana blockchain through pump.fun, shortly after the community took over the project making it graduate to Raydium- a DEX on Solana ecosystem. Gaining momentum, the asset was listed on few CEX like Kucoin, GateIo, BingX, etc.
Fartcoin ($FARTCOIN) has made 3 attempts to break pass the $1 resistant but each move was denied making the asset to form a short-term head and shoulder pattern. while the asset is consolidating after the recent fit, failure to break the $1 resistant for $FARTCOIN might resort to a retracement to the $0.60 support point before picking liquidity up for a reversal.
Fartcoin Price Data
The Fartcoin price today is $0.760227 USD with a 24-hour trading volume of $292,550,722 USD. Fartcoin is down 15.66% in the last 24 hours. The current CoinMarketCap ranking is #77, with a market cap of $760,225,448 USD. It has a circulating supply of 999,998,256 FARTCOIN coins and a max. supply of 1,000,000,000 FARTCOIN coins.

#FARTCOINUSDT is set for a bearish scenario📉 SHORT # BYBIT:FARTCOINUSDT.P from $0.7376
🛡 Stop loss: $0.7830
🕒 Timeframes: 1H + 4H
✅ Overview:
➡️ On the 4H chart BYBIT:FARTCOINUSDT.P , price broke down from the Bullish Flag, thereby invalidating the bullish scenario.
➡️ The Top 2 formation failed to break the previous high, confirming a bearish structure.
➡️ The $0.7822 level was broken and now acts as resistance — currently being retested.
➡️ The current entry at $0.7376 is optimal after a weak bounce, with high downside potential.
➡️ Volume increased on the red candles, confirming that sellers are in control.
➡️ Support levels are at $0.7172, $0.6970, and $0.6765. The main target lies near the volume-based POC at $0.5269 (in the next stage).
🎯 TP Targets:
💎 TP 1: $0.7172
💎 TP 2: $0.6970
💎 TP 3: $0.6765
📢 The bearish scenario is confirmed. A continuation of the downtrend is expected.
📢 The channel breakdown and weak bounce with declining volume are strong confirmation signals for entry.
📢 Stop-loss is placed above the rejection zone.
📢 Local VPVR and price structure confirm seller pressure in this area.
🚫 Long positions are not valid at the moment — no reversal patterns or confirmations above volume resistances.
🚀 BYBIT:FARTCOINUSDT.P is set for a bearish scenario — downward movement is the priority! Watch price action and manage your levels carefully!

FARTCOIN/USDT – HIGH PROBABILITY SHORT FROM PREMIUM ZONEMarket structure shift confirmed with CHoCH, signaling bearish intent.
Price is retracing to fill the Fair Value Gap (FVG) — a premium zone where institutions are likely to re-enter shorts.
Entry: 0.8971 – 0.9010
Target: 0.8571 – 0.8264 – 0.7689
Stop: 0.9254
This is a high-RR setup with clean structure, imbalance, and trend alignment.
Entry in FVG with confirmation = sniper entry.
Targeting downside liquidity zones with ~1:3.5 RR.
Always do your own research, manage your risk, and use proper confirmation before entering any position. Trade responsibly.

A Not so smelly Fart by Fartcoin!So parabolic move where one more move is left, enjoy the farts enjoy the move!

$FARTCOIN Short-Term OutlookHello Friend!
Let's have and take a look on Fartcoin
The relative strength and volume here are unreal. Can we hit $1 before a pullback?

FARTCOIN Is About to Make or Break—Massive Correction Incoming ?Yello Paradisers — have you seen what’s brewing on #FARTCOINUSDT? After our spot-on predictions in previous waves, this might be the final shakeout before the real show begins. But one wrong move here… and it all falls apart.
💎#FARTCOIN has recently shown aggressive movement, completing the third wave of a classic Elliott Wave impulse. Waves 1 and 2 are in place, and with the third now printed, there's a strong probability of entering an ABC corrective phase — forming the 4th wave — which could retest areas near the previous resistance-turned-support.
💎Zooming out, the asset has been shaping a long-term Cup and Handle formation, and while we’ve seen a breakout above the neckline, a retest is highly likely before any continuation. This aligns with a potential ABC structure, adding confluence to a possible pullback scenario.
💎On top of that, FARTCOIN is flashing signs of strength within a bullish inverted Head and Shoulders pattern, with a neckline around 0.6273. A retest of this key level is probable and would further validate buyer interest in this zone.
💎Additional confluence comes from Holding the multi-timeframe EMA 20 as dynamic support. A visible order block at the 0.618 Fibonacci golden pocket (0.5217), which could act as a magnet for price during the correction.
💎If this area holds, the bullish case remains intact, with probable targets at 0.8913, and an extended move into the 1.0542–1.1361 zone. However, this structure would be invalidated on a candle close below the right shoulder, or a breakdown below the 2nd Elliott Wave low.
This is the point where the weak hands get shaken out and smart money reloads. If you're aiming for long-term success, wait for high-probability setups and protect your capital. Strive for consistency, not quick profits. Treat the market as a businessman, not as a gambler, Paradisers.
MyCryptoParadise
iFeel the success🌴

FARTCOON BUY TIMEFARTCOIN is trading above big buy bullish FVG. After diving into this liquidity area we are expecting bounce because previous low liquidity has been sweept.

FARTCOIN - Quick SIlent FartsSo quick farts and silents are deadly, hence a small trade for short defying orderblock shall be taken into consideration, I repeat defying OB!
