Fartcoin price analysis. Wave -(5)- coming soon ?)📢 Almost 3 months have passed since our last #Fartcoin post
During this time, the #FartcoinUSDT price has corrected itself well.
📈 What do you think about making another wave up - (5) - the final one?
Well, at least looking at our interpretation of the wave analysis on this chart, it turns out that there is a chance for this !)
🚀 Growth to $2 and $2.37
ℹ️ The main and unshakable condition is that the #Fartcoin price cannot fall below $0.87 for this analysis and forecast to be relevant!
________________
📚 Follow us ❤️ for daily crypto insights & updates!
🚀 Don’t miss out on important market moves
Fartcoinusdtperp

Fartcoin Coiling Up for a Parabolic Move$FARTCOIN is bouncing perfectly from the rising trendline and continuing to accumulate within the sideways range.
If it manages to break above the marked resistance zone, we could see a parabolic move ahead.
The structure looks strong, and momentum is building, keep a close watch on this one, things could get explosive soon.
DYOR, NFA
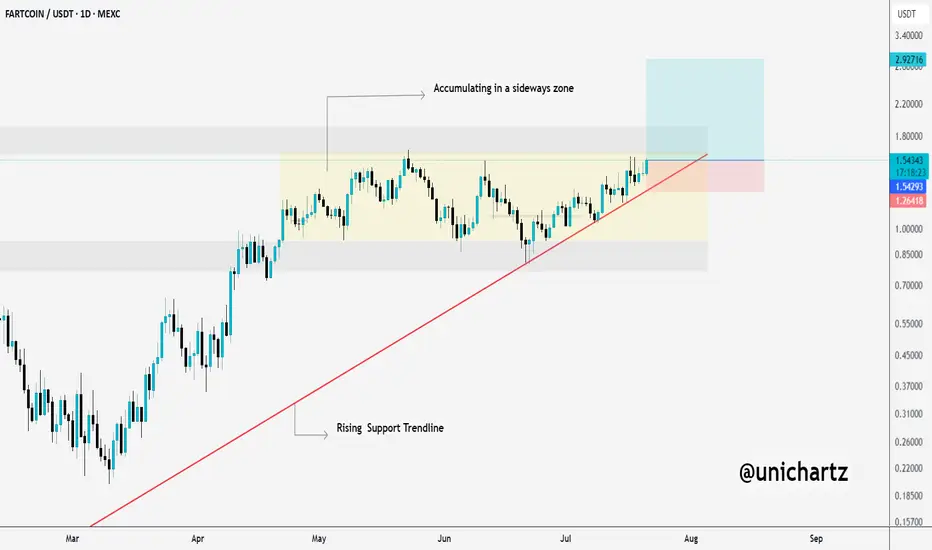
FARTCOIN Holding the Trendline Like a ChampFARTCOIN is currently consolidating in a sideways range, forming a clean accumulation zone just above the rising trendline support. This kind of structure often builds energy for the next leg up.
As long as the price respects the rising trendline, the bulls remain in control. A breakout above the sideways zone could trigger a strong move toward the upper resistance levels.
Keep an eye on this one — it’s showing strength and gearing up for a potential breakout.

FARTCOIN/USDT – 4H Chart Analysis$FARTCOIN is showing strong structure and has broken out of a bullish flag formation on the 4H timeframe. The price is currently holding above the breakout zone, which increases the probability of continuation.
Setup:
Entry: Buy on retest of breakout (~1.20–1.21 zone)
Stop Loss: Below 1.15
Targets:
TP1: 1.25
TP2: 1.35
TP3: 1.53
Support: 1.15
Resistance levels ahead: 1.25 | 1.35 | 1.53
Watch for the retest — it may provide a great second entry opportunity if missed.
DYOR. Not financial advice
#FARTCOIN #CryptoTrading

FARTCOIN – Triangle Pattern Setting Up for a Break
**Pair:** FARTCOIN/USDT
**Timeframe:** 1H
**Pattern:** Symmetrical Triangle
FARTCOIN is consolidating around 1.1820 within a symmetrical triangle on the 1H chart. This structure usually signals a breakout is near — but the direction remains uncertain.
**Bullish Case:**
If the price breaks above the upper trendline with strong momentum, we could see a short-term bullish move.
**Bearish Case:**
If the triangle support breaks down, expect bearish continuation in the short term.
No confirmed move yet. Wait for a clear breakout before entering.

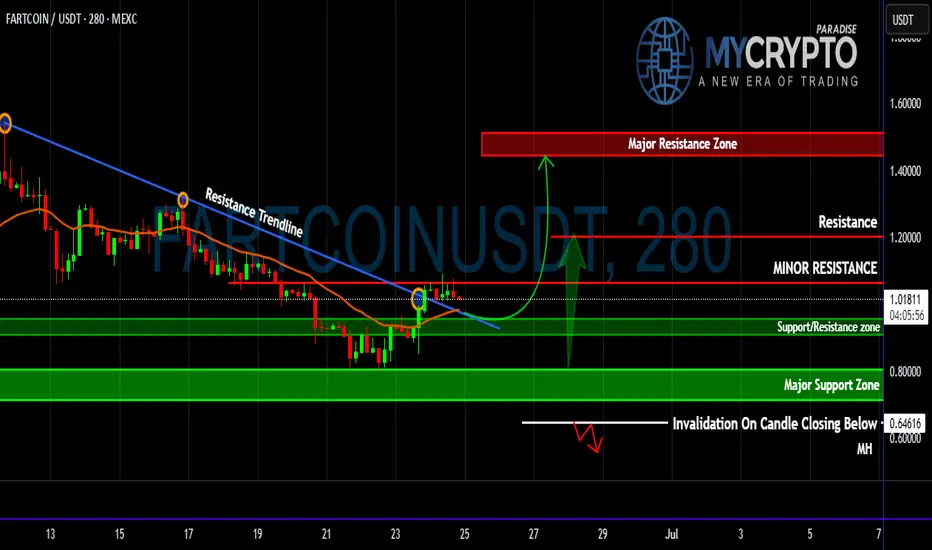
FARTCOIN Flipped Key EMA—Is This the Start of a Pump or Trap?Yello Paradisers ! Are we looking at a breakout that could deliver massive upside, or is this just another emotional trap before the next leg down? The market has been ruthless lately, and unless you base your decisions on structure, probability, and proper confirmation, you’re gambling—not trading. Let’s break down this #FARTCOIN setup from a professional standpoint.
💎#FARTCOIN has finally broken above a clearly defined descending resistance trendline, signaling a potential probable shift in short-term momentum. This breakout occurred precisely as the price reclaimed the multi-timeframe EMA —a key dynamic level that has consistently acted as resistance throughout the downtrend. The reclaim and hold above this EMA significantly increase the probability of a short- to mid-term trend reversal, especially as it aligns with an early attempt to build a bullish market structure.
💎Price is now trading just below a minor resistance level. This zone has capped previous upward attempts and is the first level bulls must overcome for continuation. A confirmed 4H/1H or daily candle close above this resistance will open the door to a measured move toward the next key level at $1.20265, with extended upside potential into the major resistance zone between $1.44660 and $1.55099. Should bullish momentum pick up with increasing volume, a Probable upside move becomes a realistic scenario.
💎However, none of this is guaranteed. We're dealing with probabilities, not certainties. The support/resistance flip zone between $0.95949 and $0.90596 now becomes a crucial reference point. A healthy retest of this area could provide a higher-probability long entry, especially if price continues to respect the reclaimed EMA. Below that, the major support zone from $0.80693 to $0.71058 represents a broader demand block. If the price pulls back this far, it may signal the formation of a larger accumulation range rather than immediate continuation.
💎To manage risk effectively, traders must monitor the invalidation level at $0.64616. A 4H candle close below this level would nullify the bullish breakout scenario and increase the probability of renewed bearish control, suggesting the recent breakout was a deviation or fakeout.
Stay sharp, Paradisers! Will this be a breakout or a fake-out? Only time—and disciplined trading—will tell!
MyCryptoParadise
iFeel the success🌴
Small Farts - No Smell Gurantee!Okay so farts this is a small move you can take in conisderation to be taken in the near times! Idle scenario and stances marked!

FARTCOIN’s - High Probability Breakout or Devastating Trap?Yello Paradisers, are you truly prepared for what #FARTCOIN is signaling right now? Because this setup is dripping with opportunity—but only for those who understand market structure and probability. After a steady grind lower inside a clean falling wedge formation, price just printed a high-probability deviation below the key support/resistance zone before snapping back inside. That kind of fakeout is no joke—it’s often the precursor to a major reversal. But will this deviation mark the beginning of a bullish surge, or is it a calculated trap before another leg down?
💎#FARTCOIN is hovering just above the reclaimed support/resistance area between 0.95 and 1.00. Historically, this level has played a pivotal role. The recent deviation below and swift recovery adds to the probability that this is a classic shakeout—designed to liquidate weak longs and trap aggressive shorts. However, we must be cautious.
💎Hovering above price is the multi-timeframe EMA (represented by the orange line), which is currently serving as dynamic resistance. As long as this EMA remains unbroken, bullish momentum is at risk of stalling. The probability of continuation only rises significantly if this EMA is reclaimed with strong candle closure above it.
💎The next obstacle is the minor resistance zone around 1.04667. A sustained breakout above this level will increase the probability of a move toward 1.20265, and if momentum builds, there’s a strong case for price to reach into the higher time frame major resistance zone between 1.45 and 1.50. However, we’re not there yet—and probability works both ways.
💎Should FARTCOIN fail to hold the reclaimed zone, or if price gets rejected at either the EMA or minor resistance, the bearish scenario comes back into play. In that case, price could collapse back into the wedge, increasing the likelihood of a drop toward the major support range between 0.73 and 0.64. Even worse, a confirmed 12-hour candle close below 0.60 would invalidate the entire bullish wedge setup and open the probability for a deeper correction.
This is the point where the weak hands get shaken out and smart money reloads, Paradisers. If you're aiming for long-term success, wait for high-probability setups and protect your capital. Strive for consistency, not quick profits. Treat the market as a businessman, not as a gambler.
MyCryptoParadise
iFeel the success🌴

$FARTCOINUSDT – Breakout in Progress!#FARTCOIN is breaking out of a bullish pennant while riding within a strong ascending channel. After multiple successful retests of dynamic support and the 200 EMA, price is pushing higher with strong momentum.
📊 Technical Highlights:
Bullish pennant breakout
Support from channel + 200 EMA
Strong consolidation before breakout
🎯 Targets:
TP: $1.8137
🛑 Stop-loss: $1.0998
📍 Entry Zone: $1.35 area (current breakout level)
The trend remains bullish, and continuation toward the upper channel resistance is in play.

Ready for Missile Farts in FARTCOIN?As mentioned FARTCOIN is again onto the cushion auction OB and would slowly get all the buyers asscoiated to pull things up as said!
depicted Market profile as shown
Invaldiation if close below the green line!

FARTCOIN/USDT.P – Smells Like a Clean Short Entry’s cooking, and this setup is dripping with RR juice. Let's break it down:
📍 Entry Gameplan:
Short Zone: 1.0660 – 1.0710
SL: 1.1195 (tight and right above the wick)
TP1: 1.025
TP2: 0.9835
TP3: 0.9055 (send it 💨)
Why I Like This Setup:
That choch ➝ BOS combo? Chef's kiss.
Price tapped into supply and reacted fast = strong sellers present
Beautiful RR — no overcomplications, just structure, imbalance, and timing
This thing's been cooking sideways long enough. Now that it’s broken structure and filled its pockets with early buyers, we might finally see a solid dump.
Let’s see if FART delivers the gas.

Breaking: $FARTCOIN Surge 17% to Reclaim $1 Resistant Point The price of Fartcoin ($FARTCOIN) saw a notable uptick of 17% today to reclaim the $1 resistant flipping competitors like SEED_DONKEYDAN_MARKET_CAP:BONK , $PONKE, etc. to reclaim the $1 billion market.
This move is truly historic for $FARTCOIN as the asset has been swinging between the $0.80- $0.90 zone before reclaiming the $1 resistant point.
The 4 hour price chart shows the formation of a U-shaped pattern that is a hinting at a bullish continuation pattern with a 150% surge in sight.
Since January 2025, $FARTCOIN loss about 93% of market value dipping from a high of $2.76 to as low as $0.109. But current chart patterns and metrics hints at a bullish continuation move.
Furthermore, data from CMC shows an increase of about $352.1M in 24 hour trading volume representing 92.72% increase for $FARTCOIN.
Fartcoin Price Data
The Fartcoin price today is $1.07 USD with a 24-hour trading volume of $354,166,937 USD. Fartcoin is up 17.57% in the last 24 hours. The current CoinMarketCap ranking is #62, with a market cap of $1,068,365,252 USD. It has a circulating supply of 999,998,256 FARTCOIN coins and a max. supply of 1,000,000,000 FARTCOIN coins.

Breaking: $FARTCOIN Gearing For A Breakout To 1 Bln Market CapThe price of fartcoin has been surging consecutively, but failed to break the $1 pivot or resistant point withholding the asset from breaking the $1 billion market threshold.
The memecoin was created on the Solana blockchain through pump.fun, shortly after the community took over the project making it graduate to Raydium- a DEX on Solana ecosystem. Gaining momentum, the asset was listed on few CEX like Kucoin, GateIo, BingX, etc.
Fartcoin ($FARTCOIN) has made 3 attempts to break pass the $1 resistant but each move was denied making the asset to form a short-term head and shoulder pattern. while the asset is consolidating after the recent fit, failure to break the $1 resistant for $FARTCOIN might resort to a retracement to the $0.60 support point before picking liquidity up for a reversal.
Fartcoin Price Data
The Fartcoin price today is $0.760227 USD with a 24-hour trading volume of $292,550,722 USD. Fartcoin is down 15.66% in the last 24 hours. The current CoinMarketCap ranking is #77, with a market cap of $760,225,448 USD. It has a circulating supply of 999,998,256 FARTCOIN coins and a max. supply of 1,000,000,000 FARTCOIN coins.

#FARTCOINUSDT is set for a bearish scenario📉 SHORT # BYBIT:FARTCOINUSDT.P from $0.7376
🛡 Stop loss: $0.7830
🕒 Timeframes: 1H + 4H
✅ Overview:
➡️ On the 4H chart BYBIT:FARTCOINUSDT.P , price broke down from the Bullish Flag, thereby invalidating the bullish scenario.
➡️ The Top 2 formation failed to break the previous high, confirming a bearish structure.
➡️ The $0.7822 level was broken and now acts as resistance — currently being retested.
➡️ The current entry at $0.7376 is optimal after a weak bounce, with high downside potential.
➡️ Volume increased on the red candles, confirming that sellers are in control.
➡️ Support levels are at $0.7172, $0.6970, and $0.6765. The main target lies near the volume-based POC at $0.5269 (in the next stage).
🎯 TP Targets:
💎 TP 1: $0.7172
💎 TP 2: $0.6970
💎 TP 3: $0.6765
📢 The bearish scenario is confirmed. A continuation of the downtrend is expected.
📢 The channel breakdown and weak bounce with declining volume are strong confirmation signals for entry.
📢 Stop-loss is placed above the rejection zone.
📢 Local VPVR and price structure confirm seller pressure in this area.
🚫 Long positions are not valid at the moment — no reversal patterns or confirmations above volume resistances.
🚀 BYBIT:FARTCOINUSDT.P is set for a bearish scenario — downward movement is the priority! Watch price action and manage your levels carefully!

Are you a fart fan?I am how does it have soooo fkin liquidity!!!! I mean it has soo much liquidity god forbids it reaches 1 dolla easily but now with the arrows marked!

Is FartCOin gonna blow?Well the stacked OB and if cushions well and not breaks or below 0.7312 then expecting a move which all anticipates!

FARTCOIN/USDT – HIGH PROBABILITY SHORT FROM PREMIUM ZONEMarket structure shift confirmed with CHoCH, signaling bearish intent.
Price is retracing to fill the Fair Value Gap (FVG) — a premium zone where institutions are likely to re-enter shorts.
Entry: 0.8971 – 0.9010
Target: 0.8571 – 0.8264 – 0.7689
Stop: 0.9254
This is a high-RR setup with clean structure, imbalance, and trend alignment.
Entry in FVG with confirmation = sniper entry.
Targeting downside liquidity zones with ~1:3.5 RR.
Always do your own research, manage your risk, and use proper confirmation before entering any position. Trade responsibly.

FARTCOIN Is About to Make or Break—Massive Correction Incoming ?Yello Paradisers — have you seen what’s brewing on #FARTCOINUSDT? After our spot-on predictions in previous waves, this might be the final shakeout before the real show begins. But one wrong move here… and it all falls apart.
💎#FARTCOIN has recently shown aggressive movement, completing the third wave of a classic Elliott Wave impulse. Waves 1 and 2 are in place, and with the third now printed, there's a strong probability of entering an ABC corrective phase — forming the 4th wave — which could retest areas near the previous resistance-turned-support.
💎Zooming out, the asset has been shaping a long-term Cup and Handle formation, and while we’ve seen a breakout above the neckline, a retest is highly likely before any continuation. This aligns with a potential ABC structure, adding confluence to a possible pullback scenario.
💎On top of that, FARTCOIN is flashing signs of strength within a bullish inverted Head and Shoulders pattern, with a neckline around 0.6273. A retest of this key level is probable and would further validate buyer interest in this zone.
💎Additional confluence comes from Holding the multi-timeframe EMA 20 as dynamic support. A visible order block at the 0.618 Fibonacci golden pocket (0.5217), which could act as a magnet for price during the correction.
💎If this area holds, the bullish case remains intact, with probable targets at 0.8913, and an extended move into the 1.0542–1.1361 zone. However, this structure would be invalidated on a candle close below the right shoulder, or a breakdown below the 2nd Elliott Wave low.
This is the point where the weak hands get shaken out and smart money reloads. If you're aiming for long-term success, wait for high-probability setups and protect your capital. Strive for consistency, not quick profits. Treat the market as a businessman, not as a gambler, Paradisers.
MyCryptoParadise
iFeel the success🌴

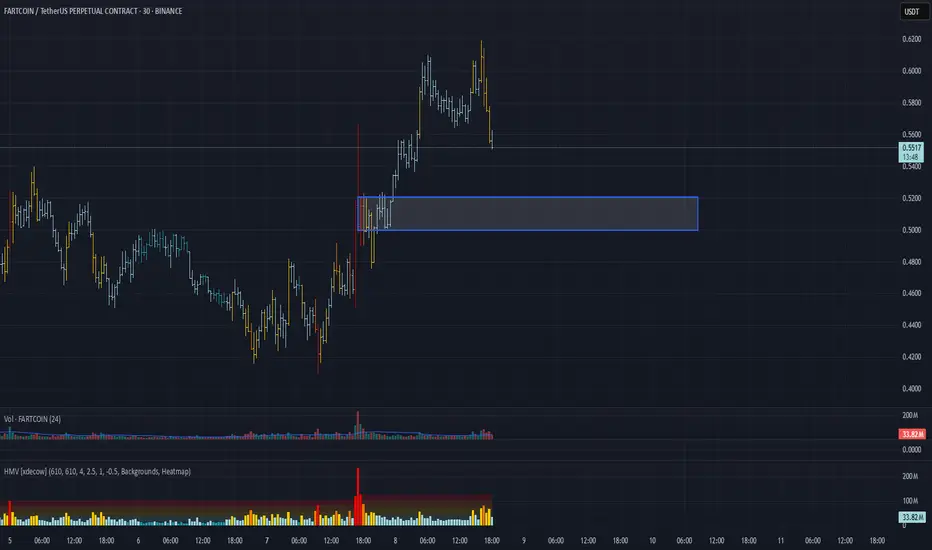
FARTCOIN/USDT Analysis – Long Setup in a Bearish MarketThis coin appears stronger than the overall market. Even during Bitcoin's sharp decline, it maintained its position and only slightly corrected.
Currently, a strong volume zone has formed at $0.50–$0.52. We expect a reaction from this level.
If confirmed, we are considering a long position with the potential to test the $0.65 high.
FARTCOON BUY TIMEFARTCOIN is trading above big buy bullish FVG. After diving into this liquidity area we are expecting bounce because previous low liquidity has been sweept.

#FARTCOINUSDT is showing bullish momentum📈LONG BYBIT:FARTCOINUSDT.P from $0.3590
🛡 Stop Loss: $0.3465
🕒 Timeframe: 1H
⚡️ Overview:
➡️ BYBIT:FARTCOINUSDT.P is showing bullish momentum on the 1-hour timeframe.
➡️ The price has recently broken through the resistance zone at $0.3590, which could serve as an entry point for a long position.
➡️ The chart shows an accumulation zone in the $0.3374–$0.3590 range, where volumes (visible on the volume profile to the left) indicate strong buyer interest.
➡️ The POC (Point of Control) is at $0.3462, confirming support below the current price.
➡️ The price is maintaining an uptrend structure: higher lows and highs are forming, and the breakout at $0.3590 is accompanied by increasing volumes, signaling bullish activity.
➡️ The #RSI (14) indicator on the 1H timeframe is at 65, indicating bullish momentum without being overbought, leaving room for further growth.
🚀 Plan:
➡️ Entry: Buy above $0.3590 after the 1-hour candle closes above this level to confirm the breakout.
➡️ Stop Loss: Set at $0.3465 (below the support zone and POC), which provides a 3.5% risk from the entry point and protects against false breakouts.
➡️ Risk/Reward Ratio: From 1:2 (for TP1) to 1:5.5 (for TP3), making this trade attractive from a risk management perspective.
🎯 Take Profit Targets:
💎 TP1: $0.3660
(nearest resistance level, +1.9% from entry)
💎 TP2: $0.3730
(zone of previous highs, +3.9%)
💎 TP3: $0.3790
(key growth target, +5.6%)
📢 A price consolidation above $0.3590 with sustained volume increases the likelihood of reaching the targets. The $0.3660 and $0.3730 levels may act as profit-taking zones, so monitor price action in these areas.
📢 Risks: If the price drops below $0.3465, it could signal a false breakout and a return to the consolidation zone of $0.3374–$0.3465. In this case, consider reassessing the position.
📢 Market Context: The rise of BYBIT:FARTCOINUSDT.P may be supported by the overall positive sentiment in the crypto market. As of March 19, 2025, BYBIT:BTCUSDT.P is trading steadily above $90,000, creating a favorable backdrop for altcoins.
BYBIT:FARTCOINUSDT.P is showing strength and potential for growth on the 1H timeframe. A confirmed breakout above $0.3590 is your signal to act! We expect a move toward the $0.3660–$0.3790 levels.

#FARTCOINUSDT remains weak — expecting further downside📉 SHORT BYBIT:FARTCOINUSDT.P from $0.4570
🛡 Stop Loss: $0.4865
⏱ 1H Timeframe
✅ Overview:
➡️ BYBIT:FARTCOINUSDT.P remains under selling pressure, forming a downtrend. The price is testing the $0.4570 level, which previously acted as support, but the market remains weak.
➡️ POC (Point of Control) at $0.5449 indicates the main liquidity zone, far above the current price. This suggests seller dominance, with major trading activity still at higher levels.
➡️ A breakdown of $0.4570 would trigger further downside, opening the way to $0.4350 – $0.4168.
➡️ The $0.4168 level is a key support, where buyers previously showed interest.
⚡ Plan:
➡️ Enter SHORT from $0.4570 after confirming a breakdown.
➡️ Stop-Loss at $0.4865, placed above the nearest resistance.
➡️ Key downside targets: $0.4350 and $0.4168.
🎯 TP Targets:
💎 TP 1: $0.4350
🔥 TP 2: $0.4168
🚀 BYBIT:FARTCOINUSDT.P remains weak — expecting further downside!
📢 The market structure remains bearish. Volume continues to decline, confirming the weakening buying interest.
📢 However, a short-term bounce at $0.4168 is possible. If significant volume appears at this level, a brief return to $0.4350 could occur, but the overall movement remains downward.
📢 BYBIT:FARTCOINUSDT.P is in a bearish structure, and unless $0.4570 is reclaimed, we are likely to see further downside movement. A short-term bounce at $0.4168 is possible, but the overall trend remains weak.

Fartcoin is ready for bullish rallyFartcoin has swept previous liquidity with a daily candle sweep and closed above as green candle, now we need confirmation of 2nd candle closing above this liquidity sweep line as green then its a very good potential buying oppertnity.
