MGRCMonitor volume, increasing in volume indicates higher chances of short collection and thus, creating a short rally
Fbmklci


PARLONo huge dumping of shares yet, am expecting Parlo to test recent support before reaching 0.595, we'll see. Am using 1 hour chart to find solid structure. Am using no indicators. * volume is the key
Could fail if :
*there is a huge dumping of shares
*no reversal candle supported with big volumes ( could be reversal or huge retracement )
*no interference of political matters
*no interference of other systemic factors

EGNo solid structure yet, could be a repetition of Wyckoff cycle for rebound, could also be a distribution process, volume is the key here. Shall monitor volume at key levels .


TOPGLOV - Elliott Wave Correction before further rise to ATHEver since TOPGLOV recorded new high at RM29.30, gloves counter has experienced a big selloff which rebounded back and created a lower high.
Thus, I believe it has created a wave correction and heading to RM20 before flying to another ALL TIME HIGH. :)
As you all can see, AmInvestment Bank has downgraded gloves sector. The negative article in Bloomberg which featured comments of a few early investors/reader also added salt to the injury.
KOSSAN has delivered record quarterly profit in 2Q recently, not forgetting SUPERMX record profit are not enough to keep the market rising.
Perhaps, share price are fully prices are fully valued at the moment. There are many conflicting views emerging like vaccines.
It should all come down to earning and nothing else as TOPGLOV next quarter result will be releasing on 17th September 2020.
Would that be the moment that gloves counter back to GREEN?


FBM KLCI - Bearish Divergence FBMKLCI is closed at a new 7-month (2020) high at 1,611.42
However, the price is making a higher high (HH), but the Relative Strength Index is making a lower high (LH). This indicates the current market action is losing its momentum and weakening, meaning it could soon change direction.

KLCI - Masa kedua terbaik untuk membeli!Kemaskini KLCI : KLCI kini sudah jelas membuat pergerakkan 5 gelombang naik. Ini boleh jadi satu petanda awal bahawa KLCI sudah berjaya keluar dari bear market.
Secara kasar kelihatan pergerakkan 5 gelombang naik ini sudah lengkap, dan kini kita menantikan pergerakkan 3 gelombang kejatuhan yang bersifat korektif untuk berlaku pada bila bila masa sahaja.
Buat masa ini admin tidak menasihatkan pedagang Bursa di luar sana untuk agresif membeli, malah mungkin ia masa yang sesuai untuk mengambil keuntungan.
Bagi mereka yang sudah terlepas untuk membeli saham pada 18-22 Mac lepas, kejatuhan kali ini mungkin bakal menjadi peluang kedua buat anda!
Bagaimana pun, sekiranya kejatuhan ini membuat satu paras kerendahan yang baru melebihi paras rendah bulan Mac, ia bermaksud KLCI akan menghadapi satu bear market yang panjang dan teruk. Senario ini tidak berpotensi besar kerana Indeks serantau Asia dan Emmerging Market masih berada dalam pertengahan bull secara amnya.
Berlawanan dengan indeks indeks USA yang kelihatan sudah mencapai puncak bagi uptrend.
Abang Doji .

Vizione selling momentum decrease, possibly outbreakPossible outbreak on Vizione, price reach Uptrend Tunnel bottom
strong support at 0.405
Entry price : 0.43
1st TP : 0.5
2nd TP : 0.54
Cut Loss at : 0.4

fbmklci momentum decline, might pullback 1488For next week, we might see KLSE move slight high to 1620, but the momentum is declining, a fake up movement.
Most probably to see a pullback to 1488 next 2 weeks.

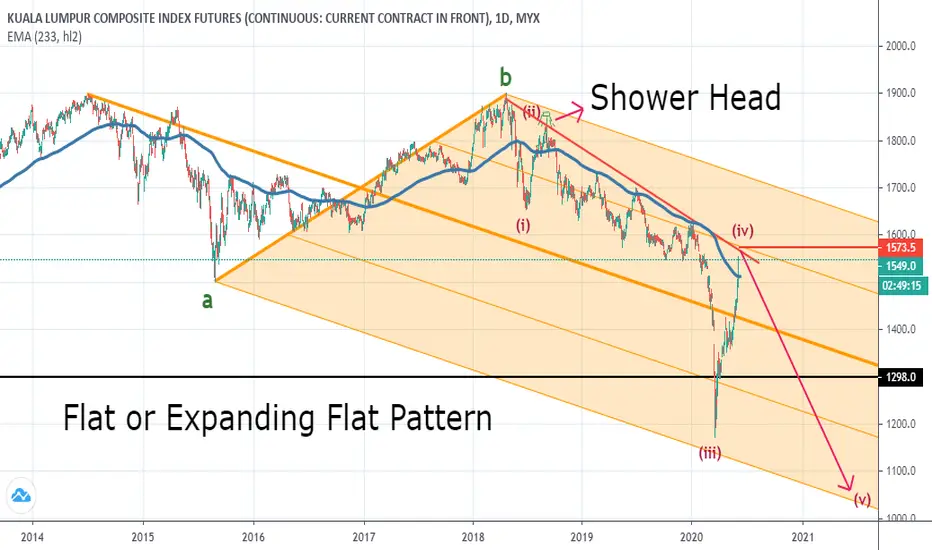
The first life-time major bear market for Malaysia stock market.Based on the chart pattern available and my best knowledge on applying Elliott Wave Principle, I'm currently seeing FBMKLCI undergoing its first big major bear market.
Based on currently available information, the 1998 financial crisis decline is best counted as A-B-C decline correction, and the subsequent rally from 1998 bottom to 2018 top is best intepreted as a multi-year expanding ending diagonal.
What we are witnessing currently is the unfolding of multi-year (potentially multi decade) bear market decline of larger degree/magnitude than Asian Financial Crisis and Subprime Mortage Crisis.
My view may change with time as more pieces of the puzzle are available.

An overdone bear rally that shall end soonFTSEMYX:FBMKLCI
Due to unprecendented market intervention by various central banks, we are witnessing an increasingly volatile market. Gone are the days where market moves in orderly manner with orderly pullback in between.
Instead, corrective waves are exhibiting strong movements akin to impulsive moves.
Market can be imagined as having two throttles at extreme ends of bullish-neutral-bearish spectrum.
Instead of slow/gradual transition, market now switches gear swiftly to either bullish or bearish throttle, hence the dramatic moves and being coined as Kangaroo market. Excess of bullishness will breed dramatic sharp rebound that die suddenly when the 'long' boat is overloaded, ensued by excess bearishness for dramatic decline, which die suddenly when the 'short' boat is overloaded, rinse and repeat.
Despite the potential erratic moves, I'm extremely bearish biased for the moment, and expecting the dramatic up/down swing in the nett will yield (ugly) negative return to stock market in the long run.
In near term, I'm anticipating a dramatic decline in FBMKLCI, which will be widely regarded by everyone as a 'healthy' pullback/retracement from March low rally, followed by a strong sharp rebound which will be 'celebrated' widely as resumption of bull rally.
However, this decline followed by sharp rebound more likely will be the Wave 1 decline and Wave 2 rebound of an unfolding 5-waves decline in disguise.

FBMKLCI - are we looking at cup and handle pattern?I hope it is.
Next Monday mighty be the day for;
1. Slow stoch to cross up the fast
2. MACD histogram to change color towards divergence of line & signal
3. Breakout of cup handle
How about the extension of short-selling until of end of the year? Sounds like an extra "ummmmmpppphhh!" to the market.

The ONLY path after banning short selling is FLY Hi!Securities Commission (SC) of Malaysia, which has banned short selling on Bursa Malaysia, has further extended its date from June 30 to Dec 31, 2020
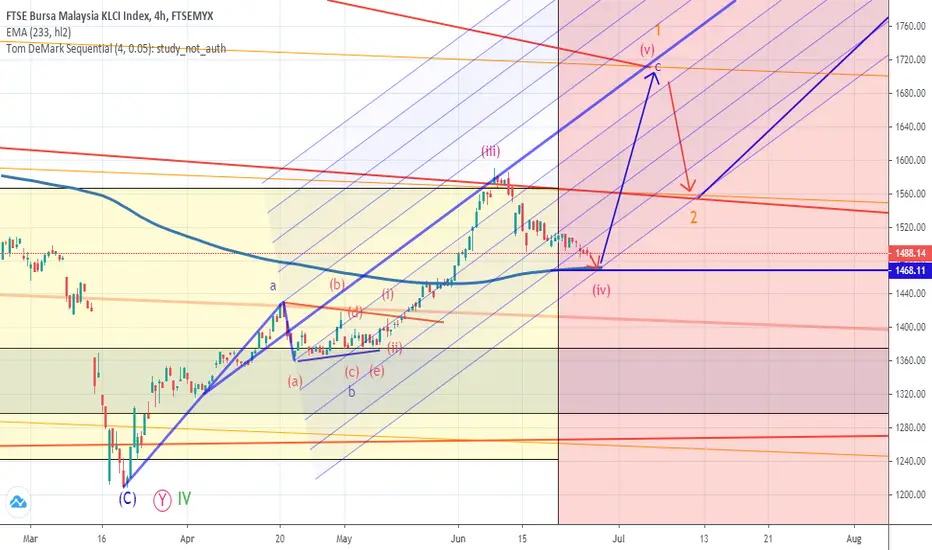

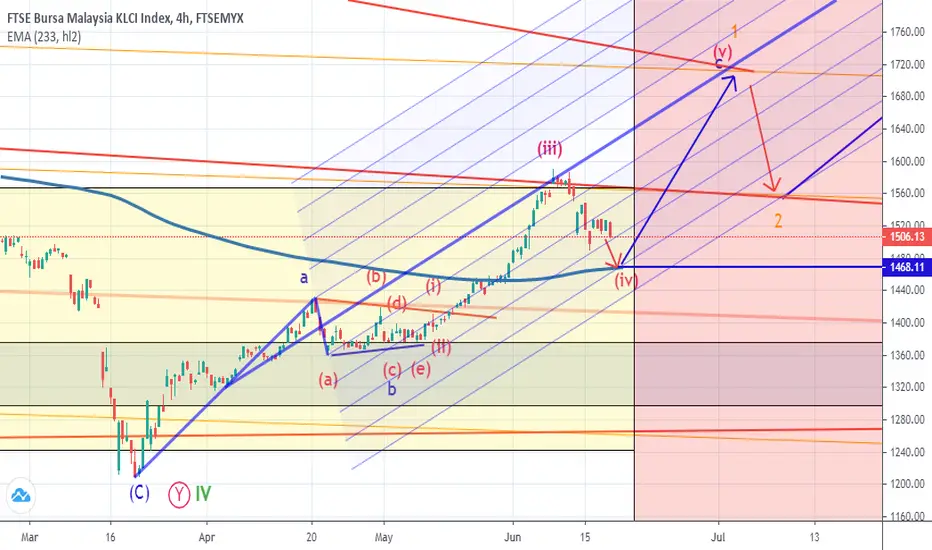
KLCI Future shortterm waves updated 18 June 2020Detail @ The Chart. p/s Inside any impulsive, there is ONLY abc waves not 1,2,3,4,5 waves.....


FBMKLCI Expected BULLRUNFBMKLCI forecast using Range Analysis.
Same range can be seen during recession on 98', 08' and 20'. Expected bull range based on previous bull range.
History tends to repeat itself.
Index expected to be bullish on the next +- 10 yrs.

