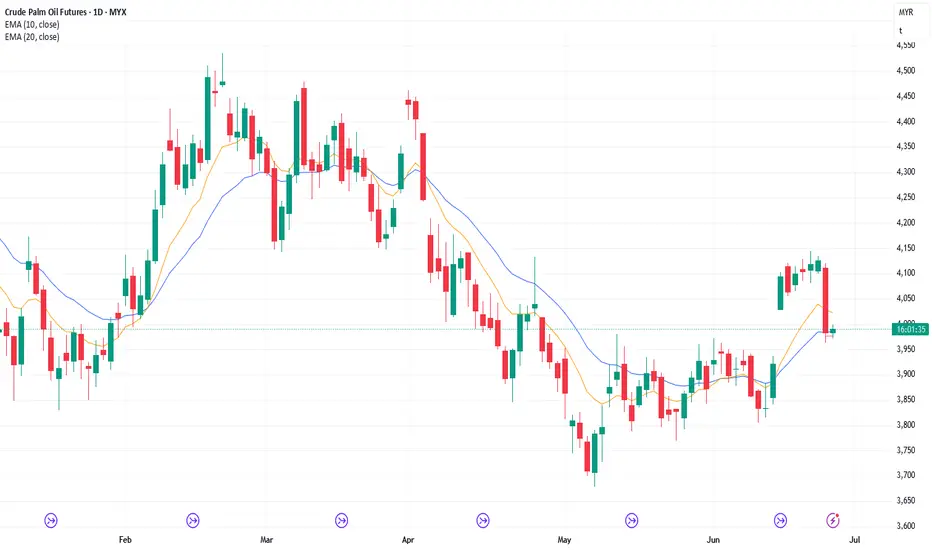
1/7/25 Tight Trading Range Around 20-Day EMA
Monday’s candlestick (Jun 30) was a small inside bull doji.
In our last report, we said traders would see if the bulls could create a follow-through bull bar closing near its high or if the market would trade lower, creating a more neutral or slightly bearish June monthly candlestick instead.
The market gapped down at the open but traded sideways to up. The monthly candlestick closed neutral to slightly bearish.
The bulls hope the 3980 breakout point area and the 20-day EMA will act as support. So far, the market is holding around this area.
They hope to get a retest of the Jun 20 high, even if it only forms a lower high.
They must create strong bull bars to show they are back in control.
The bears want the spike up (Jun 20) to form a major lower high (vs April). So far, this is the case.
They want a resumption of the broad bear channel and the third leg down with the first two legs being Jan 17 and May 8.
They see the last few days as a small pullback and want another strong leg down.
If the market trades higher, they want the follow-through buying to be weak, with overlapping candlesticks, and long tails above candlesticks. They want the Jun 26 high to be a resistance area, forming a double top bear flag.
They must create follow-through selling trading below the 20-day EMA to increase the odds of a resumption of the broad bear channel.
Production for July should be more or less around June's level.
Refineries' appetite to buy so far looks decent.
Export: Up 4% in June. To be seen in July.
So far, the market has consolidated sideways after the big spike down on Jun 24.
The small tight trading range formed in the last few days indicates the market is in an area of temporary balance.
The bulls must create consecutive strong bull bars to increase the odds of a retest of the Jun 20 high.
If the market remains sideways, the odds of a second leg sideways to down will increase as we move along into July.
For tomorrow (Tuesday, July 1), traders will see if the bulls can create a follow-through bull bar closing near its high. Or will any move up lack sustained follow-through buying, stalling below the July 26 high area?
Or will the bears be able to create another strong leg down in the days ahead instead?
Andrew
Fcpo

30/6/25 Monday to Influence Monthly Candlestick Close
Thursday’s candlestick (Jun 26) was a bull bar closing near its high.
In our last report, we said traders would see if the bears could create more follow-through selling, or if the market would form a pullback higher instead.
The market attempted twice to create follow-through selling intraday, but the moves lacked follow-through selling. The market closed higher for the day in relatively low momentum trading.
The bulls hope the 3980 breakout point area and the 20-day EMA will act as support. So far, the market is holding around this area.
They hope to get a retest of the Jun 20 high, even if it only forms a lower high.
They must create strong bull bars to show they are back in control.
The bears want the spike up to form a major lower high (vs April). So far, this is the case.
They want a resumption of the broad bear channel and the third leg down with the first two legs being Jan 17 and May 8.
If the market trades higher, they want the follow-through buying to be weak, with overlapping candlesticks, and long tails above candlesticks. They want it to form a lower high vs Jun 20.
They must create follow-through selling trading below the 20-day EMA to increase the odds of a resumption of the broad bear channel.
Production for June should be more or less around May's level. July should be more or less around June's level.
Refineries' appetite to buy so far looks decent.
Export: Looks decent in the first 25 days +6%
For tomorrow (Monday, Jun 30), traders will see if the bulls can create a follow-through bull bar closing near its high. If they can, the June monthly candlestick will close with a bigger bull body, which may increase the odds of July trading at least slightly higher.
Or will the market trade lower, creating a more neutral or slightly bearish June monthly candlestick instead?
Andrew

26/6/25 More FT Selling or Pullback higher?
Wednesday’s candlestick (Jun 24) was a bear bar closing near its low with a prominent tail above.
In our last report, we said traders would see if the bears could create more follow-through selling, and the move down was strong enough for traders to expect at least a small sideways to down leg after a small pullback.
The market formed a small pullback in the night and morning session followed by a small sideways to down leg to retest Tuesday's low in the afternoon.
The bulls hope the top of the 3980 breakout point area and the 20-day EMA will act as support.
They hope to get a retest of the Jun 20 high, even if it only forms a lower high.
They must create strong bull bars to show they are back in control.
The bears want the current move to form a major lower high (vs April) and a failed breakout above the trading range. So far, the market is reversing lower from a lower high.
They want a resumption of the broad bear channel and the third leg down with the first two legs being Jan 17 and May 8.
If the market trades higher, they want the follow-through buying to be weak, with overlapping candlesticks, and long tails above candlesticks. They want it to form a lower high vs Jun 20.
They must create follow-through selling trading below the 20-day EMA to increase the odds of a resumption of the broad bear channel.
Production for June should be more or less around May's level.
Refineries' appetite to buy so far looks decent.
Export: Looks decent in the first 25 days +6%
The market is trading higher in the night session.
For tomorrow (Thursday, Jun 25), traders will see if the bears can create more follow-through selling.
Or will the market form a pullback higher instead?
Andrew

25/6/25 Bears Need More Follow-through Selling
Tuesday’s candlestick (Jun 24) was a big bear bar closing near its low.
In our last report, we said traders would see if the bears can create sustained follow-through selling following the sell-off in the night session, or if the market would trade lower but find support around the 4030-50 area instead.
The market sold off sharply, and the breakout point and the 20-day EMA were tested.
The bulls hope the top of the 3980 breakout point area and the 20-day EMA will act as support.
They hope to get a retest of the Jun 20 high, even if it only forms a lower high.
They must create strong bull bars to show they are back in control.
The bears want the current move to form a major lower high (vs April) and a failed breakout above the trading range. So far, the market is reversing lower from a lower high.
They want a resumption of the broad bear channel and the third leg down with the first two legs being Jan 17 and May 8.
They must create more follow-through selling to increase the odds of a resumption of the broad bear channel.
Production for June should be more or less around May's level.
Refineries' appetite to buy so far looks decent.
Export: Looks strong in the first 25 days +5%
For tomorrow (Wednesday, Jun 25), traders will see if the bears can create more follow-through selling.
The move down is strong enough for traders to expect at least a small sideways to down leg after a small pullback.
Andrew
FCPO Week 26 2025: Bullish.Looking for price to fill up the gap below 4000 and after that expecting price to go higher and target the gap at around 4300. If price stays above 4300 then price would likely going to continue bullish.

24/6/25 Profit Taking, Bears Need FT Selling
Monday’s candlestick (Jun 23) was an inside bull bar closing near its high.
In our last report, we said traders would see if the bulls could create a strong breakout above the 4150 with sustained follow-through buying, or if the market would stall around the 4150 area followed by more profit-taking activity instead.
The market traded sideways for the day and there was no breakout above 4150.
Recently, the bulls got a measured move based on the height of the recent small trading range to the 4150 area.
The next target for the bulls is the 4200-50 area.
They must create a strong breakout above the Jun 17 high with follow-through buying to increase the odds of a sustained move towards the 4200-50 area.
The market is forming a pullback in the night session. If there is a deep pullback, the bulls want the 3980 breakout point area to act as support.
The bears want the current move to form a major lower high (vs April) and a failed breakout above the trading range.
They got a breakout below Monday's inside bar during the night session.
They must create a strong bear bar on Tuesday with follow-through selling on Wednesday to show they are back in control.
Production for June should be more or less around May's level.
Refineries' appetite to buy so far looks decent.
Export: Looks strong in the first 20 days +10%
For tomorrow (Tuesday, Jun 24), traders will see if the bears can create sustained follow-through selling following the sell-off in the night session.
Or will the market trade lower but find support around the 4030-50 area instead?
Andrew

23/6/25 Can Bulls Get a BO or Stall Around 4150?
Friday’s candlestick (Jun 20) was an outside bull doji closing slightly above the middle of its range.
In our last report, we said traders would see if the bulls could create a strong breakout above the 4150 with sustained follow-through buying, or if the market would stall around the 4150 area and profit-taking activity begins instead. Because of the 8-bar bull microchannel, buyers may be below the first pullback.
The market stalled around the 4150 area with profit-taking trading below Thursday's low. However, there were buyers below the first pullback and the market reversed off its low to close up for the day.
The bulls broke out above the small trading range with follow-through buying last week.
They got a measured move based on the height of the recent small trading range to the 4150 area.
The next target for the bulls is the 4200-50 area.
The move up is in a tight bull channel. The bulls are relatively stronger.
They must create a strong breakout above the Jun 17 high with follow-through buying to increase the odds of a sustained move towards the 4200-50 area.
The bears want the current move to form a major lower high (vs April) and a failed breakout above the trading range.
So far, the bears have not yet been able to create follow-through selling which indicates the bears are not yet strong.
They must create consecutive strong bear bars to show they are back in control.
Production for June should be more or less around May's level.
Refineries' appetite to buy so far looks decent.
Export: Looks strong in the first 20 days +10%
For tomorrow (Monday, Jun 23), traders will see if the bulls can create a strong breakout above the 4150 with sustained follow-through buying.
Or will the market stall around the 4150 area followed by more profit-taking activity instead?
Andrew

20/6/25 Buying Above 4150 or Profit Taking?
Thursday’s candlestick (Jun 19) was a small doji bar.
In our last report, we said traders would see if the bulls could create a strong breakout above the Jun 17 high with sustained follow-through buying, or if the market would stall around the Jun 17 high area instead.
The market traded slightly above the Jun 17 high but pulled back lower and traded mostly sideways.
The bulls got a breakout above the small trading range on Monday.
They want a measured move based on the height of the recent small trading range which will take the market to around the 4150 area. During Thursday night session (Jun 19), the market continued higher and is just a few ticks away from 4150.
The next target for the bulls is the 4200-50 area.
The bulls have an 8-bar bull microchannel which means persistent buying. The bulls are relatively stronger.
They must create a strong breakout above the Jun 17 high with follow-through buying to increase the odds of a sustained move towards the 4200-50 area.
The bears want the current move to form a major lower high (vs April) and a failed breakout above the trading range.
So far, the bears have not yet been able to create follow-through selling which indicates the bears are not yet strong.
They must create consecutive strong bear bars to show they are back in control.
Production for June should be more or less around May's level.
Refineries' appetite to buy so far looks decent.
Export: Looks strong in the first 20 days +10%
For tomorrow (Friday, Jun 20), traders will see if the bulls can create a strong breakout above the 4150 with sustained follow-through buying.
Or will the market stall around the 4150 area and profit-taking activity begins instead?
Because of the 8-bar bull microchannel, buyers may be below the first pullback.
Andrew

19/6/25 - Bulls Need Strong Breakout Above Jun 17 High
Wednesday’s candlestick (Jun 18) was an inside bull bar closing in its upper half.
In our last report, we said traders would see if the bulls could create follow-through buying over the next several days, or if the bears would get a follow-through bear bar instead.
The market traded slightly higher and the bears could not get a follow-through bear bar.
The bulls got a breakout above the small trading range on Monday.
They want a measured move based on the height of the recent small trading range which will take the market to around the 4150 area.
They see Tuesday simply as a pullback after a big move.
If the price does not trade below Jun 18's low, the market could still form a bull microchannel.
They must create a strong breakout above the Jun 17 high with follow-through buying to increase the odds of a sustained move.
The bears see the current move as a deep pullback.
They want it to form a major lower high (vs April) and a failed breakout above the trading range.
They were not able to create a follow-through bear bar today which indicates the bears are not yet strong.
They must create consecutive strong bear bars to increase the odds of a failed breakout.
Production for June should be more or less around May's level.
Refineries' appetite to buy so far looks decent.
Export: Looks strong in the first 15 days +25%
For tomorrow (Thursday, Jun 19), traders will see if the bulls can create a strong breakout above the Jun 17 high with sustained follow-through buying.
Or will the market stall around the Jun 17 high area instead? If this continues to be the case, the odds of a pullback will increase after that.
Andrew

18/6/25 Bulls Need FT Buying, Bears Want FT Bear Bar
Tuesday’s candlestick (Jun 17) opened higher but closed as a bear bar near its low.
In our last report, we said traders would see if the bulls could create follow-through buying over the next several days, or if the market traded down and lacked follow-through buying instead. If this is the case, it will indicate the bulls are not yet strong.
The market traded higher but closed as a bear bar. The bulls did not get a follow-through bull bar.
The bulls got a breakout above the small trading range on Monday.
They want a measured move based on the height of the recent small trading range which will take the market to around the 4150 area.
They see Tuesday simply as a pullback after a big move. They would have preferred to get a follow-through bull bar or even just a bull doji to indicate some follow-through buying.
But it was not the case which indicates the bulls are not yet as strong as they hope to be.
However, if the price does not trade below Jun 17's low, the market could still form a bull microchannel.
At the least, they want a retest of the Jun 17 high, even if it only forms a lower high.
They must create follow-through buying over the next few days to increase the odds of a sustained move.
If there is a pullback, they want it to be weak and sideways.
The bears see the current move as a deep pullback.
They want it to form a major lower high (vs April) and a failed breakout above the trading range.
They must create strong bear bars to increase the odds of a failed breakout.
Production for June should be more or less around May's level.
Refineries' appetite to buy so far looks decent.
Export: Looks strong in the first 15 days +25%
For tomorrow (Wednesday, Jun 18), traders will see if the bulls can create follow-through buying over the next several days. If they can, that will increase the odds of a more sustained move.
Or will the bears get a follow-through bear bar instead? If this is the case, it will indicate the bulls' case is not as strong as they hope for.
Andrew

17/6/25 Bulls Need FT Buying to Confirm the Breakout
Monday’s candlestick (Jun 16) was a bull bar closing near its high and breaking out above the trading range.
In our last report, we said the market would likely open higher. Traders would see if the bulls could close the day as a bull bar above the 4000 level, or if the market opens higher, but lacks follow-through buying, closing the day with a bear body with a long tail above.
The bulls got a strong bull bar following the big gap up.
The bulls got a reversal from a wedge bull flag (May 16, May 26, and Jun 11).
They want a breakout above the 4000 high followed by a measured move based on the height of the recent small trading range which will take the market to around the 4150 area.
They must create follow-through buying over the next few days to increase the odds of a sustained move.
If there is a pullback, they want it to be weak and sideways. They want a retest of the Jun 17 high, even if it only forms a lower high.
The bears see the current move as a deep pullback.
They want it to form a major lower high (vs April) and a failed breakout above the trading range.
They must create strong bear bars to increase the odds of a failed breakout.
Production for June should be more or less around May's level.
Refineries' appetite to buy so far looks decent.
Export: Looks strong in the first 15 days +25%
For tomorrow (Tuesday, Jun 17), traders will see if the bulls can create follow-through buying over the next several days. If they can, that will increase the odds of a more sustained move.
Or will the market trade down and lack follow-through buying? If this is the case, it will indicate the bulls are not yet strong.
Andrew

16/6/25 Bulls Need Strong Follow-through Buying on Monday
Friday’s candlestick (Jun 13) was a bull bar closing near its high and above the 20-day EMA.
In our last report, we said traders would see if the bears could create another follow-through bear bar, or if the market stalls again and form a bull bar trading above the 20-day EMA in the next few days instead.
The market stalled again and formed a bull bar closing above the 20-day EMA.
The bears want a reversal from a wedge bear flag (April 25, May 14, and Jun 3) and a double top bear flag (May 14 and Jun 3). They see another smaller wedge bear flag (May 29, Jun 3, and Jun 9).
The problem with the bear's case is that the follow-through selling below the 20-day EMA has been limited. The bears are not yet strong.
They must create strong bear bars to show they are back in control.
The bulls want a reversal from a wedge bull flag (May 16, May 26, and Jun 11).
They want the market to reverse above the 20-day EMA. So far, the market has done so.
They want a breakout above the 4000 high followed by a measured move based on the height of the recent small trading range which will take the market to around the 4150 area.
The 4030 area could also be an area of resistance (weekly 20-day EMA).
Production for June should be more or less around May's level. It could be slightly lower even. Sppoma's first 10 days are down -16%, but could be due to the Hari Raya Haji holiday.
Refineries' appetite to buy so far looks decent.
Export: Looks strong in the first 10 days +25-30%
For tomorrow (Monday, Jun 16), the market will likely open higher. Traders will see if the bulls can close the day as a bull bar above the 4000 level.
Or will the open higher, but lack follow-through buying, closing the day with a bear body with a long tail above? If this is the case, it will indicate the bulls are not yet strong.
Andrew

13/6/25 Can Bears Create Bear Bars or Stall Again?
Thursday’s candlestick (Jun 12) was a doji bar closing in its lower half with a long tail below.
In our last report, we said traders would see if the bears could create another follow-through bear bar, or if the market would stall and form a bull bar trading above the 20-day EMA in the next few days instead. Poor follow-through and frequent reversals are hallmarks of trading ranges.
The market stalled and traded above Wednesday's high, but reversed again to close as a doji bar (unchanged).
The bears want a reversal from a wedge bear flag (April 25, May 14, and Jun 3) and a double top bear flag (May 14 and Jun 3). They see another smaller wedge bear flag (May 29, Jun 3, and Jun 9).
They see Thursday as a pullback and want another leg down breaking below Jun 11 low.
They must continue to create follow-through selling below the 20-day EMA to increase the odds of a strong leg down.
The bulls want a reversal from a wedge bull flag (May 16, May 26, and Jun 11).
They want the market to reverse above the 20-day EMA and the current bear leg to have poor follow-through selling.
The market tested the 20-day EMA today but the follow-through buying was limited. The bulls need to create strong bull bars to show they are back in control.
If the market trades lower, they want the June 11 or June 10 lows to act as support.
Production for June should be more or less around May's level. It could be slightly lower even. Sppoma's first 10 days are down -16%, but could be due to the Hari Raya Haji holiday.
Refineries' appetite to buy so far looks decent.
Export: Looks strong in the first 10 days +25-30%
For tomorrow (Friday, Jun 13), traders will see if the bears can create another follow-through bear bar.
Or will the market stall again and form a bull bar trading above the 20-day EMA in the next few days instead?
The market has been in a trading range in the last 22 trading days. Traders could Buy Low, and Sell High within the trading range until there is a strong breakout from either direction.
Andrew

12/6/25 Can Bears Create More FT Selling or Stall?
Wednesday’s candlestick (Jun 11) was a bear bar closing below the middle of its range with a prominent tail below.
In our last report, we said traders would see if the bears can create a follow-through bear bar, or if the bulls could create a bull bar closing above the 20-day EMA.
The market formed a follow-through bear bar but the prominent tail below indicates some profit-taking activity.
The bears want a reversal from a wedge bear flag (April 25, May 14, and Jun 3) and a double top bear flag (May 14 and Jun 3). They see another smaller wedge bear flag (May 29, Jun 3, and Jun 9).
They must continue to create follow-through selling below the 20-day EMA to increase the odds of a strong leg down.
The bulls want a reversal from a wedge bull flag (May 16, May 26, and Jun 11).
They want the May 30 or May 26 lows area to act as support. They want the market to reverse above the 20-day EMA.
They want the current move to have poor follow-through selling.
They must create consecutive bull bars closing near their highs to show they are back in control.
Production for June should be more or less around May's level. Could be slightly lower even. Sppoma's first 10 days are down -16%, but could be due to the Hari Raya Haji holiday.
Refineries' appetite to buy so far looks decent.
Export: Looks strong in the first 10 days +25-30%
For tomorrow (Thursday, June 12), traders will see if the bears can create another follow-through bear bar.
Or will the market stall and form a bull bar trading above the 20-day EMA in the next few days instead?
Poor follow-through and frequent reversals are hallmarks of trading ranges.
The market has been in a trading range in the last 21 trading days. Traders could Buy Low, and Sell High within the trading range until there is a strong breakout from either direction.
Andrew

11/6/26 Close Below 20-day EMA, Bears Need FT Selling
Tuesday’s candlestick (Jun 10) was a decent-sized bear closing near its low and below the 20-day EMA.
In our last report, we said traders would see if the bears can maintain the candlestick as a bear bar, or if the bulls could create a reversal to close the day as an outside bull bar.
The market opened higher in the morning but there was no follow-through buying. The market sold off persistently for the day.
The bears want a reversal from a wedge bear flag (April 25, May 14, and Jun 3) and a double top bear flag (May 14 and Jun 3). They see another smaller wedge bear flag (May 29, Jun 3, and Jun 9).
They must create strong bear bars trading below the 20-day EMA to increase the odds of another strong leg down.
Since today's candlestick closed below the 20-day EMA, they need to create a follow-through bear bar to increase the odds of the leg resuming, something they couldn't do on May 30.
The bulls want a reversal from a wedge bull flag (May 16, May 26, and Jun 11). They see the market creating a double bottom bull flag (May 30 and Jun 11).
They want the 20-day EMA or the May 30 low area to act as support. They want the market to reverse above the 20-day EMA.
Production for June should be more or less around May's level.
Refineries' appetite to buy so far looks decent.
Export: Looks strong in the first 10 days +25-30%
For tomorrow (Wednesday, June 11), traders will see if the bears can create a follow-through bear bar.
Or will the bulls be able to create a bull bar closing above the 20-day EMA?
The market has been in a tight range in the last 10 days. Traders could Buy Low, and Sell High within the trading range until there is a strong breakout from either direction.
Andrew

10/6/25 Bear Bar Below 20-Day EMA or Outside Bull Bar?
Monday’s candlestick (Jun 9) was a small bear doji.
In our last report, we said traders would see if the bulls could create a bull entry bar testing near the Jun 3 high area, or if the bears would get another attempt to close below the 20-day EMA.
The market traded above Friday's high but the bulls did not get a strong bull entry bar. In the night session currently, the market formed another retest of the 20-day EMA.
The bears want a reversal from a wedge bear flag (April 25, May 14, and Jun 3) and a double top bear flag (May 14 and Jun 3). They see another smaller wedge bear flag (May 29, Jun 3, and Jun 9).
They must create strong bear bars trading below the 20-day EMA to increase the odds of another strong leg down.
They want tomorrow to close as a strong bear bar below the 20-day EMA.
The bulls want a reversal from a wedge bull flag (May 16, May 26, and May 30). They see the market creating a double bottom bull flag (May 30 and Jun 6) or a wedge bull flag (May 30, Jun 6, and Jun 10).
They want the 20-day EMA to act as support, forming higher lows.
They want a breakout above the 4000 high followed by a measured move based on the height of the recent small trading range which will take the market to around the 4150 area.
The 4030 area could also be an area of resistance (weekly 20-day EMA).
They want the market to form an outside bull bar closing near its high tomorrow.
Production for June should be more or less around May's level.
Refineries' appetite to buy so far looks decent.
Export: Rumored to be strong in the first 10 days +25-30%
For tomorrow (Tuesday, June 10), traders will see if the bears can maintain the candlestick as a bear bar (since the market has traded below Monday's low).
Or will the bulls be able to create a reversal to close the day as an outside bull bar? If this is the case, the market could attempt to break out above the 4000 level after that.
The market is about balanced for the bulls and bears, and neither side has a significant edge yet.
Andrew

9/6/5 20-Day EMA Holding as Support So Far
Friday’s candlestick (Jun 6) was a doji bar closing slightly above the middle of its range.
In our last report, we said traders would see if the bears could create a follow-through bear bar closing below the 20-day EMA, or if the bulls could create a bull bar reversing higher instead like June 3.
The market opened higher during the day's session but reversed below the June 5 low and the 20-day EMA. However, the follow-through selling was limited and the market reversed to close unchanged.
The bears could not create a follow-through bear bar below the 20-day EMA.
The bears want a reversal from a wedge bear flag (April 25, May 14, and Jun 3) and a double top bear flag (May 14 and Jun 3).
The doji bar on Friday disappointed the bears as they could not create strong follow-through selling closing below the 20-day EMA.
They must create strong bear bars trading below the 20-day EMA to increase the odds of another strong leg down.
The bulls want a reversal from a wedge bull flag (May 16, May 26, and May 30). They see the market creating a double bottom bull flag (May 30 and Jun 6).
They want the 20-day EMA to act as support, forming higher lows. So far, this is still the case (May 30 and Jun 6).
They want a breakout above the 4000 high followed by a measured move based on the height of the recent small trading range which will take the market to around the 4150 area.
The 4030 area could also be an area of resistance (weekly 20-day EMA).
They must create follow-through buying above the 20-day EMA and breaking above the May 14 high to increase the odds of a reversal.
Production for June should be more or less around May's level.
Refineries' appetite to buy so far looks decent.
Export: Remain to be seen.
For tomorrow (Monday, June 9), traders will see if the bulls can create a bull entry bar testing near the Jun 3 high area.
Or will the bears get another attempt to close below the 20-day EMA?
The market is about balanced for the bulls and bears, and neither side has a significant edge yet.
Andrew

FCPO Week 24 2025: Bullish.I'm expecting price to break 4000 next. If not then it will continue in consolidation mode. There is a little resistance at 4000 level but price should have enough to move higher to possible even touch 4200. Happy trading.

6/6/25 - FT Bear Bar or No FT Selling like Jun 3?
Thursday’s candlestick (Jun 5) was a bear bar closing near its low with a small tail below.
In our last report, we said traders would see if the bulls could continue to create follow-through buying above the 20-day EMA, or if the bears would be able to develop bear bars trading back below the 20-day EMA in the next few days instead.
The market traded lower for the day testing the 20-day EMA, but did not close below it.
The bulls want a reversal from a wedge bull flag (May 16, May 26, and May 30).
They want the 20-day EMA to act as support, forming a higher low. They see the market creating a double bottom bull flag (May 30 and Jun 5).
They want a breakout above the 4000 high followed by a measured move based on the height of the recent small trading range which will take the market to around the 4150 area.
They must create follow-through buying above the 20-day EMA and breaking above the May 14 high to increase the odds of a reversal.
They want tomorrow to close with a bull body, creating poor follow-through selling for the bears (like Jun 3).
The bears want a reversal from a wedge bear flag (April 25, May 14, and Jun 3) and a double top bear flag (May 14 and Jun 3).
They hope the May 14 high area (around 4000) will act as resistance.
They managed to create a bear bar testing the 20-day EMA today.
They must create a follow-through bear bar closing below the 20-day EMA to increase the odds of another strong leg down.
Production for June should be more or less around May's level.
Refineries' appetite to buy so far looks decent.
Export: Remain to be seen.
For tomorrow (Friday, June 6), traders will see if the bears can create a follow-through bear bar closing below the 20-day EMA.
Or will the bulls be able to create a bull bar reversing higher instead like June 3?
Andrew

5/6/25 Bulls Need To Create Strong Bull Bars, No FT Selling Yet
Wednesday’s candlestick (Jun 4) was a bear bar doji closing in its upper half with a long tail below.
In our last report, we said traders would see if the bulls could continue to create follow-through buying above the 20-day EMA, or if the bears would be able to develop bear bars trading back below the 20-day EMA in the next few days instead.
The market gapped down during the day session but the follow-through selling was limited, closing the day in its upper half. The bulls got some follow-through buying albeit weak.
The bulls want a reversal from a wedge bull flag (May 16, May 26, and May 30).
They want the 20-day EMA to act as support, forming a higher low and a wedge bull flag (with the first two legs being the May 16 and May 26 lows). So far, this is the case.
They want a breakout above the 4000 high followed by a measured move based on the height of the recent small trading range which will take the market to around the 4150 area.
They must create follow-through buying above the 20-day EMA and breaking above the May 14 high to increase the odds of a reversal.
The bears want a reversal from a wedge bear flag (April 25, May 14, and Jun 3) and a double top bear flag (May 14 and Jun 3).
They hope the May 14 high area (around 4000) will act as resistance.
They attempted to create a reversal in the last 2 days but both times the follow-through selling was limited.
They must create bear bars trading below the 20-day EMA to increase the odds of another strong leg down.
Production for June should be more or less around May's level.
Refineries' appetite to buy so far remains to be seen.
Export: Remain to be seen.
For tomorrow (Thursday, June 5), traders will see if the bulls can continue to create follow-through buying above the 20-day EMA. If they can create a strong breakout above the 4000 area, the odds of a measured move up to around 4150 will increase.
Or will the bears be able to create bear bars trading back below the 20-day EMA in the next few days instead?
The market dynamic for tomorrow is about the same as Wednesday.
Andrew
3/6/25 Surprise Gap Up, Bulls Need Follow-through Buying
Tuesday’s candlestick (Jun 3) was a bear bar doji closing in its lower half with a long tail above.
In our last report, we said traders would see if the bears could create a follow-through bear bar, or if the market would trade slightly lower, but close with a long tail below or with a bull body instead.
The market gapped up at the open and traded significantly higher but reversed to close in its lower half by the end of the day.
The bulls want a reversal from a wedge bull flag (May 16, May 26, and May 30).
They want the 20-day EMA to act as support, forming a higher low and a wedge bull flag (with the first two legs being the May 16 and May 26 lows). So far, this is the case.
They want a breakout above the 4000 high followed by a measured move based on the height of the recent small trading range which will take the market to around the 4150 area.
They must create follow-through buying above the 20-day EMA and breaking above the May 14 high to increase the odds of a reversal.
The bears want a reversal from a wedge bear flag (April 25, May 14, and Jun 3) and a double top bear flag (May 14 and Jun 3).
They hope the May 14 high area (around 4000) will act as resistance.
They must create bear bars trading below the 20-day EMA to increase the odds of another strong leg down.
Production for June should be more or less around May's level.
Refineries' appetite to buy in recent days seems ok.
Export: Remain to be seen.
For tomorrow (Wednesday, June 4), traders will see if the bulls can continue to follow-through buying above the 20-day EMA. If they can create a strong breakout above the 4000 area, the odds of a measured move up to around 4150 will increase.
Or will the bears be able to create bear bars trading back below the 20-day EMA in the next few days instead?
Andrew

FCPO WEEK 23 2025: Bullish Potential.Price hold support steadily even though still failed to make any move higher. It seems that 3700 is a support area for now. There are two possibilities this week:
#1 - We might see consolidation this week and price might move sideways.
#2 - Price to retrace a bit and then make a breakout towards 4000. This would be ideal and the best scenario.
Happy trading!

3/6/25 - Can Bears Create a Strong FT Bear Bar or Not?
Friday’s candlestick (May 30) was a bear bar closing in its lower half with a prominent tail below.
In our last report, we said traders would see if the bulls could create a retest of the May 29 high, even if it only forms a lower high, or if the market would reverse below the 20-day EMA again, like the previous two times (May 15 and May 21). If so, especially if it is strong, we may get a retest of the May 26 low in the coming days.
The market formed a bear bar trading below the 20-day EMA but the prominent tail below indicates some hesitation from the bears.
The bulls want a reversal from a double bottom bull flag (May 16 and May 26) and a wedge bear flag (May 16, May 26, and May 30).
They want the 20-day EMA or the May 26 low to act as support, forming a higher low and a wedge bull flag (with the first two legs being the May 16 and May 26 lows).
They must create strong bull bars trading above the 20-day EMA to increase the odds of a reversal.
The bears want a reversal from a wedge bear flag (April 25, May 14, and May 29).
They must create follow-through selling trading below the May 26 low to increase the odds of another strong leg down.
Production for June should be more or less around May's level.
Refineries' appetite to buy in recent days seems ok.
For tomorrow (Tuesday, June 3), traders will see if the bears can create a follow-through bear bar.
Or will the market trade slightly lower, but close with a long tail below or with a bull body instead?
Andrew
