Fcpo

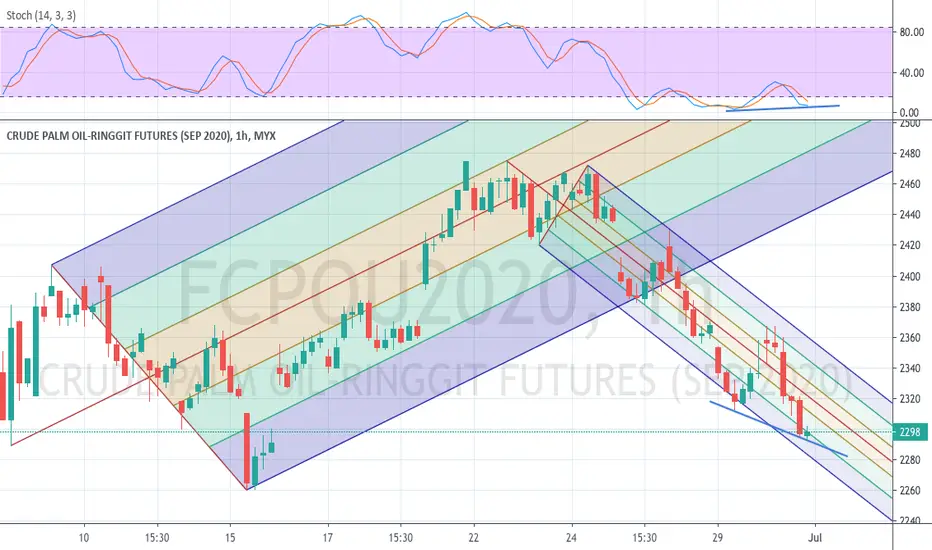
FCPO Long if retrace confirmFCPO try to make a divergence. Maybe can Long to take some profit but still in downtrend mode.
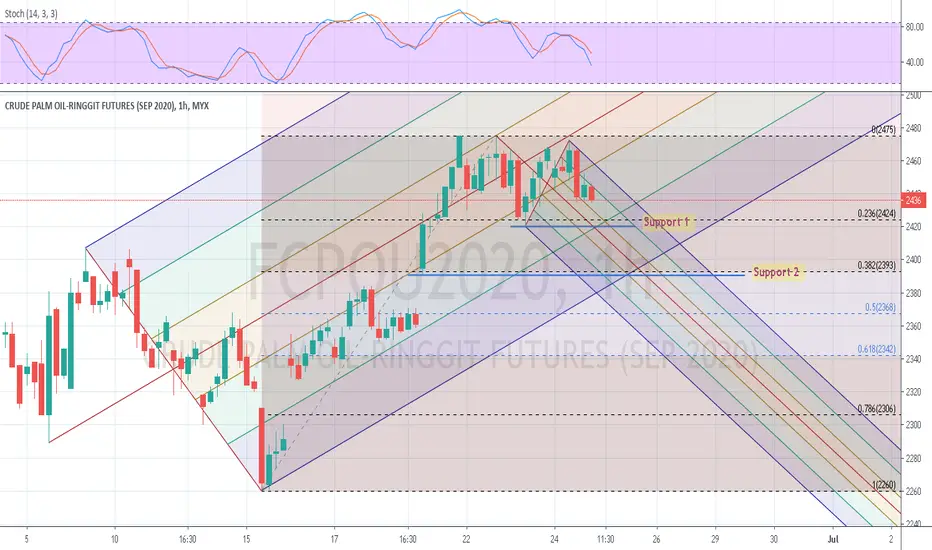
June25 - CPO (1D) - UTL violated, Nearest Support 230x-3x...Thursday June25 gap down violated Daily UTL... 👇🏻
Momentum weakness, look to S1 as potential first support zone.
Important Levels to Watch:
R2: ~246x
R1: 240x-2x
S1: 240x-3x
S2: 220x-2x
Happy Hunting! 💰🚀
-JK- MyTradingSpace


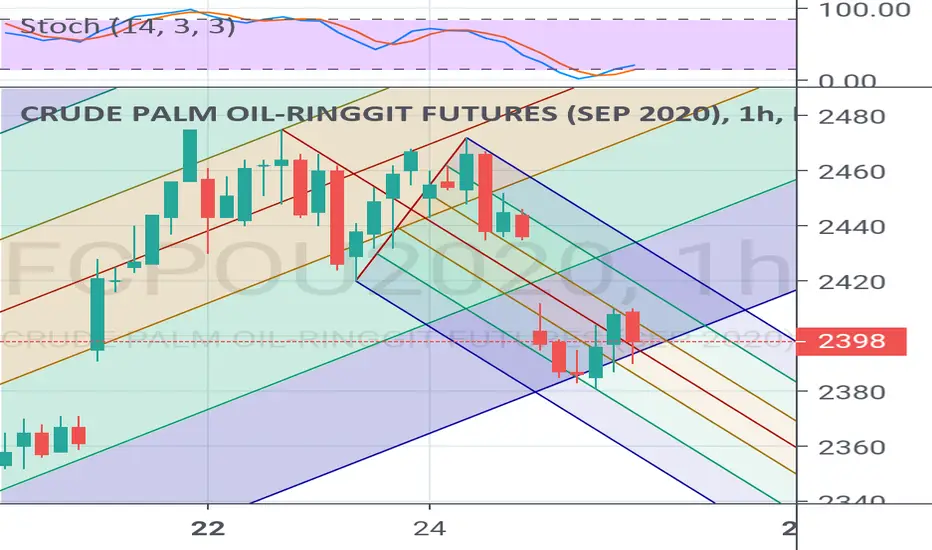
FCPO - Bearish Deep CrabA bearish Deep Crab formed on the M30 TF. Currently the price is still within the potential reversal zone (Blue Box), it might retest the price of MYR 2352.
Oscillator indicator does not indicate overbought zone yet. We shall wait for overbought indication and the price action behave in the blue box. A sell opportunity once the price rejected out of the blue box with OB & PA exhaustion.
Stops: MYR 2353
Potential Reversal Zone: MYR 2450 - MYR 2496
TP1: MYR 2406
TP2: MYR 2363
In higher TF (Daily, Weekly), the price is still upward biased. It's a pull back opportunity and I shall look forward for price to respect the projection mentioned above.


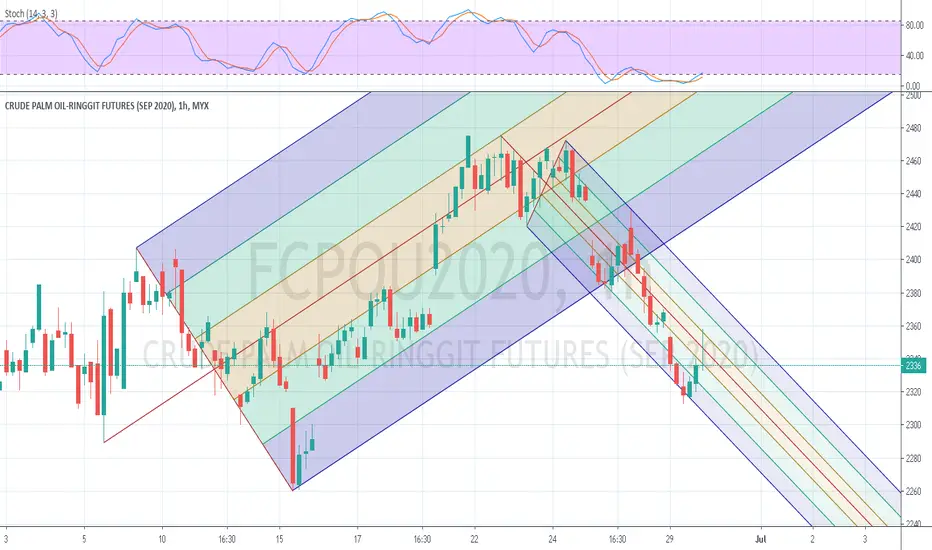
finally, a breakout...fcpo finally gave a breakout on last friday, breaking through the immediate resistance frm 2400-2420...uptrend continues
resistance : 2470
next level resistance : 2580- 2600
support level : 2440
lower support level : 2400 - 2420
pls give a like and follows, thx

next betting .. against the trend & momentum FCPO! just wild guess with baseless argument ...
disclaimer mode on
short selling addict ....


checking the trend using MA linenormally, I dun use indicator as buying or selling signal...juz use them as tools to check trend...try this one, Moving Average-200 day for checking fkli daily chart...SMA works better, but this one juz fine...
EMA normally goes with lower timeframe....
leave me a message if I were wrong...
look like the bull and bear are still playing "tug-of-war" between them...1514 is the immediate support level where the SMA-200 falls into...

sideway tradingsideway since 3rd June 2020...market more bias to trending to the downside, but as long as the competition of bull and bear has not shown any edge over the other, sideway market will continue...
resistance level : 2380 -2420
support level : 2300 -2320
if you trade trend, this is the time you "die"...either by the untrending pattern or because of boredom...


a trading method called "2618" fkli"2618" means 2 tops or double tops, then follow by retracement back to 618...then usually a downtrend...
of course, this is juz a trading idea, no indication of buying or selling...
strong resistance : 1584-1600
current resistance : 1560
current support : 1500-1520

head and shoulder pattern in fcpo possible formation of "head-and-shoulder" pattern in fcpo hourly chart...
resistance : 2400 - 2420
support : 2300
lower support level : 2200

a breakout frm the fklicurrent resistance : 1584
current support : 1560
the latest support level is broken, then the idea is to short the market when rebound...
of course, this is juz a trading idea...

fcpo possible reversal or formation of the "head"current resistance : 2400-2420
current support : 2300
lower support level : 2200
the price might come to a reversal region...

FCPO of FCPOIdea #1 : 1st Wave Extension
Expecting an expending or running flat is developing for wave 4 and a movement higher toward 2440 to complete this motive sequence.
Idea #2: Wave 5 expending ending diagonal triangle
We would like to see a strong movement toward 2160 area for this idea.

simple bracketing market again...FCPO active month
current resistance : 2300
current support : 2250
strong support : 2200-2210
waiting for a breakout
this is a trading journal, not recommendation of buying or selling
fcpo trading
