Fcpo


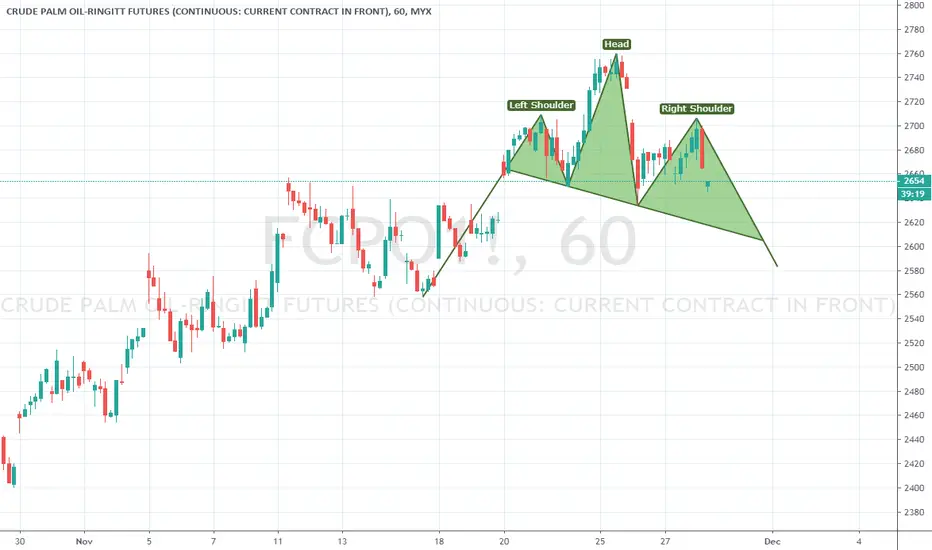
FCPO Reached The historical "Mean"The previous rally as mentioned in previous post have reached the pattern target 2773. Looking at the monthly chart, 2773 served as crucial support resistance for past 10 or more years. Reader please see arrow for self interpretation.


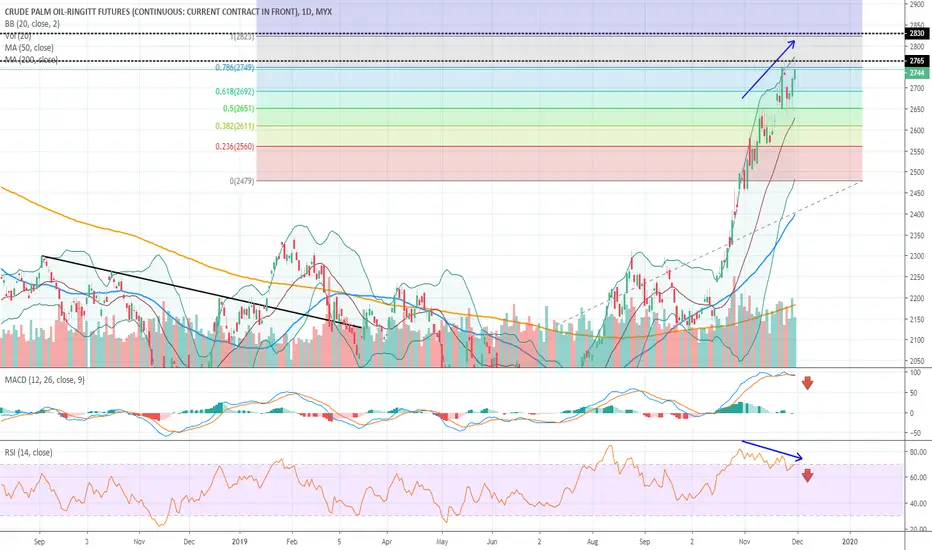
FCPO - Never Ending Game? Where To Short?FCPO
Trend: Bullish
Rst: 2,750
Spp: 2,692
Momentum still bullish but RSI bearish divergence is slowly taking shape and MACD has done bearish crossover. There's tendency to move southward soon.


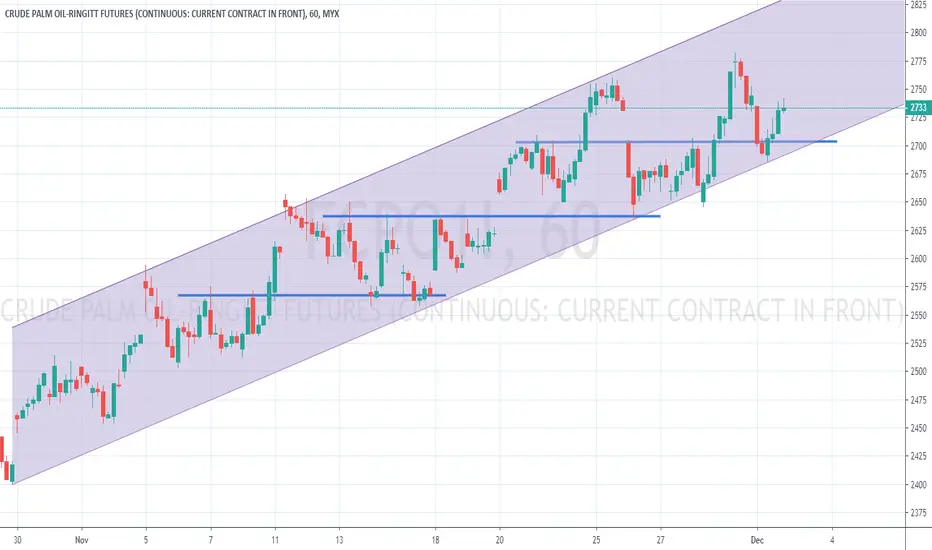
FCPO Wait and seePossible short if break uptrend pitchfork and trend line. But long if price reject at trend line or bottom line of uptrend pitchfork.


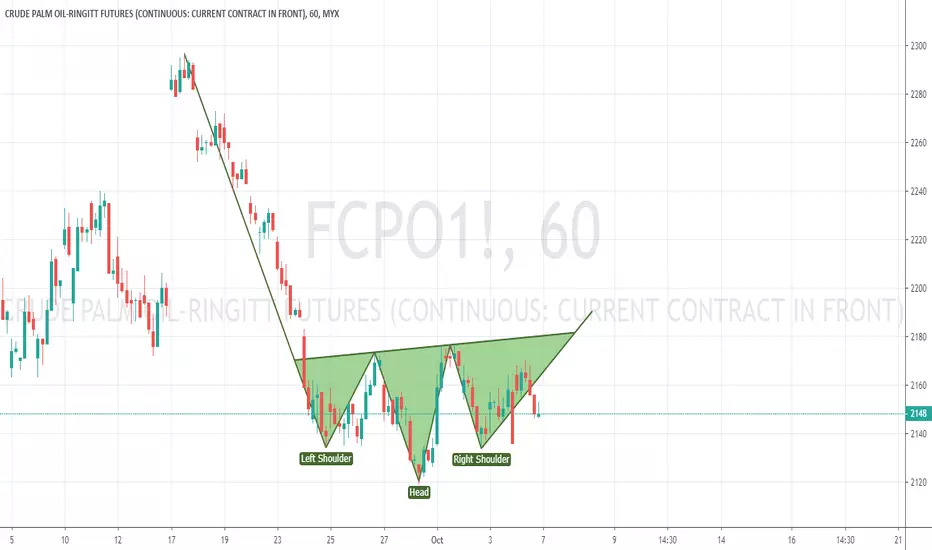


FCPOZ2019 movement prediction 30.9.2019Based on the latest 4 hour chart, I think the price will continue to move south to complete wave 3 if support at around 2134 is broken according to Dow Theory. If I draw my fibo ext correctly, next target should be around 2105.
Trade at your own risk.

