30/4/25 - Can Bears Get a Breakout with FT Selling? FCPO
Yesterday's candlestick (Apr 29) was a bear bar closing in its lower half with a small tail below.
In our previous report, we said traders will see if the bears can create a follow-through bear bar. If they do, it could lead to a retest and breakout attempt below the April 22 low.
The bears got a follow-through bear bar on Tuesday.
They want a retest of the recent leg low (Apr 22) followed by a strong breakout and a measured move based on the height of the 5-month trading range.
If there is a breakout below the April 22 low, the bears must create strong follow-through selling to increase the odds of a successful breakout.
The bulls want the current move to form a higher low (vs Apr 22) and a double bottom (Apr 22).
If the market trades below the April 22 low, they want a failed breakout and a reversal from a lower low major trend reversal.
As strong as the current selling is, the bulls see it as a sell vacuum and a bear leg within the trading range.
They hope the bottom of the trading range will act as support.
They must create strong bull bars to show they are back in control.
The selloff from April 2 to April 22 was strong enough for traders to expect at least a small sideways to down to retest the April 22 low. It is currently underway.
Traders will see the strength of the move. If strong, traders may expect a breakout attempt below the April 22 low. So far, the move appears strong.
The market formed another bear bar in the night market testing near the April 22 low (just 25 points away from the low).
For tomorrow (30/4/25), traders will see if the bears can create a retest and breakout attempt below the April 22 low. If there is a breakout, traders will see if there will be strong follow-through selling.
Or will Wednesday's candlestick close with a long tail below instead? If this is the case, it will indicate some profit-taking around the trading range low (3850 area).
The market remains in a large trading range (4500 - 3850). Traders may Buy Low and Sell High within the trading range.
That means buying in the lower third of the trading range, and selling in the upper third until there is a strong breakout from either direction with follow-through buying/selling.
Breakout from trading ranges can fail and odds slightly favor the trading range to continue.
Andrew
Fcpo

29/4/25 Can Bears Get FT Bear Bar or Fail to Do So? FCPO
Yesterday's candlestick (Apr 28) was a bear bar closing in its lower half with a prominent tail below.
In our previous report, we said traders would see if the bears can create a strong bear entry bar closing near its low, or if the market would trade slightly lower, but lack strong follow-through selling, closing the candlestick with a long tail below or a bull body instead.
The market gapped down and formed a strong bear entry bar.
The bears want a retest of the recent leg low (Apr 22) followed by a strong breakout and a measured move based on the height of the 5-month trading range (AFTER the pullback).
The bears must create a strong follow-through bear bar on Tuesday to increase the odds of a retest and breakout below the April 22 low.
If the market trades higher over the next several days, they want it to form a lower high (vs Apr 25), forming a double top bear flag.
The bulls want a larger second leg sideways to up after the current pullback.
They want the current move to form a higher low (vs Apr 22), a double bottom (Apr 22), and a higher low major trend reversal.
They want the current pullback to be weak, sideways and with poor follow-through selling.
The selloff from April 2 to April 22 was strong enough for traders to expect at least a small sideways to down to retest the April 22 low. It is currently underway.
Traders will see the strength of the move. If strong, traders may expect a breakout attempt below the April 22 low.
If it is weak, we may see more profit-taking from the bears moving forward, followed by a larger second leg sideways to up after that.
So far, the market gapped up in the night market and is an inside bull bar.
For tomorrow (29/4/25), traders will see if the bears can create a follow-through bear bar. If they do, it could lead to a retest and breakout attempt below the April 22 low.
Or will the market close as a bull bar instead? If this is the case, especially if it is a strong bull bar, it could lead to further profit-taking from the bears.
The market remains in a large trading range (4500 - 3850). Traders may Buy Low and Sell High within the trading range.
That means buying in the lower third of the trading range, and selling in the upper third until there is a strong breakout from either direction with follow-through buying/selling.
Andrew

28/5/25 - Can Bears Get a Strong Retest of the Low? FCPO
Friday's candlestick (Apr 25) was a bull doji closing in its lower half with a long tail above.
In our previous report, we said traders would see if the bulls could create another follow-through bull bar testing near the 20-day EMA, or if the market would trade slightly higher but stall around the 4050-4080 area or the 20-day EMA area and reverse lower, forming a retest of the April 22 low instead.
The market gapped up on Friday morning trading far above the 20-day EMA, but reversed to close below it.
The bears see the current move as a pullback following the climactic selloff and oversold conditions.
They want the 4050-80 area or the 20-day EMA to act as resistance.
They want at least a retest of the recent leg low (Apr 22) followed by a strong breakout and a measured move based on the height of the 5-month trading range (AFTER the pullback).
At the least, they want a small sideways to down leg to retest the April 22 low, even if it only forms a higher low.
The bears must create a strong follow-through bear bar on Monday to increase the odds of another leg down.
The bulls got a reversal from a wedge pattern (Mar 25, Apr 9, and Apr 22) and a lower low major trend reversal.
They hope to get a 2-legged pullback closing above the 20-day EMA.
The market traded above the 20-day EMA on Friday but reversed to close below it. The bulls are not yet as strong as they hoped to be.
If the market trades lower, they want it to form a higher low (vs Apr 22) and a double bottom (Apr 22) followed by a second leg sideways to up.
They want any retest of the April 22 low to be weak, sideways and with poor follow-through selling.
The bulls want a TBTL - Ten Bars, Two Legs pullback. That means they want a second leg sideways to up after a pullback.
The selloff from April 2 to April 22 was strong enough for traders to expect at least a small sideways to down to retest the April 22 low (AFTER the current pullback), even if it forms a higher low.
Perhaps we may see the retest of the April 22 low early next week.
If the market forms a retest of the April 22 low, traders will see the strength of the selling. If strong, traders may expect a breakout attempt below the April 22 low.
If it is weak, we may see more profit-taking from the bears moving forward, followed by a larger second leg sideways to up after that.
For tomorrow (28/4/25), traders will see if the bears can create a strong bear entry bar closing near its low.
Or will the market trade slightly lower, but lack strong follow-through selling, closing the candlestick with a long tail below or a bull body instead?
The market remains in a large trading range (4500 - 3850). Traders may Buy Low and Sell High within the trading range.
That means buying in the lower third of the trading range, and selling in the upper third until there is a strong breakout from either direction with follow-through buying/selling.
Andrew

FCPO Week 18 2025: 50-50.Last week price failed to make a new low but instead making a push higher. It might hint that the trend is shifting to bullish but at the current moment it is 50-50. A big bearish key reversal on Friday might indicate that bearish is not done yet. Furthermore look at the weekly candle. The upper and lower wicks are about the same length and the body is more or less in the middle. Next week price action in the 50-50 area might give a clue on where price will go next. However only a close higher or lower of the current high and low of the area will provide confirmation of the future price movement.

25/4/25 FCPO Can Bull Get A Strong Retest of The 20-Day EMA?
Yesterday's candlestick (Apr 24) was an inside bull doji.
In our previous report, we said traders would see if the bulls could create another follow-through bull bar testing near the 20-day EMA, or if the market would trade slightly higher but stall around the 4050-4080 area or the 20-day EMA and reverse lower, forming a retest of the April 22 low instead.
The market traded in a small range throughout the whole day.
The bears see the current move as a pullback following the climactic selloff and oversold conditions.
They want the 4050-80 area or the 20-day EMA to act as resistance.
They want at least a retest of the recent leg low (Apr 22) followed by a strong breakout and a measured move based on the height of the 5-month trading range (AFTER the pullback).
At the least, they want a small sideways to down leg to retest the April 22 low, even if it only forms a higher low.
The bulls see the recent selloff as a sell vacuum and a bear leg within the trading range.
They got a reversal from a wedge pattern (Mar 25, Apr 9, and Apr 22) and a lower low major trend reversal.
They hope to get a 2-legged pullback testing near the 20-day EMA. The move could be underway.
They must continue to create consecutive bull bars closing near their highs to increase the odds of a reversal.
If the market trades lower, they want it to form a higher low (vs Apr 22) and a double bottom (Apr 22) followed by a second leg sideways to up.
The market is currently forming a sideways to up pullback.
The bulls want a TBTL - Ten Bars, Two Legs pullback. That means they want any pullback to be minor followed by a second leg sideways to up after that.
The selloff from April 2 to April 22 was strong enough for traders to expect at least a small sideways to down to retest the April 22 low (AFTER the current pullback), even if it forms a higher low. Will it happen within the next few days?
If the market forms a retest of the April 22 low, traders will see the strength of the selling. If it is strong, traders may expect a breakout attempt below the April 22 low. If it is weak, we may see more profit-taking from the bears moving forward, followed by more sideways to up trading afterwards.
For tomorrow (25/4/25), traders will see if the bulls can create another follow-through bull bar testing near the 20-day EMA. So far in the night market, the candlestick is a small bull doji trading slightly higher for the day.
Or will the market trade slightly higher but stall around the 4050-4080 area or the 20-day EMA area and reverse lower, forming a retest of the April 22 low instead?
The market remains in a large trading range (4500 - 3850). Traders may Buy Low and Sell High within the trading range.
That means buying in the lower third of the trading range, and selling in the upper third until there is a strong breakout from either direction with follow-through buying/selling.
Andrew

24/4/25 FCPO Daily - Bull FT Bull Bar, or Retest of Apr 22 Low?
Yesterday's candlestick (Apr 23) was a big bull car closing in its upper half with a prominent tail below.
In our previous report, we said traders would see if the bulls can create a strong follow-through bull bar (it could start a 2-legged sideways to up pullback phase) or if the market would lack follow-through buying instead.
The market formed a strong follow-through bull bar testing the 4050-80 area.
The bears see the current move as a pullback following the climactic selloff and oversold conditions.
They want the 4050-80 area or the 20-day EMA to act as resistance.
They want at least a retest of the recent leg low (Apr 22) followed by a strong breakout and a measured move based on the height of the 5-month trading range.
At the least, they want a small sideways to down leg to retest the April 22 low, even if it only forms a higher low.
The bulls want a reversal from a wedge pattern (Mar 25, Apr 9, and Apr 22) and a lower low major trend reversal.
They see the recent selloff as a sell vacuum and a bear leg within the trading range.
They hope to get a 2-legged pullback testing near the 20-day EMA.
They must continue to create consecutive bull bars closing near their highs to increase the odds of a reversal.
If the market trades lower, they want it to form a higher low (vs Apr 22) and a double bottom (Apr 22).
So far, the selloff from April 2 to April 22 was in a tight bear channel which means strong bears.
The move is strong enough for traders to expect at least a small sideways to down to retest the April 22 low (AFTER the current pullback), even if it forms a higher low. Will it happen within the next few days?
If the market forms a retest of the April 22 low, traders will see the strength of the selling. If it is strong, traders may expect a retest followed by a breakout attempt below the April 22 low. If it is weak, we may see more profit-taking from the bears moving forward, followed by more sideways to up trading afterwards.
For tomorrow, traders will see if the bulls can create another follow-through bull bar testing near the 20-day EMA.
Or will the market trade slightly higher but stall around the 4050-4080 area or the 20-day EMA and reverse lower, forming a retest of the April 22 low instead?
The market remains in a large trading range (4500 - 3850). Traders may Buy Low and Sell High within the trading range.
That means buying in the lower third of the trading range, and selling in the upper third until there is a strong breakout from either direction with follow-through buying/selling.
Andrew

23/4/25 FCPO Bulls Need Strong Follow-through Buying Today
Yesterday's candlestick was a bull reversal closing near its high with a long tail below.
In our previous report, we said traders would to see if the bears can create a strong retest of the 3850-3800 area and close (yesterday) as a strong bear bar near its low, or if the candlestick would close with a long tail below and above the middle of its range instead.
The market tested near the 3850 area but reversed to close as a strong bull bar.
The bears couldn't get a strong bear bar after testing the 3850-00 support area.
They got a strong second leg sideways to down (Apr 14 to Apr 22) to retest the January low.
They hope to get a breakout below the January low followed by a measured move based on the height of the 5-month trading range.
For that, they must create a strong breakout below 3850-00 with strong follow-through selling.
If the market trades higher, they want the 4000 or 4050-80 area or the 20-day EMA to act as resistance followed by at least a small retest of the recent leg low (Apr 22, even if it only forms a higher low).
The bulls want a reversal from a wedge pattern (Mar 25, Apr 9, and Apr 22) and a lower low major trend reversal.
They see the current move as a sell vacuum and a bear leg within the trading range.
They hope that the 3850 trading range low area will act as support.
If the market trades lower, they want a failed breakout below the 3850 area.
Since yesterday's candlestick was a bull reversal bar closing near its high, the bulls need to create strong follow-through buying tomorrow to increase the odds of a retest of the 4000-4080 area or the 20-day EMA.
If the bulls can create a strong follow-through bull bar, it could start a 2-legged sideways to up pullback phase.
Or will the market lack follow-through buying instead? If this is the case, that would indicate that the bulls are not yet strong.
The market remains in a large trading range (4500 - 3850). Traders may Buy Low and Sell High within the trading range.
That means buying in the lower third of the trading range, and selling in the upper third until there is a strong breakout from either direction with follow-through buying/selling.

FCPO 22 April 2025 - Breakout With Follow-through Selling
Yesterday's candlestick closed as a bear bar near its low.
In our previous report, we said the odds slightly favor the market to trade at least a little lower. Traders would to see if the bears could create a follow-through bear bar to confirm the breakout below the 4000 level. If they do, we may see a retest of the January low around the 3850-3800 area.
The bears got a follow-through bear bar and the night session also traded lower and has tested near the 3860 area.
The bears want a retest of the January low. They got what they wanted.
They want a large second leg sideways to down with the first leg being the April 2 to April 9 low.
They hope to get a strong breakout below the January low area to test the 3800 area.
The bulls want a reversal from a wedge pattern (Mar 25, Apr 9, and Apr 21) and a lower low major trend reversal.
The problem with the bull's case is that they couldn't create strong bull bars with follow-through buying.
They see the current move as a sell vacuum and a bear leg within the trading range.
If the market trades lower, they want a failed breakout below the 3850 area.
They must create strong bull bars to show they are back in control.
Exports for the first 20 days are up ITS: 11.89%, AmSpec: 18.5%.
Production is slowly picking up, but not in a big way yet.
Refineries' appetite to buy physical remains lukewarm with the recent sharp falling market.
The market remains Always In Short.
So far, the move down since April 1 is in a tight bear channel with strong bear bars. The selling pressure is stronger than the buying pressure (bull bars with no follow-through buying).
The breakout below the April 16 low is strong with follow-through selling.
Traders want to see if the bears can create a strong retest of the 3850-3800 area and close tomorrow as a strong bear bar near its low.
Or will the candlestick close with a long tail below and above the middle of its range instead?
If there is a climactic spike down, traders will see if there will be profit-taking activity after that (over the next several days).
For now, odds slightly favor the market to trade at least a little lower.
Traders will see if the 3800-50 area can act as support or if the market will break down below with strength.

FCPO Week 17 2025: To continue lower.Price has gone through a few support area and it seems that it will continue lower. If price continue to close below 3960 then there is possibility that it will move to 3700 area.
The case for going bullish price needs to close above 4070.

FCPO / Crude Palm Oil - 21 April 2025 Daily Chart Analysis
Yesterday's candlestick closed as a bear bar near its low with a prominent tail above.
In our previous report, we said the market formed a tight trading range in the last 3-4 days (small yellow box). The market is in breakout mode. Traders will wait for a breakout from either direction and trade in the direction of the breakout.
The market formed a breakout below the 4000 on Friday.
The bulls want a reversal from a wedge pattern (Mar 25, Apr 9, and Apr 18) and a lower low major trend reversal.
The problem with the bull's case is that they couldn't create bull bars with follow-through buying.
They must create strong bull bars to show they are back in control.
The bears want a retest of the January low.
They want a large second leg sideways to down with the first leg being the April 2 to April 9 low.
They got a breakout below the April 16 low on Friday. They need to create sustained follow-through selling to increase the odds of a measured move down.
Exports for the first 15 days are up ITS: 16.95%, AmSpec: 13.55%.
Production is slowly picking up, but not in a big way yet.
Refineries' appetite to buy physical remains lukewarm with the recent sharp falling market.
The market remains Always In Short.
So far, the move down since April 1 is in a tight bear channel with strong bear bars. The selling pressure is stronger than the buying pressure (bull bars with no follow-through buying).
Because this week closed near its low, the market may gap down next week. Small gaps usually close early.
Traders want to see if the bears can create a follow-through bear bar to confirm the breakout below the 4000 level. If they can create follow-through selling, we may see a retest of the January low around the 3850-3800 area.
Or will the market lack follow-through selling, and reverse back above 4000 instead?
For now, odds slightly favor the market to trade at least a little lower.

FCPO - Crude Palm Oil 17/4/2025 Daily Chart Market Analysis
Yesterday's candlestick closed as a bear bar in its lower half with a small tail below.
We said that the recent selling has been climactic and slightly oversold. Perhaps we may see a minor pullback towards the 20-day EMA or April 10 high area?
The market attempted to reverse higher but sold off in the last 30 minutes.
Currently, the candlestick is a small bull inside doji.
The bulls want a reversal from a wedge pattern (Mar 25, Apr 9, and Apr 16) and a small double bottom (Apr 9 and Apr 16)
They see the current move simply as a retest of the April 9 low and want a reversal from a lower low major trend reversal.
They see the last 3 trading days forming a micro wedge (Apr 14, Apr 15, and Apr 16).
They must create strong bull bars with follow-through buying to increase the odds of a TBTL (Ten Bars, Two Legs) pullback.
They want a retest of the 20-day EMA or the April 10 high.
The bears want a retest of the January low.
They want a large second leg sideways to down with the first leg being the April 2 to April 9 low.
If the market trades higher, they want the April 10 high or the 20-day EMA to act as resistance, followed by a reversal from a double-top bear flag.
Exports for the first 15 days are up ITS: 16.95%, AmSpec: 13.55%.
Production is slowly picking up, but not in a big way yet.
Refineries' appetite to buy physical remains lukewarm with the recent sharp falling market.
The market remains Always In Short.
The recent selling has been climactic and slightly oversold.
The move down since April 10 has a lot of overlapping candlestick. (see the 4 hr chart below). While the tight bear channel means persistent selling, the overlapping candlesticks indicate a weaker down phase than the first leg down (April 2 to April 9).
The bulls need to create consecutive bull bars closing near their highs to increase the odds of a minor pullback towards the 20-day EMA or April 10 high area. So far, they have not yet been able to do so.
If the bears get a strong breakout below the April 9 low with strong follow-through selling instead, the odds of a retest of the 3850-3900 area will increase.
Let's monitor the buying/selling pressure tomorrow.
Possible resistance area to pay attention: around the 4040-50 to 4070 area.

FCPO WEEK 16 2025: 50-50 price action.There is an argument for bullish price next week. However as it stands now the price is still in the 50-50 price action. There is not enough argument to confirm bullish movement. Meaning there is possibility also that it might go south next week.
Scenario 1: If price stays above the 4000 and push higher then it will be bullish. Possibly towards 4500.
Scenario 2: If price move below and stays below 4000 then bearish is back in control to push price possibility towards 3700.
Start of the week it will be reactive mode.

FCPO Week 14 2025: Retracement before going BEARISH.Price went higher today and this might be only a retracement before going lower again. For the remaining of the week, price might consolidate a bit before having any momentum to continue lower. If it indeed going lower, price will up the gaps before targeting TP1. Depending on price action TP2 is a possibility.
For price to fully go bullish, a close above 6600 is required.

FCPO week 13 2025: Lower to 4200?Looks like the price is going lower and it is bearish. Hopefully next week it could have enough momentum to continuously pushing lower and take out the support area towards 4200. Depending on price action, price would probably going much lower to 4000 where a much stronger support is expected. The only way for price to continue higher is to close above the 4500.

FCPO Week 11 2025: Bullish likely to continue.Price move higher as expected. It is now at resistance level.
Scenario 1: Price break through and close above 4638 - Price will likely going forward to TP2.
Scenario 2: Price help up at resistance and make retracement towards 4560 to 4550 area. If the area holds then it will continue higher towards TP1 and eventually TP2. This is the best scenario since price will have strong based to go higher.
Scenario 3: Price breakthrough and close below support then price will likely targeting area below 4500 and even lower towards 4400.
Let's see the opening on Monday.
Happy trading.

FCPO Week 10 2025: Still 50-50.There is a hint that the price might continue higher. 4480 to 4470 is a support area and it seems to be holding right now. However in order to continue higher price needs to overcome the current resistance area which is around 4560. Closing above the resistance will open the door to 4630 level. That is scenario 1. For scenario 2, if price close below 4470 level then it most probably going lower initially to 4400 level and possibly lower towards 4350.
For now it is still wait and see condition.
Good luck!

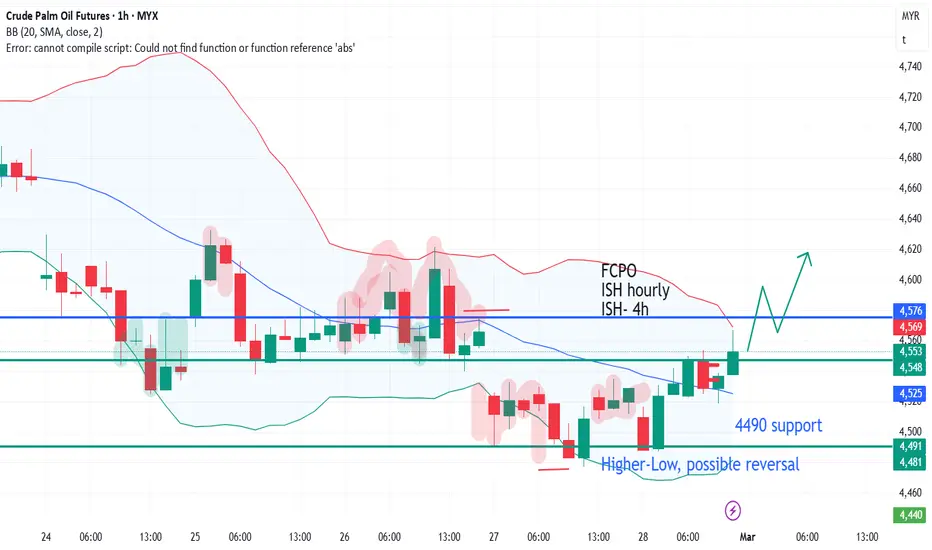
23) FCPO : Bear is making its call, but possible reversal...?update frm 20), Fcpo-May were in bearish last week but price frm 4500 is still holding. At least, it is still holding at 4490 and what so special about the end of the week was, formation of Double-Bottom which seemed more like a "Higher-Low" was formed. Price was able to rebound frm low and was tapped out at 1560 resistance.
Fcpo-May needs to break above 4576, the previous lower-high (blue-line), to confirm a possible shift-of-trend. Higher resistance is at 4622-4634 and 4700.
-IF the bear pulls back the price, THEN market will find some support at 4528-4490.
-IF price is below 4490-4500, THEN lower support is at pretty far at 4400, 4300.
PLS remember, I am not a guru and this is not a signal service provider. THIS is mere for fun.
#tradersupporttrader #FCPO #FKLI #futurestrader #cpop #malaysiatrader #bursa #BursaMalaysia
Disclaimer : "I am not a guru and I am working hard to make profit same as everyone else. This is not a recommendation of buy or sell, just a mere idea of trading and trading journal. Please consult your financial advisor for any thought of buying or selling. Trade at your own risk."
22) FKLI : downtrend but possible rebound?resumes frm 21), fkli-feb did the exact opposite of my expectation! On my titled "reverse-to-bullish", it didn't reversed to bullish at all! But what had happened was it formed some kinda "head" at 1591, then trapped in tight range frm 1581-1585, then rollover all the way down. Price formed lower-low at 1560++, then shoot all the way up to...1591!
At the end of February, last-day pull-up oso did not happen. Some of the stocks gave out disappointing quarter results such as Genting, Genm, etc...MOst probably this was one of the reason for the sudden fall. More bad news to come? Well, we have to wait for US then. One of the thing to look out was this current support level,1537-1540, which was a strong critical area bcox it was tested multiple times in the past.
-IF no more bad news and this support level hold, THEN fkli-march might test back 1565-1585 level.
- IF the bear is strong, THEN lower level of support range frm 1500-1510.
-IF bull is trying to reverse the trend, THEN it has to fight back higher than 1565-1585 level, reaching the closest high frm 1600-1605. I am not ashamed if my prediction is wrong because this is part and parcel of trading. IF I am right, THEN I go for it. IF I am wrong, THEN cutloss. Simple.
GUd luck and gud hunting.
PLS remember, I am not a guru and this is not a signal service provider. THIS is mere for fun.
#tradersupporttrader #FCPO #FKLI #futurestrader #cpop #malaysiatrader #bursa #BursaMalaysia
Disclaimer : "I am not a guru and I am working hard to make profit same as everyone else. This is not a recommendation of buy or sell, just a mere idea of trading and trading journal. Please consult your financial advisor for any thought of buying or selling. Trade at your own risk."

FCPO Week 9 2025: At resistance - wait and see.Price is still bullish however it is at a resistance. Expecting that it will make a retracement before resuming higher. 4600 price area is the level to watch. If price didn't make the retracement and close above 4700 area then there is possibility that it will want to continue higher to target 4770 area.

21) FKLI : reverse to bullishresumes frm 18), fkli-feb dropped down to slightly lower than the expected 1575, reaching low at 1572(1571.5 precisely), THEN a rebound on FRiday! A classic false breakout to the downside. A reversal is said to be formed when the price broke abv the previous lower-high at 1583 (the red marker) and closed at 1589.5 on FRiday, 21st Feb25. Now, bull is in charge.
IF the market is aggressive to the upside, THEN it will retest 1595-1600. IF the market breaks above the strong resistance 1600, THEN it will go to the next level at 1613 and 1628.
IF the market is slow-ish, THEN fkli-feb will hover from 1584-1588 immediate support till 1595. Deeper consolidation will touch range from 1585-1572. Price below 1572 indicate another round of bearish market appears. Since next week is the last week of February month, I will bet on "end-of-month bull rally". End of the month typically is a bull rally for fkli on some special months but most of the time it is just the last-day-of-the-month rally!
PLS remember, I am not a guru and this is not a signal service provider. THIS is mere for fun.
#tradersupporttrader #FCPO #FKLI #futurestrader #cpop #malaysiatrader #bursa #BursaMalaysia
Disclaimer : "I am not a guru and I am working hard to make profit same as everyone else. This is not a recommendation of buy or sell, just a mere idea of trading and trading journal. Please consult your financial advisor for any thought of buying or selling. Trade at your own risk."

20) FCPO : Bull might come to an end...or juz correction?update frm 19), Fcpo-May will continue next MOnday, 24-28th Feb 2025, the last week in month of February. What happened last week was fcpo-May made what seemed like a false breakout, 4700-4720, then quickly went down. The range of 4634-4700 is important for bull to stay afloat. Price breaking below 4634 indicates the possible reversal of trend. Price within 4634-4700 is bull...IF bull is aggressive, THEN it may gap up abv 4720 and higher.
IF the market is mild drop, THEN it will range frm the 4555-4634 but it is still bearish. IF market falls below the 4500-4560, THEN the next level is pretty low at 4400-4300, THEN it is a strong bearish market.
PLS remember, I am not a guru and this is not a signal service provider. THIS is mere for fun.
#tradersupporttrader #FCPO #FKLI #futurestrader #cpop #malaysiatrader #bursa #BursaMalaysia
Disclaimer : "I am not a guru and I am working hard to make profit same as everyone else. This is not a recommendation of buy or sell, just a mere idea of trading and trading journal. Please consult your financial advisor for any thought of buying or selling. Trade at your own risk."

19) FCPO : uptrend resumes...???update frm 16), price frm fcpo-apr has come to an end. Fcpo-May will appear next MOnday, 17-21st Feb 2025. What happened last week was unpredicted. Price gapped up to 4640-4700 then sank lower to the 4630-4650 range. The next day, it gapped down 30pts to 4620 and fell to 4540, then rebound back to 4630...
IF the market is aggressive drop, THEN it will hit the 4540-4490. IF market falls below the critical 4490(4487 to be precise) which is also the previous higher-low, THEN market has probably reverses.
IF the market is slow-ish, THEN it will lower back to 4600-4540. IF the market continues bullish, price has to break abv 4600-4630, and retest the latest high at 4700.
PLS remember, I am not a guru and this is not a signal service provider. THIS is mere for fun.
#tradersupporttrader #FCPO #FKLI #futurestrader #cpop #malaysiatrader #bursa #BursaMalaysia
Disclaimer : "I am not a guru and I am working hard to make profit same as everyone else. This is not a recommendation of buy or sell, just a mere idea of trading and trading journal. Please consult your financial advisor for any thought of buying or selling. Trade at your own risk."

18) FKLI : bull and bear plays tug-of-warresumes frm 17), the latest high has broken above previous high of 1590 and creates higher-high at 1600-1605. Basically, bull is still IN CONTROL but a possible "head" has been formed. At the end of the week, price falls at 1592.5. Bull still maintains till 1575 closest higher-low is broken.
This could be a mere consolidation phase of a bull or a reversal...
IF the market is aggressive to the downside, THEN it will retest 1575-1585. IF the market breaks lower than the previous higher-low at 1575, THEN market has reversed into bear.
IF the market is slow-ish, THEN current point 1590 - 1595 is the range for possible continuation to higher price. Deeper consolidation will touch range from 1585-1590.
PLS remember, I am not a guru and this is not a signal service provider. THIS is mere for fun.
#tradersupporttrader #FCPO #FKLI #futurestrader #cpop #malaysiatrader #bursa #BursaMalaysia
Disclaimer : "I am not a guru and I am working hard to make profit same as everyone else. This is not a recommendation of buy or sell, just a mere idea of trading and trading journal. Please consult your financial advisor for any thought of buying or selling. Trade at your own risk."
