𝗖𝗼𝗽𝗽𝗲𝗿 𝗨𝗽𝗱𝗮𝘁𝗲: $HG_F Daily. DCB into 13dma rejectionSimilar to $TNX. Looks like it wants to go lower meaning coronavirus still impacting China
FCX

ominous giant wedgehad expected this to break to the north.. those new xtra large red bars are making me wonder about south. Always amusing looking back at these things .. lot of grand visions of tight supply and never ending demand. thats not what the traders think. What happens to the spy if copper tries for $2.00? Fed pump keep balloon in the air? sales team looking strong here.
tempo starting to ramp up. start looking for chairs?
Maybe just quick case of wu-flu and back to biz in a week or two? Any thoughts?

FCX updateNYSE:FCX
Revision to previous chart/idea. After earnings, fcx took a dump, thanks to corona virus news, copper prices dropping, and overall index weakness. Not really sure how the market will react to fed day on wed. Assuming its not too bad, i think the bullish pattern continues. FCX is on sale and could be a good long term entry. With production in Indonesia ramping up and a return to bullish copper prices we could easily hit $60 a share in a couple years.
On the other hand, if the fed disappoints and virus business continues to spook the market we might be headed to single digits (something that I have been waiting and watching for) before heading back to ATH's.
Something tells me we keep the boat afloat a while longer. Playing it day by day.
I apologize for the "busy" chart. I am still learning to chart and finding what works for me and what to pay attention to. I have another chart on investing.com that is a bit cleaner if you care to see it.
What are your thoughts?

100 day X 200 day - Doc caught something nasty..copper caught the virus.. maybe the 100 day 200 day crossover will help to get off the floor? Has good history of inspiring strength. Just what the doctor ordered?
FCX

FCX breaking to new highsTime to go long FCX. The sector is moving higher and FCX is breaking out to new highs.
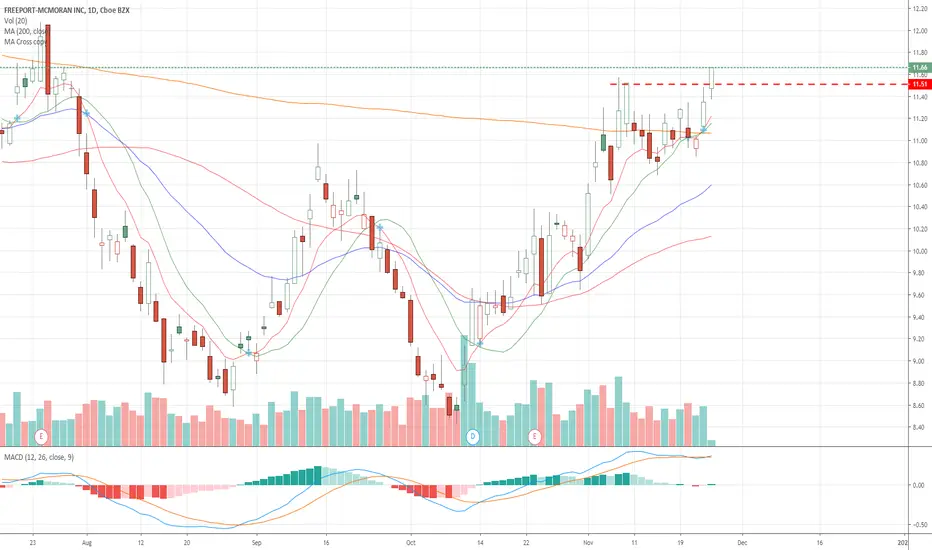
FCX longShort update.
Please reference my first FCX chart for my initial thoughts.
The current rally is sitting roughly at 78.6% retracement of the prior move from April 16th of 2019. As you can see we paused a little bit and consolidated after the initial move up from $8.30 (which also resulted in a pause/sideways movement). I'm looking for AT LEAST a movement to the 100% retracement at 14.51 which is currently serving as resistance from Aug-Sept double top. This level also lines up with the 2.272, 2.414, and 2.618 fib cluster extension of the prior swing high-low.
I'm looking for a small retracement of the last (second red line) movement. As you can see this movement already flagged a bit and after todays late day pump im expecting a little relief before wednesdays announcement of china trade deal.
Assuming things go okay with the signing and whatnot, I think we will at least see the 1.272 or 1.618 extension by spring/summer.
One thing to keep in mind is that FCX earnings are on Jan 23rd. Im expecting a small beat or miss. I need to refresh my memory but the prior earnings were a miss or barely beat but the FCX continued upwards on china talks and futures pumping. Earnings are turning around and production is ramping up with the opening of new deep mine in Indonesia.
What are your thoughts?

FCX timing and rhythm - Is it copper time? here's something im sure we've all been watching.. looks pretty flaggy. IF the trade stuff is settling out, and markets general attitude stays upbeat. I think this looks real nice.
Of course this has a lot of strings attached.
good luck!

i39.FCXBeta-R:Journal. Risk Management: Compound .Level : PA . Time: Short-term - Intermediate . This is just my view follow if it aligns with yours. Ideas are not repeated rather updated.Worry about risk only.

fcx with another flag.. but ...what about the tariffs?fcx buyers are very excited for the future! has been a good run. but, seems we never really got past phase 0 on the trade deal.. will the tariffs start to become bullish? Harder us pushes maybe quicker we find a solution.. agree to disagree?
Taking a bit off table.. keeping close eye on copper.. who knows how high it may run. has been depressed for so long.. 4? 5? 10?! haha
GOOD LUCK!


FCX Breaking Out - Weekly ChartFreeport-McMoran is attempting to break out of a bullish wedge pattern. There is a lot of options activity in this name with the February 21 $14 and the December 13 $12.50 calls. Note the bullish divergence just prior to its recent bullish move.
We want to see the stock hold above the break out level. If the price can hold I am targeting $13.90 as my initial price target.

FCX breaking out of downtrend?Attention to FCX if stock can continue to move higher. Trendline indicates 1.80% annual inflation. From a high of $17 in 1996 would equate to $~$26 2019.
From a low of ~$3.81 in Nov 2000 a 1.80% annual inflation rate would equate to ~$5.35.
From a mid point of $10.50 = $15.27

fcx putting up a bull flag? Copper making move
ER in rear view
Grasberg pit on track
Things are looking ok here. Just need to hop over that resistance line... : )
What do ya'll think?

FCX heavy green side by side Like the idea here.. couple big green days, some take advantage and sell off.. buyers step in and pick up slack.. end up with 2 big green candles? We'll see
Should be good here. until next panic hits

LONG FCXExpecting bounce from extremely oversold weekly and daily levels. If stop breached, be prepared to catch new daily reversal on lower levels with a tight stop.

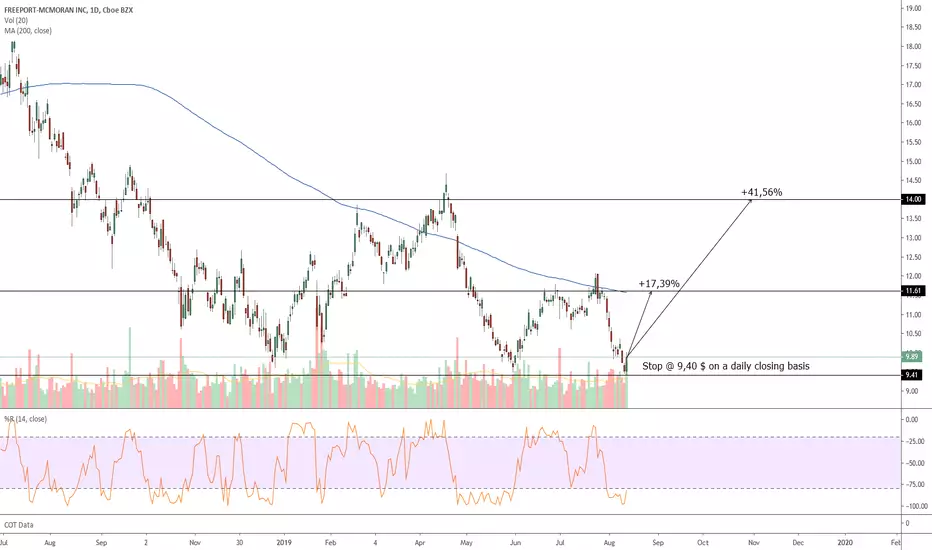
FCX sin fuerzas para definir por ahora. FCX contra resistencia de la cuña bajista de corto plazo que se mueve dentro de un movimiento bajista de más largo plazo.
Mientras mantenga la zona de 10.20/10.10 aún quedarán chances de romper al alza para ir a buscar los 12/12.15. Si no puede mantenerse por encima de este soporte inmediato, es muy probable que vaya a la zona de soportes de mayor importancia en los 9.60/9.50.
La salida alcista se daría sobre los 10.80 y la confirmación arriba de 11.
Los indicadores muestran dudas. El RSI aceleró más que el precio en las últimas ruedas pero con freno en la zona de ingreso a sobrecompra. MACD se mantiene al alza pero recprtando el histograma.
Estando comprado, vendería contra resistencia y espero resolución. Estando afuera, compro con la confirmación encima de 11 o llegando a la zona de soporte más importante en los 9.60/9.50.

The copper man can? inverted H/S copper chartWhat started as a nasty looking h/s has turned into a possible invert h/s?
We shall see?
FCX...

FCX : Daily 34 SMA presses 500 Hull & Up Up & AwayFCX : Daily 34 SMA presses 500 Hull & Up Up & Away

LONG FCXExpecting bounce from extremely oversold weekly and daily levels. If stop breached, be prepared to catch new daily reversal on lower levels with a tight stop.

FCX buy setupFCX price near to strong support line. possibly buy. wait for abc confirmation. I also watching this one .

LONG FCXExpecting bounce from extremely oversold weekly and daily levels. If stop breached, be prepared to catch new daily reversal on lower levels with a tight stop.
Update COPPER: What does copper stay about the economy?Recent price action in copper looks terrible.

British Pound Will Move Up Against the U.S. DollarThe British Pound has been challenging strong resistance with increasing volume. Looking at the chart long term, weekly time frame, I am getting signals telling me that it might move up against the U.S. Dollar, here is why:
Now trading above EMA10 and EMA50.
Hitting higher lows since October 2018.
Increasing bullish volume.
Bullish RSI.
MACD trending up and entering the bullish zone.
Looking at the U.S. indexes, such as the SPX, can support the findings on this chart.
You can see my latest analysis here:
Russell2000 (RUT):
Conditions for change: If the October 2018 low is taken out, then this analysis would become invalid and a new one is needed.
Feel free to hit like to show your support.
Thanks a lot for reading.
Namaste.
