Gold Surprises as Dollar Gets Monkey-Hammered LowerIn " Gold Leaps Higher as Worries Mount ," I briefly pointed out how those very same institutions that championed quantitative easing policies implemented by the Federal Reserve are now coming out to proclaim quantitative easing added no substantial benefit to the real economy .
Gold was pushed lower on the assumption that central banking policy would all pan out and that the U.S. would finally achieve escape velocity; but the exact opposite is occurring. Despite the near 12 to 16 months of absolutely horrendous, even recessionary data, market participants believed that if the Fed began to tighten monetary policy then the economy must be alright.
Central bankers,misguided by classroom academics and abhorrent to real world economic dynamics, believe that if you tinker with interest rates that somehow inflation will magically begin to rise. Not so because it is real, meaningful growth that produces inflation; and it is more evident now that the these policies do not produce meaningful growth.
I mapped out the dollar's downward trajectory, which was largely based on the floundering economy and the inability for the Fed to take action that will pop asset inflation. I still believe this is based on the above factors and that the dollar will likely gather strength as the US slips into deflation.
Traders and CNBC pundits think that if deflation takes hold then gold will surely decline into the abyss. And just like their "lower gas prices equal booming consumer spending" myth, gold falling off a cliff during deflation is just as preposterous.
Gold is unique in that if can act like an insurance policy against both sides of tail risk (inflation and deflation). It is well-known that gold had a massive bull run when stagflation took hold of the US during the 1970s. Inflation ran amok.
However, nobody mentions that gold tripled, in inflation-adjusted dollar terms, during the early 1930s (the Great Depression) prior to President Roosevelt outlawing the private ownership of gold.
As I wrote last April:
" There is an assumption that the dollar and gold’s performance is strictly inverse of one another, but that is not so. The WGC (World Gold Council) indicates that between early 2014 and March 20, 2015, the dollar has gained over 20 percent while gold only fell 1.2 percent.
Historically, gold prices more than double on a weak dollar than it falls on a stronger dollar. Thus, a stronger dollar is not indicative of massive gold depreciation.
When the dollar declines, gold has appreciated 14.9 percent. Yet, when the dollar strengthens, gold has only fallen by 6.5 percent, according to the WGC. "
If you look at this chart, you will notice one thing: gold sure looks to trend with the SPX. There is an argument that this due to simple asset inflation.
Notice the massive divergence began when gold began to top in 2011. The divergence is what I call the "perception" gap.
I expect that divergence to close. It's no secret that I was right about the volatility of 2015, along with other key macro trends. I believe by the end of 2016 and 2017 is when the real fireworks begin.
Gold's recent move has been huge, and, of course, there will be profit taking. But those who follow me know that the underlying fundamentals for gold has been strengthening for some time.
(Note: the gold chart is the same I used in the above mentioned gold idea, but the minor uptrend (along with new resistance) were added).
Please follow me @lemieux_26 and check out my other ideas, which have links to previous writings.
FCX

Put premium selling opportunity in FCXI am by no means an expert programmer or technician, but what I have been noticing with FCX is a relatively consistent pattern where option premium sellers have a great opportunity for enhanced success.
Rules:
- On a 4 hour chart with Keltner channels, Bollinger Bands in the upper indicator and CM_WVF_v3_Ult in the lower indicator
1) When CM_WVF is in GREEN, and
2) Price is outside the KC
3) When price reenters the KC initiate the following transaction:
Sell Put or Put spread with the closest strike at the lower Bollinger Band. Days to expiry = 30 days
Within the past 6+ months, that signal has occurred 5 times with all expiring OTM, and once was there a touch.
The setup in FCX is near again - Green CM_WVF and price is outside the KC.
Stay tuned...

FCX Retest Gap Day Trade (Brad Reed Jan14,2015)FCX expected to open at 19.38 for a Retest Gap. To learn to trade this strategy for free, go to www.RealLifeTrading.com

FCX downtrendingFCX is currently in a downtrend. Expecting prices to correct to $34 (completion of AB=CD pattern) minimum or further down to $33 which is the longer term bottom trend support and completion of the harmonic pattern. Fundamentally undervalued compared to rivals. Get ready to switch over to a long position.

FCX - Time to start building ~$33As a fundamental story, this stock is worth $50, but a big CAPEX program and recent M&A has hurt the profitability. No funny share buy-backs being used to buoyancy the stock (good). Combine that with China weakness and you've got a beat-up stock (great).
We are pushing down to a key $33 level, established now for about a year. With some long term technical support trends lines to give you some down side barriers. Long term bullish, so start to build a positions around the $33 or $-cost-avg into this guy here.
Thanks for stoking my interest Joe, www.tradingview.com

FCX at Support w/ Momentum DivergenceVolume Spike on Friday at support brought a pin bar like candle on extremely noticeable momentum divergence. I would look to get long at the closing price of Friday; however, the more conservative trade would be to wait for a break of Friday's high or even a close above that price. I would look for a retest of the first major resistance level around $37 - profit target put just in front of that level. There should be some resistance seen at $36 as well which would be a good level to raise stops to break even.

$FCX on the way to $40 a shareHit the 161.8 of AB on this completed ABCD, 113 acting as res. from previous high. Both determined the 3rd wave, PA turned down for a ret. @50fib., broke out of the narrow descending channel towards completing wave 5.

FCX setting up for longFCX bouncing off some great levels and getting support t the right spots.
I am no elliotician by any means by could we see a wave 5 here?
$HG_F is also catching bids today off that important 3.08

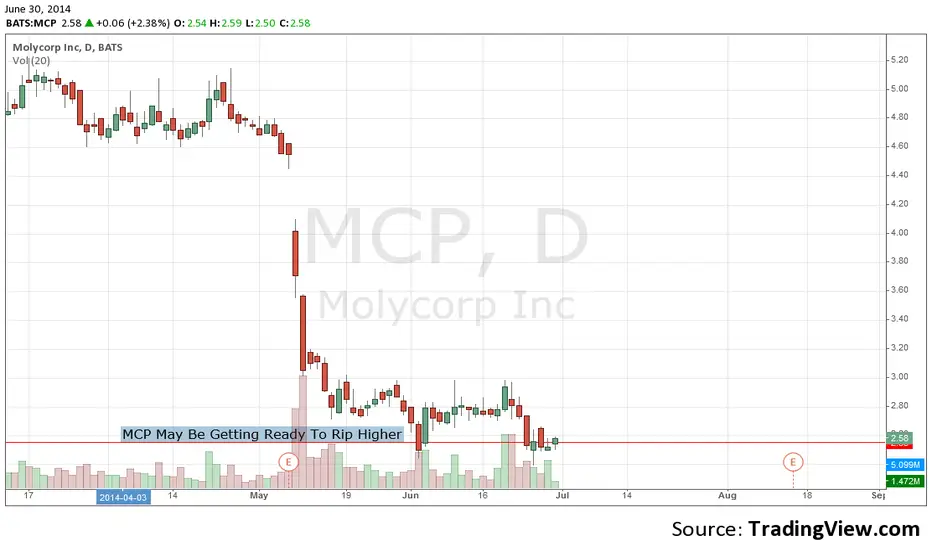
$MCP May Be Getting Ready To Rip HigherMolycorp Inc (NYSE:MCP) is trading at 52 week lows and hated by most investors for its poor performance. While the markets trade near all time highs, this stock has fallen throughout 2014. That may be about to change. Commodity stocks in all sectors have started to catch a big bid. Look at stocks like ConocoPhillips (NYSE:COP) in the oil sector or Freeport-McMoRan Copper & Gold Inc. (NYSE:FCX) in the copper and gold sector. They are all taking off to the upside. One of the few commodity sectors that has not started to run is rare earth mineral plays. This is the bread and butter for Molycorp Inc. At a current price of $2.55, it is priced at almost bankruptcy levels. This can be looked at as a high risk but also very high reward play. Commodities are hot and likely to get hotter.
Gareth Soloway
Chief Market Strategist
www.InTheMoneyStocks.com