3 spots for a Buy before vertical $ORGOBuys were called for $5.11, $5.21 and $5.51 after long consolidation at $5 area.
It started moving up nicely into last 2 hours of the day, triggering stronger volume once above $5.50 and ramping into $6.75 after hours.
TOTAL Week: +60.8% per traded position
Monday: +12.9%
Tuesday: +17.0%
Wednesday: +9.5%
Thursday: +12.2%
Friday: +9.2%
12 trades on NASDAQ:NVVE NASDAQ:TRNR NASDAQ:MLGO NASDAQ:ESGL NASDAQ:BCG NASDAQ:ONVO AMEX:ATCH NASDAQ:STEC
10 wins
2 losses
TOTAL February: +397.7%
Slow and quiet last week of the February but still solid profit made. Looking for more explosive action next week to return with start of a new month. Wouldn't mind something like last week (+200% banger!)
Congrats on Feb gains and see you all on Monday morning, enjoy the weekend!
February

(BTC) bitcoinan indicator to show the price of BTC is beginning a new phase based on whatever I did with this indicator. .dev

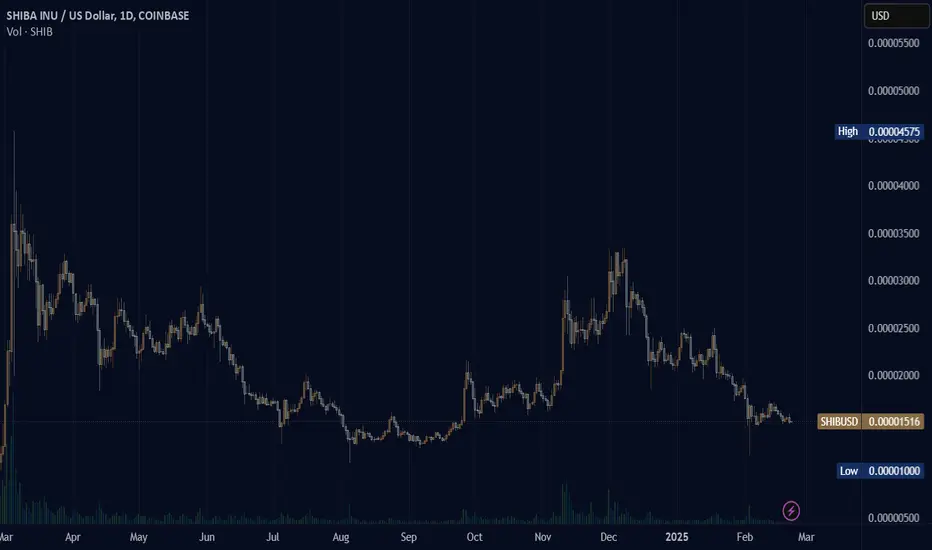
(SHIB) shiba inuThere is no cup and handle coming. The activity online by community programmer Kusama and other people seem to have led to a disgracing of the SHIB token and all that has happened is losing. Too much talk, not enough action. Silence is golden inu. There is still hope for Shiba Inu on the likes the acceptance of Shiba came far before many other meme tokens. Right now the Solana craze is being phased out in favor of Base chain memes. Base seems to be countering the popularity of Ethereum. Shiba Inu on Ethereum is not seen as trending the same way Solana memes and now Base memes are trending.
(SOL) solana "big gulp"The price of Solana is looking like it is going to go into a big gulp phase with a potential for a bottom (buying zone) and a recovery (ramp up) out of the big gulp moment.

(XLM) stellarStellar, an inactive pond with ducks wading graciously through the water while those sitting by steadily view the inactive activity of peaceful animal life living among the life of humans, no voices, only the sound of trees rustling and wind blowing through the air.

(RL) ralph lauren A chart to view Ralph Lauren through some visual of my indicators for anyone who wants to see. Make what you will from the image and make up your own mind about the fear and greed concept for Ralph Lauren right now. Will the price continue, or will the price not?
The shares represents shares bought. The green line would then mean there are few shares bought and the shares are soon to go negative against the price of the stock. The more shares bought the higher the line spikes, pertaining to the lineMath_v3 (shares) indicator.

Phala (PHA/USDT) Bullish Setup on the 1H Chart - Zoom outPhala (PHA) is currently showing a promising bullish setup on the 1-hour chart. The price has been moving within an ascending channel recently, with clear signs of bullish momentum. Here are the key points indicating a potential rise:
If the bullish scenario plays out, traders could set profit targets around $0.30and $0.40. To manage risk, stop-loss orders can be placed below the rising support line or the most recent low, depending on individual risk tolerance.

Dogecoin (DOGE/USDT) 4H Analysis - Potential Setup in Play DOGE is forming a bullish pennant pattern on the 4-hour chart, indicating a potential continuation of the uptrend. A breakout above the upper trendline could trigger a strong move upward.
However, there are some risk factors to consider. A bearish divergence on the RSI suggests the possibility of a short-term correction. Furthermore, the 200 EMA on the 4-hour chart is acting as dynamic support. Losing this level could shift momentum to the downside.
Currently, DOGE is trading at $0.2524, with an intraday high of $0.2679 and a low of $0.2481.

Stock name united parcel service ( ups ) signal Stock name united parcel service
UPS
Call from 137.61
Expire time is 9 feb 2024
👆👆👆👆👆👆
This is signal
price will go down and would be tech
To 137.61 after tech it will go up
And would be tech to
140.42
👆👆👆👆👆👆👆
This is prediction

Bullish for XNO AT any Time soon will explodei believe that this coin will hit soon more than 5 dollars
but if you scalp quickly
you can buy between 1:04 to 1:08
and sell between 1:28 to 1:48

Overview of Cryptocurrency Volatility - 1M, February, 2023.Analysis of the volatility index in February. Time interval - 1 month.
Currency - USDT or equivalent to BUSD .
The selection is carried out according to the lists of cryptocurrencies that are represented on the spot and futures markets, with a total of more than a hundred coins.
Top 15 Coins (February):
1. CFX /usdt - 259.01% (High&Low: 585.29%)
2. STX /usdt - 221.27% (High&Low: 258.33%)
3. COCOS /usdt - 207.41% (High&Low: 350.22%)
4. DODO /usdt - 93.87% (High&Low: 172.27%)
5. GRT /usdt - 71.85% (High&Low: 167.68%)
6. STG /usdt - 67.69% (High&Low: 129.14%)
7. FET /usdt - 59.93% (High&Low: 127.56%)
8. BLZ /usdt - 52.70% (High&Low: 89.89%)
9. ANKR /usdt - 51.91% (High&Low: 124.24%)
10. NEO /usdt - 46.63% (High&Low: 97.31%)
11. XEM /usdt - 44.32% (High&Low: 113.24%)
12. DUSK /usdt - 42.14% (High&Low: 105.95%)
13. IMX /usdt - 40.75% (High&Low: 79.76%)
14. MTL /usdt - 39.34% (High&Low: 157.03%)
15. PHB /usdt - 39.18% (High&Low: 84.39%)
The coin showed the worst result: BTC /usdt - 0.07% (High&Low: 16.86%).
Full list of analyzed coins: www.tradingview.com
Analysis information for all coins: docs.google.com
Thanks for your attention!

Overview of Cryptocurrency Volatility - 1D, February, 2023.Analysis of the volatility index in February. Time interval - 1 day.
Currency - USDT or equivalent to BUSD .
The selection is carried out according to the lists of cryptocurrencies that are represented on the spot and futures markets, with a total of more than a hundred coins.
Top 15 Coins (1 day):
1. CFX /usdt - 396.70% (High&Low: 724.65%)
2. COCOS /usdt - 252.56% (High&Low: 568.54%)
3. STG /usdt - 242.04% (High&Low: 419.52%)
4. GRT /usdt - 240.08% (High&Low: 412.45%)
5. HIGH /usdt - 226.14% (High&Low: 472.17%)
6. STX /usdt - 220.43% (High&Low: 504.45%)
7. DUSK /usdt - 220.06% (High&Low: 450.92%)
8. FET /usdt - 218.16% (High&Low: 438.29%)
9. PHB /usdt - 215.55% (High&Low: 432.50%)
10. INJ /usdt - 201.60% (High&Low: 383.71%)
11. MAGIC /usdt - 201.19% (High&Low: 435.49%)
12. RNDR /usdt - 197.10% (High&Low: 442.58%)
13. JASMY /usdt - 195.51% (High&Low: 324.08%)
14. BLZ /usdt - 190.97% (High&Low: 416.32%)
15. OP /usdt - 188.11% (High&Low: 362.62%)
The coin showed the worst result: XRP /usdt - 48.54% (High&Low: 109%).
Full list of analyzed coins: www.tradingview.com
Analysis information for all coins: docs.google.com
Thanks for your attention!

Overview of Cryptocurrency Volatility - 1h, February, 2023.Analysis of the volatility index in February. Time interval - 1 hour.
Currency - USDT or equivalent to BUSD .
The selection is carried out according to the lists of cryptocurrencies that are represented on the spot and futures markets, with a total of more than a hundred coins.
Top 15 Coins (1 hour):
1. CFX /usdt - 1442.02% (High&Low: 2981.36%)
2. HIGH /usdt - 1104.88% (High&Low: 2350.01%)
3. RNDR /usdt - 1045.63% (High&Low: 2153.33%)
4. STX /usdt - 979.39% (High&Low: 2180.80%)
5. COCOS /usdt - 960.65% (High&Low: 2062.28%)
6. MAGIC /usdt - 933.54% (High&Low: 1976.79%)
7. FET /usdt - 905.54% (High&Low: 1953.33%)
8. ASTR /usdt - 898.78% (High&Low: 1919.20%)
9. DUSK /usdt - 891.55% (High&Low: 1768.47%)
10. PHB /usdt - 888.84% (High&Low: 1901.10%)
11. DODO /usdt - 880.97% (High&Low: 1810.57%)
12. HOOK /usdt - 878.07% (High&Low: 1847.88%)
13. LDO /usdt - 835.25% (High&Low: 1784.49%)
14. STG /usdt - 832.73% (High&Low: 1689.60%)
15. MINA /usdt - 810.43% (High&Low: 1836.91%)
The coin showed the worst result: BTC /usdt - 200.64% (High&Low: 450.56%).
Full list of analyzed coins: www.tradingview.com
Analysis information for all coins: docs.google.com
Thanks for your attention!

After Triangle PatternDogecoin Still bullish in TF 4 Hour this is only TA but we have the fed for determine market direction #DYOR

Cardano (ADA) Hitting $58B By Year 20?Cardano (ADA) is now trading at $0.992, a 2.73% drop from Friday’s value of $1.021M. The cryptocurrency’s price has been on a declining trend since the start of February.
Within the next 24 hours of trading, ADA is expected to trade at a low of $0.989 and a high of $1.04M. It has a 24-hour trading volume of USD 1,415,938,600M, with a market cap lower than previous weeks.
Cardano’s price may retrace by 23.6% on its first level, according to the Fibonacci Retracements level. The FR level indicates where support and resistance are likely to integrate.
The group also forecasted that the smart contracts-enabled, peer-evaluated currency will end the year at $2.72M.
Its price could be headed in that direction as soon as investors build some upward momentum, with the current trend offering a buying opportunity.

$GDX breakout! Buy on any dip (4/5)Conviction: 4/5
This is one of the two breakouts that we've been waiting for since May 2021.
Buy on dip (possible retested yesterday already) on the horizontal dash line around 31.81.
Need to wait for breakout of resistance line since August 2020 to fully confirm breakout. However, Gold seems to have already broken out... so seems like just a matter of time.

Eurozone ($EZU) looks sickly! (3/5)Conviction: 3/5
Seems to be turning down away from LT (2002) channel resistance. RSI-W also signaling further downside.
Looks like there might be an intermediate-term support around -10% away.
All in all.. may be a better risk:reward trade once it breaks down from the white support line. Either way, the trend looks negative.
If you are interested in Europe, perhaps UK will be a better trade.

Bitcoin in February 2022, where next... $33k or $46k?Hello crypto nerds and nerdettes
Please give a thumbs up and leave a comment below if any questions on this chart...
1st of February today so a quick review on BTCUSD.
Firstly we have some clear trend lines from the price action from the last few weeks supporting a trend upwards and resistance from a longer period pre '22 starting to get tested in the last hours of trading today.
Still, a long way to go, but steady climbs will help the whole market increase again but still lots of pressure from the bears and big money wanting cheaper bitcoin
So basically if we break upside of the pennant, expect some nice movements up towards 40k+ and then bulls will want to create some new strong support levels, ideally over $46k will get the ball rolling towards another test of the highs of last year
Indicators show bullish action but some divergence could come into play, some longs just placed but not a huge amount, kinda going into overbought area's right now.
February has a great record with these markets with great ROI and positive signals that could possibly play again here but past performance will never guarantee future outcomes

$ACWX relative to $SPY potential (3/5)Conviction: 3/5
Overall still in LT (2009) down channel, so trade is quite risky... you are trading against the trend...
HOWEVER:
bounced off MT (2018) trend support
RSI looks pretty good
SPY ourperformance against world is pretty outrageous in the last 2 years, so some mean-reversion is likely
Trade duration... 3-5 months.
Much better trade is to wait for breakout confirmation, and wait for entry from likely retest.

$ACWX decision point!Unclear what is going to happen... probably not a good idea to trade this right now.
Can trade small position within the channel, although risky to trade against the trend...
Bull case:
potential bull flag setup
good relative value (in terms of performance) to S&P 500
holding peak-price support from 2017 so far
better to wait for confirmation of bull flag?
Bear case:
touching medium/long-term (2011) channel resistance
RSI-W at low levels, but not oversold yet

$NKE good Medium-Term entry (3/5)Conviction: 3/5
Hovering / bouncing off medium-term (2018) parallel channel support
Hovering / bouncing off short-term (2020) price level support
RSI-D looks like it is bouncing off from oversold levels
RSI-W approaching oversold levels
Risks
V expensive relative to own history, does not bode well for Long-term Returns
Expensive relative to market (e.g. S&P 500 P/S is 3ish)
Unimpressive growth
parallel channel support broken during 2020

$SSY looks promising (3/5)Conviction: 3/5
in upward channel, near bottom
Recently retested MT downtrend resistance-turned-support (2009, 2006)
Cheap relative to market but low growth and low margin
Risks
RSI-W not quite at oversold levels, this means we could continue to hug the trendline down towards support of parallel channel
negative FCF
About average (possibly peaking) P/S ratio relative to own history...
low growth and low margin

UK relative performance against EurozoneNeutral for now, but long-term looks like UK is set to outperform Eurozone
Better to wait for confirmation!
Either way, UK (EWU) is looking somewhat promising as well.
