Mr. LATE drop the RATE!!"Jerome Powell aspires to be remembered as a heroic Federal Reserve chair, akin to Tall Paul #VOLKER.
However, Volker was largely unpopular during much of his tenure.
The primary function of the Federal Reserve is to finance the federal #government and ensure liquidity in US capital markets.
Controlling price inflation should not rely on costly credit.
Instead, it should be achieved by stimulating growth and productivity through innovation and by rewarding companies that wisely allocate capital, ultimately leading to robust cash flows... innovation thrives on affordable capital.
While innovation can lead to misallocations and speculative errors, this is a normal aspect of the process.
(BUT it is crucial that deposits and savings are always insured and kept separate from investment capital.)
By maintaining higher interest rates for longer than necessary, J POW is negatively impacting innovators, capital allocators, small businesses that need cheap capital to function effectively, job creators, and the overall growth environment.
Addressing price inflation is a far more favorable situation than allowing unemployment to soar to intolerable levels.
"Losing my job feels like a depression".
But if I have to pay more for eggs, I can always opt for oats.
Fed
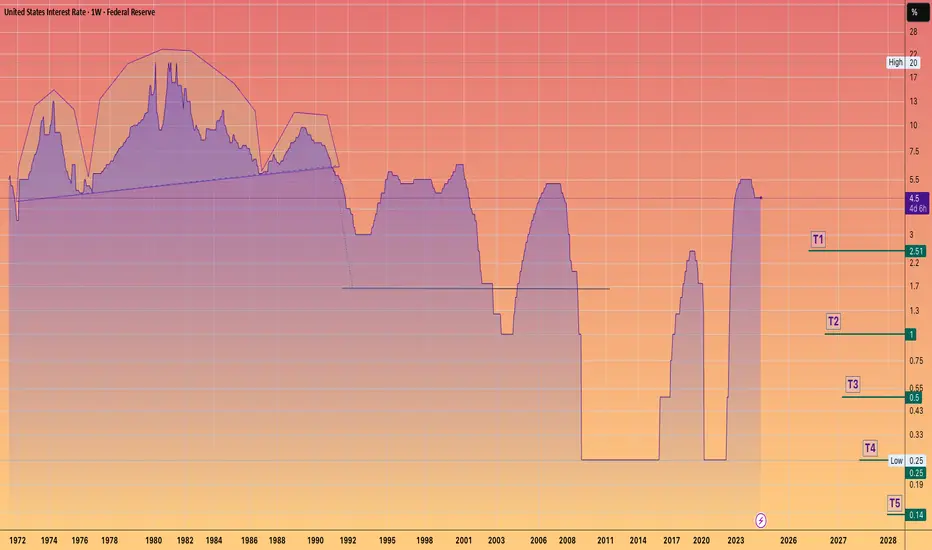
Fed expected to remain on hold and ‘likely’ a ‘Nothing Burger’It is widely regarded as a ‘sealed deal’ that the US Federal Reserve (Fed) will maintain the current target rate at 4.25% - 4.50% today, marking a fourth consecutive meeting on hold. This is likely to displease US President Donald Trump, who has repeatedly called for rate cuts, recently referring to the Fed Chairman Jerome Powell as ‘stupid’.
Despite Trump’s approach, I do not see a path where the central bank needs to cut rates today. While I would agree that the US economy is softening, it is not sufficient to ring alarm bells at the Fed. May’s inflation data were soft, suggesting stickiness and limited impact from tariffs, and domestic demand remains stable. Meanwhile, while the job market has demonstrated signs of weakening, the US remains at full employment. Couple this with vague trade policy and the recent escalation between Israel and Iran – with US involvement a possibility at this point – the Fed are unlikely to move on rates until later on in the year.
Markets are pricing in around two rate cuts this year (matching March’s Summary of Economic Projections ), targeting either the September or October meeting for the first 25-basis-point (bp) rate reduction. Were the Fed to throw a curveball and surprise markets by cutting rates by 25 bps today, it would trigger a sizable downside move in the US dollar (USD) and underpin a bid across the US equity market.
With that said, with a rate cut already baked in, the market’s focus will shift to the Fed’s rate statement, the press conference, and the updated SEP. Importantly, the fresh projections are the first out of the Fed since Trump’s ‘Liberation Day’ tariffs in early April.
Uncertain times
Uncertainty, although a somewhat overworked term at present, remains pertinent in today’s macroeconomic backdrop. Consequently, the Fed’s job of updating the dot plot (and the economic projections) is challenging. Like the market, Fed officials will struggle to gauge what the near-term future holds.
I would not be surprised to see Powell echo a similar sentiment to the one expressed at the March meeting. Nevertheless, it should not raise too many eyebrows to see the Fed adopt a more hawkish tilt in its updated projections, with a slight upward (downward) revision to inflation (GDP [Gross Domestic Product).
However, a marked change in direction in terms of lowering rates in the future from the Fed today is certainly something investors will be watching for, and could lead to increased volatility across major asset classes. If we see a dovish pivot, I will closely watch Spot Gold (XAU/USD), which has been hovering around all-time highs of US$3,500 for some time now.
Spot Gold trading at demand
A dovish scenario today could push the yellow metal towards the noted all-time high. As you can see from the chart below, daily flow has buyers and sellers squaring off within demand at US$3,343-US$3,392, which may provide enough of a floor to press higher today. In the event of a break south, the first port of call in terms of support would be at US$3,280, followed by another layer at US$3,208.
Written by FP Markets Chief Market Analyst Aaron Hill

Dollar In Fifth Wave-Reversal In Trend May Not Be Far Away.The Fed will announce its latest policy decision later, and expectations are that Powell will keep rates on hold, especially after last week's slightly higher inflation print and still solid US jobs data. We can see some stabilization in the US dollar ahead of this event, but we have to keep an eye on geopolitical tensions in the Middle East, which coudl also play a key role in driving safe haven flows.
Meanwhile, the stock market continues to trade sideways, and I don't expect any major breakouts or strong moves ahead of the Fed. Also, tomorrow is a holiday in the US, so that could contribute to slower market conditions into the end of the week, unless, of course, the situation in the Middle East gets worse.
Looking at the DXY waves structure, I see athree-wave move from the most recent lows, so the fourth wave I highlighted a few days ago could now be approaching completion near this week’s key resistance around the 99 level. That’s definitely a level to watch for a potential fresh, but possibly final sell-off toward new lows around 97, maybe even 96.
That’s where the DXY could stabilize, as ending diagonal pattern signals that we are likely in the late stages of wave five, meaning this bearish cycle could soon come to an end.

Tariff uncertainty keeps weighing on the dollar.
Geopolitical risks in the Middle East have eased slightly amid signs of potential negotiations, prompting markets to shift their focus back to the upcoming FOMC and tariffs. Following talks with Canadian Prime Minister Carney, President Trump stated that a trade deal with Canada could be reached within weeks, and also confirmed that a trade agreement with the UK has been signed.
Meanwhile, markets are almost certain that the Fed will keep rates unchanged at the upcoming FOMC, with the probability priced at 99.8%. Wells Fargo expects the inflation outlook to rise due to the delayed impact of higher tariffs, projecting that the year-end median federal funds rate will climb by 25bps to 4.125%.
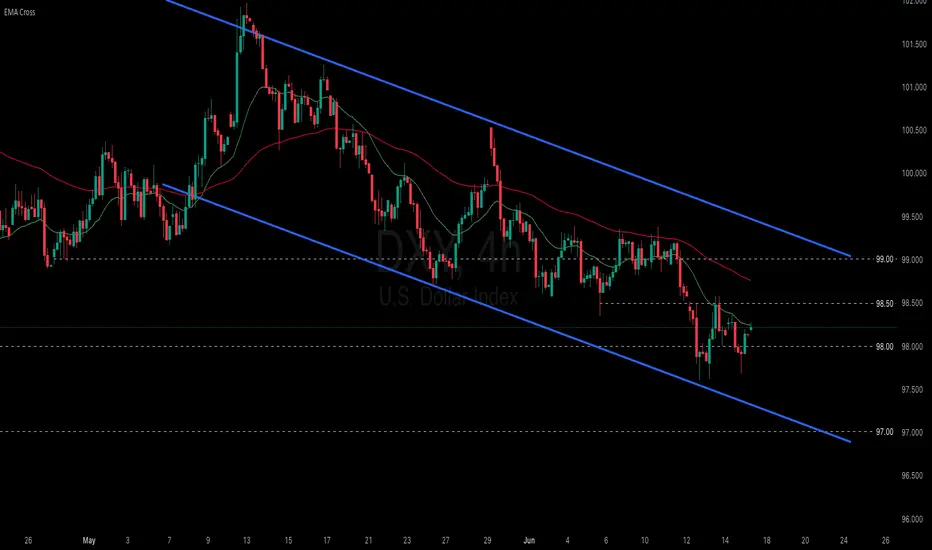
DXY is consolidating within the 97.50–98.50 range, remaining below both EMAs, which suggests a potential continuation of bearish momentum. If DXY breaks below the support at 98.00, the index may retreat to 97.50. Conversely, if DXY breaches above the resistance at 98.50 and the descending trendline, the index could gain upward momentum toward 99.00.
XAUUSD - Is the gold bullish trend over?!Gold is trading in its ascending channel on the four-hour timeframe, above the EMA200 and EMA50. We should wait for consolidation or not above the drawn trend line to determine the future path of gold, which can be entered after its failure in the formed line, and on the other hand, if gold corrects towards the demand zone, it can be purchased in the short term with appropriate risk-reward.
Over the past week, the gold market moved within a narrow, calm range and showed little reaction to encouraging inflation data—until geopolitical developments once again shifted the landscape. Heightened tensions in the Middle East brought safe-haven demand back to the forefront of traders’ minds.
Following initial reports of regional unrest, gold quickly climbed from $3,324 to a weekly high of $3,377. Although the price saw a brief correction down to around $3,345, it resumed its upward momentum and opened Thursday’s trading session just one dollar below the symbolic $3,400 mark.
Rich Checkan, President and CEO of Asset Strategies International, commented on these recent geopolitical developments, stating: “The market’s direction is clear: it’s upward. With tensions rising following Israel’s attack on Iran, there’s no doubt gold will continue its climb next week.”
Darin Newsom, senior analyst at Barchart.com, also pointed to rising risks both domestically and globally: “Gold is on an upward path. Domestic unrest in the U.S., escalating conflict in the Middle East, broad selling of the U.S. dollar by other countries, and expectations that the Federal Reserve will hold rates steady—all support gold’s rise.”
Meanwhile, Daniel Pavilonis, senior broker at RJO Futures, analyzed the simultaneous reactions of gold and oil amid the recent Middle East tensions, looking for clues on their future direction. He explained: “Oil’s behavior can serve as an indicator for gold, as both are seen as inflation hedges and are sensitive to bond yields.”
Surprised that gold hasn’t yet reclaimed its April highs, Pavilonis emphasized: “If tensions escalate further, we could see additional gains. But if Iran moves toward negotiations or a truce, gold could remain elevated but range-bound, similar to the past two months. Breaking previous highs would require a stronger catalyst and a more significant worsening of the crisis.” He noted that while geopolitical tensions are currently the primary driver of gold’s strength, such rallies are typically short-lived.
Pavilonis added: “We saw a similar pattern last April—gold and oil spiked sharply but quickly corrected. Back then, trade war concerns with China persisted, inflation rates had fallen noticeably, and the initial supportive factors for gold gradually faded. Now, once again, a fresh geopolitical shock has emerged that may temporarily drive gold higher.”
After a week where market attention focused mainly on U.S. inflation data, investors’ focus in the coming days will shift to central bank policy decisions and potential signals regarding the future path of interest rates.
The trading week begins Monday with the release of the Empire State Manufacturing Index, offering an early view of industrial activity in New York. That same day, the Bank of Japan will announce its latest interest rate decision, potentially setting a new tone for Asian markets and the yen’s value.
On Tuesday, U.S. May retail sales data will be published—a key indicator of consumer strength. Signs of weakness could bolster market expectations for a rate cut.
Wednesday will be the pivotal day, as the Federal Reserve reveals its rate decision. While markets have fully priced in a pause in tightening, attention will focus on Jerome Powell’s remarks for any hints of rate cuts in the coming months. Also on Wednesday, May housing starts data and weekly jobless claims will be released.
With U.S. markets closed Thursday for Juneteenth, the spotlight will shift to monetary policy decisions from the Swiss National Bank and the Bank of England, both of which could impact currency market volatility. The week wraps up Friday with the Philadelphia Fed Manufacturing Index, a leading gauge closely watched by traders to assess the health of the manufacturing sector in the U.S. Northeast.

Central banks dominate calendar this week: Will Fed surprise?A pack of central bank decisions is set to drive market direction this week, with the Bank of Japan (Tuesday), Federal Reserve (Wednesday), Swiss National Bank (Thursday), and Bank of England (Thursday) all scheduled to announce their latest interest rate decisions.
The Federal Reserve will, of course, take center stage.
Despite President Trump’s continued call for a 100-basis point rate cut, Fed officials are widely expected to keep rates unchanged. However, softer-than-expected CPI and PPI data from last week may provide scope for a surprise.
The U.S. Dollar Index (DXY) is trading just above the key support zone at 98.00, a level not seen since early 2022. A decisive break below this area could open the door to further downside, potentially targeting the 96.00 region. However, a surprise from the Fed could trigger a rebound toward the 100.50–101.00 resistance band.

EUR/USD Bulls in Control... But the Trap Is Set at 1.1600? 🇺🇸 EUR/USD – Technical & Macro Outlook
EUR/USD has posted an impressive rally over the past few weeks, driven by a combination of technical and macro factors. It is currently trading around 1.1586, right at the edge of a major supply zone where previous sharp rejections and reversals have taken place.
🔍 Technical Analysis
Price action remains within a well-defined ascending channel that began in mid-April, fueling the bullish move from the 1.07 lows.
The current daily candle is showing signs of exhaustion within the 1.1550–1.1600 resistance zone, with upper wicks and declining volume.
RSI is in a high-neutral zone but not yet overbought, leaving room for more upside — but also increasing the probability of a technical pullback.
🔁 Key Levels:
Primary resistance: 1.1600 (multi-touch supply area)
Support 1: 1.1460–1.1430 (previous resistance, now potential support)
Support 2: 1.1300–1.1270 (demand zone + channel base)
📉 COT Report – June 3, 2025
Non-Commercials (speculators) remain net-long with over 200,000 contracts, though both long (-1,540) and short (-4,830) positions saw reductions. This suggests a bullish structure with early signs of profit-taking.
Commercials are heavily net-short, with 575,000 short contracts versus 437,000 long — a structurally bearish stance from physical market participants.
Open interest increased significantly by +20,813, pointing to renewed speculative participation and potential volatility.
🧭 Retail Sentiment
Retail traders are heavily short (80%) with an average entry around 1.1253.
This contrarian behavior is typically supportive of continued upside pressure — especially if price holds above key supports.
📅 Seasonality – June
Historical averages over 10, 15, and 20 years show a slightly bullish tendency in June.
The 2- and 5-year patterns suggest more neutral to mildly bearish behavior.
This supports a consolidation or corrective pullback, without ruling out higher moves during the summer rally.
🎯 Trading Conclusion
Current bias: Moderately bullish, with rising pullback risks near 1.1600
Possible setup: Tactical short between 1.1580–1.1610 if confirmed by bearish price action
Target: 1.1430–1.1300
Bullish scenario remains valid unless we break below 1.1270
📌 Summary
The bullish trend is strong but technically extended. Speculative positions remain net-long but are starting to unwind. The retail crowd is still betting against the move, which favors bulls. However, structural resistance calls for caution — a pullback could be imminent.

Massive GBP/USD Reversal Ahead? Head & Shoulders FormationGBP/USD is at a critical technical juncture following a sharp bullish impulse that pushed the pair above the 1.34 handle, printing a strong weekly bullish engulfing candle and breaking out of a multi-week consolidation zone. This move unfolded in a macro context where the U.S. Dollar Index (DXY) is showing clear signs of weakness, with Non-Commercial net long positions dropping drastically—from around 20,000 to less than 5,000 contracts. This shift points to a fading speculative appetite for the dollar, historically a leading indicator of upcoming corrective phases or broader declines in the DXY.
On the flip side, the Commitments of Traders (COT) report on the British Pound reveals that Non-Commercials (typically hedge funds and asset managers) remain net long on GBP, with a slight increase week-over-week. However, Commercials (generally institutions and hedgers) have aggressively built up a significant net short position—levels that in the past preceded major reversals on the pair. This divergence between speculators and institutional hedgers suggests short-term bullish potential, but with rising risk of exhaustion near current resistance levels.
Adding fuel to this outlook is the retail sentiment: approximately 63% of retail traders are currently short GBP/USD, with an average entry price around 1.3021. This kind of retail crowd positioning, typically inefficient from a historical perspective, adds contrarian support for further upside, as long as price holds above the 1.3340 structure.
From a seasonality perspective, June tends to be a mildly bullish-to-sideways month for GBP/USD, especially when looking at the 10- and 15-year seasonal averages. While the seasonal bias is not particularly strong, there’s also no statistical downward pressure this time of year, leaving room for technically-driven moves influenced by liquidity and sentiment rather than macro patterns alone.
On the technical front, the daily chart shows a steep rally capped by a large green candle on Monday, breaking cleanly through the 1.34 resistance zone. The price is now hovering inside a key supply area between 1.3499 and 1.3550—a historically reactive zone that has triggered major rejections in previous months. How price reacts here will likely shape the next major swing. A confirmed breakout and consolidation above 1.3550 would open the door for an extension toward 1.37–1.3750. Conversely, a sharp rejection followed by a break below 1.3412—and especially under 1.3340—would set the stage for a deeper correction toward 1.3170.
The RSI is currently showing early signs of momentum loss, although no strong bearish divergence has emerged yet. This implies that the pair could still fuel another push higher before running out of steam—possibly forming the right shoulder of a head & shoulders pattern if the rejection scenario plays out.

GBPJPY At the Top? Massive Liquidity Grab📈 1. Price Action & Key Technical Levels (Daily Chart)
Price reached a major supply zone between 196.0 and 197.0, showing clear rejection (weekly pin bar and a lower high structure relative to the previous peak).
The long-term descending trendline acted as resistance again.
A confirmed rising wedge pattern broke to the downside, with first target around 191.4, and extended target near 187.4 (key demand zone with historical confluence).
Weekly RSI shows a bearish divergence vs price highs – an additional signal of bullish exhaustion.
📊 2. COT Data (as of June 3, 2025)
GBP (British Pound)
Net long positions increased by +30,371 contracts (Commercial + Non-Commercial).
Non-Commercials: 103,672 long vs 68,457 short → net long +35,215 but the increase is relatively modest.
Commercials are increasing both long and short positions, but the net delta supports medium-term GBP resilience.
JPY (Japanese Yen)
Net short worsened by -13,566 contracts.
Non-Commercials are cutting longs and adding shorts → aggressive yen selling.
Commercials remain heavily short (275,659 vs 100,151 long).
➡️ COT Conclusion: GBP remains structurally strong, but the JPY is now extremely oversold, increasing the likelihood of a technical correction in favor of JPY (GBPJPY pullback).
📉 3. Retail Sentiment
72% of retail traders are short GBPJPY, with an average entry at 191.2.
Current price is above 195.8 → a liquidity sweep above retail shorts may have already occurred.
The order book shows a heavy sell cluster between 195.0–195.9 → potential zone of manipulation/liquidation.
➡️ Contrarian view: After sweeping liquidity above retail highs, we may now see downside pressure to clean out breakout longs.
📅 4. Seasonality
June tends to be neutral to bearish:
5-year average: +0.45% (weak gain)
10- and 15-year averages: -1.24% and -1.30%
Historically, the first 10 days of June often mark a local top, followed by a decline – consistent with the current price structure.
🧠 5. Macro-Technical Confluence
The broader setup points to a distribution phase between 195.5–196.5, with high probability of a technical pullback toward 193.5–191.4 in the short-to-medium term.
The yen's oversold conditions may ease temporarily, supporting a corrective GBPJPY retracement.
Break below 193.5 would confirm the move toward 191.4 and eventually 187.4 – an area of institutional interest.
🔍 Trade Setup Summary (Bias: Bearish)
Technical context: Short setup confirmed by structure break, divergence, and supply rejection.
Macro/sentiment context: Supports a corrective pullback on the pair.
Strategy: Look for intraday weakness below 195.0–194.5 → targeting 193.5, then 191.4.
Invalidation: Daily/weekly close above 197.0.

NQ100 → Entering the Danger Zone?📈 1. Technical Context (Price Action & Structure)
The daily chart shows a strong bullish continuation from the 17,350 area, with price now extending toward the 22,000 USD zone.
We are currently within a weekly/monthly supply, with:
Mild RSI divergence in overbought conditions
Temporary rejection at 22,050–22,200
A potential liquidity sweep above highs before distribution or pullback
The monthly structure shows a strong swing low that may serve as anchor for a future reversal
🧠 2. COT Report – Commitment of Traders (as of June 3)
Commercials (Smart Money):
+4,041 long | +3,320 short → Net +1,455 → hedging phase, not trend expansion
Non-Commercials (Speculators):
–2,237 long | +125 short → net exposure reduction
Open Interest increasing → new positions building, but no extreme imbalance
📌 Conclusion: Tactical neutrality, slight bullish lean from commercials.
📆 3. Seasonality
June has been historically bullish, especially in the past 2 years (+700 pts avg)
10Y average still leans bullish
⚠️ September is a clear seasonal reversal month across all timeframes
📌 Conclusion: Seasonal tailwind through end of June; cyclic reversal risk into Q3.
📰 4. Macro Calendar
High-impact USD week:
CPI – Wed, June 11
PPI – Thu, June 12
These will be critical to:
Validate the disinflation narrative
Set expectations for a Fed cut by Sep/Nov
📌 Conclusion: Expect explosive mid-week volatility — watch for liquidity spikes above 22,000 if CPI surprises.
⚙️ Operational Outlook
✅ Primary scenario (bullish continuation):
🎯 Target: 22,260 → fib extension + structure
❌ Invalid below 21,350
🔄 Alternative scenario (mean reversion):
🔻 Short from 22,050–22,200
🎯 Target: 20,950 → liquidity + FVG zone
🔁 Trigger: weekly engulf or hotter-than-expected CPI

Volatility Incoming - But Price Will Say WhenKey levels on SPX and NDX
5905 big gamma level and hedging level for June 30 monthly and quarter expiration
DXY watching for potential bear trap and range trade
Gold, Silver, Bitcoin and others all discussed
Thanks for watching!!!

Cocoa Bounce From Demand – Can This Lead to a New 2025 High?On June 11th, price reacted sharply to a key demand block around the 8,880–9,000 zone, which aligns with:
Golden Pocket Fib (0.705–0.78) between 8,420 and 9,006
The midpoint of a previous consolidation range
A liquidity sweep followed by a strong bullish rejection
The RSI is showing a bullish divergence (lower lows on price vs rising RSI), which supports a possible technical rebound.
🟣 Immediate target: 10,400–10,600 (supply zone)
🔴 The bullish bias would be invalidated on a close below 8,850
📈 Commitments of Traders (COT) – as of June 3, 2025
Non-Commercials (speculators): still net long, but reduced their long exposure by -2,006 contracts, and trimmed shorts slightly as well
Commercials: remain heavily net short with over 61,000 contracts (61.4% of OI), indicating ongoing hedging by producers
Open Interest dropped by -1,257 → a sign of general position liquidation
➡️ The reduction in speculative longs likely reflects profit-taking after the May rally, but overall net positioning remains bullish on a medium-term view.
📅 Seasonality – June
On the 20, 15 and 10-year averages, June typically shows a moderately bullish rebound, often following weakness in May.
On the 5 and 2-year views, however, performance is more neutral to slightly negative.
Historically, June acts as a consolidation or pre-rally month, often preceding a stronger uptrend in July–August.
🧠 Operational Outlook
Bias: Moderately bullish in the short term, with potential recovery toward 10,400. Structure still shows signs of broader distribution, so caution remains in the medium term.
🎯 Trade idea:
Aggressive long initiated on the bounce from demand
First target: 10,400
Breakout extension: 11,200
Invalidation on daily close below 8,850

BTC: Strong bullish trend, key resistance 111–112k in focus__________________________________________________________________________________
Technical Overview – Summary Points
__________________________________________________________________________________
Strong bullish momentum across all timeframes (1D to 15min).
Major supports: 100335, 104940, 106743 – multi-timeframe confluence, natural risk management levels.
Key resistances: 109952 – 111949 (historical pivot zones).
Risk On / Risk Off Indicator clearly favoring "Risk On" (strong buy). Tech sector in leadership mode, favorable context.
Volumes normal to moderately elevated, no major behavioral anomalies (ISPD DIV neutral).
No significant divergence between technical and behavioral indicators detected.
__________________________________________________________________________________
Strategic Summary
__________________________________________________________________________________
Overall bias : firmly bullish, but tactical caution just below 111,000–112,000.
Opportunities : prioritize buys/reloads on pullbacks to 104,900–100,300.
Risk zones : clean break below 103.7k ⇒ risk of acceleration to 95.6k; invalidation if daily close <103,700$ or >2 sessions <97,100$.
Macro catalysts : Fed decision (06/18), US CPI (06/12), Trump speech (06/10); anticipate higher volatility.
Action plan : engage tactically below resistance; recommended swing stop-loss at $97,000; active management after each catalyst event.
__________________________________________________________________________________
Multi-Timeframe Analysis
__________________________________________________________________________________
1D : Massive support 100k-103k, critical resistance 111–112k. Robust momentum and context, no behavioral overheating.
12H : Steady staircase progression, intermediate supports respected (104940–106743), healthy volumes, ongoing up-trend.
6H : Bullish background, no excessive flow or defensive behavioral signals.
4H : Resistance zone test (111949–109952), structure remains solidly up, no reversal detected.
2H : Slightly rising volumes on resistance test, no behavioral excess. Positive momentum.
1H : Active resistance test, moderate volumes. Bullish structure intact.
30min : Micro-consolidation below resistance, no excessive volume/behavior. Trend up.
15min : Volume spike on last upward move, rapid normalization. Reload possible if breakout above 110k is confirmed.
Multi-timeframe summary : Bullish confluence, no strong reversal signal as long as support at 103.7k holds.
Risk On / Risk Off Indicator : Strong buy, tech sector leading, no structural risk detected in capital rotation.
__________________________________________________________________________________
Synthesis & Decision-Making
__________________________________________________________________________________
Dominant structure : BTC market structurally bullish, supported by multi-timeframe converging supports and solid tech sector.
No behavioral anomaly (ISPD DIV neutral); volumes under control; only vigilance below 111–112k due to matured seller pressure.
Macro context : Fed’s rates unchanged expected, major catalysts nearing with potential for significant volatility.
On-chain analysis : active distribution from long-term holders, critical area 103.7k–97.1k, demand must absorb “long-duration” supply.
Trading recommendation : favor buys/reloads on pullback (104,900–100,300); tactical caution under 111–112k; swing stop-loss at $97,000 advised.
BTC structurally bullish, but approaches a critical phase: robust multi-timeframe supports, positive macro momentum, no excessive behavioral exuberance. Heightened vigilance required below 111–112k due to pressure from long-term holders; dynamic risk management needed around major macro events.
__________________________________________________________________________________

EURJPY Bulls in Trouble? Massive Rejection Signals📉 Full Multi-Factor Analysis – EUR/JPY
🔍 1. Price Action
EUR/JPY strongly rejected the key supply zone between 164.80–165.50, aligned with a major static resistance.
Last week's breakout was invalidated by a clear bull trap, followed by a bearish engulfing candle.
Price broke below the ascending channel drawn since April and is now heading toward the 162.00 demand area.
The weekly RSI shows a bearish divergence, confirming a slowdown in momentum.
➡️ Technical Bias: Bearish toward 161.50–162.00, with a possible extension to 160.00.
💼 2. COT Data – Commitment of Traders
EUR Futures (CME)
Strong increase in commercial longs (+16,095) and non-commercial shorts (+4,830).
Suggests smart money is accumulating while retail/speculators are pressing shorts — potential accumulation, but no breakout yet.
JPY Futures
Significant rise in non-commercial shorts (+10,575), while long positions declined.
The yen remains pressured, but extreme positioning could fuel a reversal if sentiment flips.
➡️ COT Takeaway: Euro remains in bullish consolidation. Yen is heavily oversold — ripe for mean reversion. Caution warranted.
📊 3. Retail Sentiment
80% of retail traders are short from an average price of 160.46, while price now sits at 164.86.
The crowd is deep in drawdown — a typical condition for short-term consolidations or fakeouts before reversals.
➡️ Implication: Price may hover around 164+ to trap remaining retail shorts before unwinding.
📈 4. Seasonality
June seasonality for EUR/JPY is historically neutral to bearish.
Only the 5-year data shows strength, while 15Y and 20Y trends reveal consistent downside starting mid-June.
➡️ Seasonal Outlook: Adds further weight to a bearish correction scenario for the second half of the month.
✅ Actionable Summary
📌 Weekly Bias: Bearish
📉 Main Target: 162.00–161.50
📉 Extended Target: 160.00
📈 Invalidation: Weekly close above 165.60
🧠 Final Thoughts
All major elements — price action, COT, sentiment, and seasonality — point toward a corrective move on EUR/JPY.
Given the strong underlying trend and retail’s positioning, watch out for bull traps before deeper downside.
Best setup: Sell the pullback or wait for clean breakdown below 163.00.

GBPNZD Ready to Flip? Key Reversal Zone in Play🔹 1. Price Action and Technical Structure
Price is currently at 2.2405, declining from the recent high in the 2.26–2.28 area.
The pair completed a descending channel with potential for reversal. A bullish reaction is taking place from the 2.2280–2.2170 demand zone, supported by previous volume spikes.
The RSI is falling, nearing oversold territory but not yet at extreme levels.
Possible technical scenarios:
Bullish: Recovery toward 2.2560–2.2600, with a potential breakout above recent highs.
Bearish: A break below 2.2170 could trigger further downside toward 2.2000 and 2.1800.
🔹 2. Seasonality (June)
NZD
June tends to be slightly positive for NZD (average: +0.0011 over 20 years), with consistent monthly patterns.
GBP
June is historically neutral to negative for GBP (average: +0.0015 over 20 years, but negative over 5 and 2 years).
➡️ This implies a seasonal edge for NZD over GBP.
🔹 3. Retail Sentiment
60% of retail traders are long on GBPNZD.
40% are short, but long positions average 2.1874, currently in profit.
➡️ This presents a mild contrarian bearish pressure, due to crowding on the long side.
🔹 4. Commitment of Traders (COT) – Institutional Positioning
GBP (as of 2025-06-03)
Commercials Net Long: +74.5K
Non-Commercials Net Short: -11.3K
Weekly changes: +30.3K longs vs. +32.6K shorts
➡️ Moderate balance, but growing speculative short interest.
NZD (as of 2025-06-03)
Non-Commercials Net Short: -23.6K
Strong weekly increase in commercial longs (+6.4K) and total long flows
➡️ NZD is seeing renewed interest from commercial players — a potential bullish signal.
🔹 5. Trading Outlook
📌 Current Bias: Neutral with short-term bearish tilt, but medium-term bullish reversal risk rising.
➤ Potential setups:
Conservative Long Entry: On bullish confirmation at 2.2170 (double bottom or bullish engulfing), target 2.2560–2.2600
Aggressive Short Entry: On pullback to 2.2490–2.2560, with stop above 2.2620, target 2.2280–2.2170
🎯 Seasonal and institutional factors favor NZD strength, but technical structure calls for caution and confirmation.

Bitcoin - Bitcoin holds $100,000 support?!Bitcoin is above the EMA50 and EMA200 on the four-hour timeframe and has broken out of its short-term descending channel. We can look for Bitcoin short positions from the supply zone. If this corrective move occurs, we can also look for Bitcoin long positions in the demand zone.
It should be noted that there is a possibility of heavy fluctuations and shadows due to the movement of whales in the market and capital management in the cryptocurrency market will be more important. If the downward trend continues, we can buy in the demand range.
Bitcoin network transaction activity has dropped to its lowest level since October 2023. According to data from The Block, the seven-day moving average of Bitcoin transactions has recently declined to 317,000—marking the lowest point in the past 19 months. This decline comes at a time when Bitcoin’s price still hovers near its all-time highs.
Meanwhile, Bitcoin Core developers have recently stated that network nodes should not block the relay of low-fee or non-standard transactions if miners are willing to process them. This highlights a shift in Bitcoin’s policy direction and indicates a growing acceptance among some miners of lower-cost transactions.
In certain instances, miners’ appetite for transaction fees appears to have diminished. Mononaut, founder of the Mempool project, pointed out that a transaction with an almost-zero fee was recently included in a block. This could signal reduced network activity or a declining need among miners to prioritize high-fee transactions.
Currently, only 0.3% of American investors’ total assets are allocated to Bitcoin. Real estate dominates their portfolios, followed by bonds and stocks.This means that Bitcoin accounts for a very small portion of U.S. investor wealth. However, if even a small fraction of capital currently tied up in real estate, stocks, or bonds shifts into Bitcoin in the future, it could have a substantial market impact—an encouraging sign over the long term.
The United States has emerged as the dominant force in the Bitcoin ecosystem. A report by River outlines how this dominance has reached its peak. The U.S. holds nearly 40% of the total Bitcoin supply, and American companies account for a staggering 94.8% of public Bitcoin ownership. Additionally, 82% of development funding and approximately 79.2% of Bitcoin ETF ownership originate from the U.S. The country also commands about 36% of the global hash rate.
Since 2021, the total value of Bitcoin mined by American companies has reached $42.6 billion, accompanied by over $30 billion in investment into Bitcoin mining infrastructure. The U.S. now hosts more than 150 Bitcoin-related companies and 40 mining sites with capacities exceeding 10 megawatts.
Today, nearly two-thirds of all Bitcoin in circulation is held by individuals who rarely—or never—sell their coins. In just the last 30 days, roughly 180,000 Bitcoins have been moved to wallets with historically low selling activity. Meanwhile, whales continue to accumulate Bitcoin at price levels above $100,000.

NAS100 - Will the stock market reach its previous ATH!?The index is above the EMA200 and EMA50 on the 4-hour timeframe and is trading in the specified pattern. In case of a valid break of this range, I expect a new trend to form. It is better to wait for confirmation on the break in order to control further risk.
U.S. President Donald Trump announced that an American delegation will meet with Chinese representatives in London on June 9 to discuss a potential trade agreement. In a post on Truth Social, Trump stated, “I’m pleased to announce that Treasury Secretary Scott Bessent, Commerce Secretary Howard Lutnick, and U.S. Trade Representative Jamieson Greer will meet with Chinese officials on Monday, June 9, 2025, in London to discuss a trade deal.” He added that he expects the meeting to go “very well.” U.S. stock markets rose on Friday, and Chinese markets are now following suit. The Hang Seng Index has reached its highest level since March.
Meanwhile, Amazon has completely halted its hiring budget for office workers in its core retail business. This decision applies only to white-collar staff and excludes warehouse employees and those in its cloud computing division. According to Business Insider, which cited internal company emails, the hiring freeze affects Amazon’s online marketplace, logistics operations, and grocery business.
Having doubled its workforce between 2019 and 2021 to 1.6 million, Amazon reduced that number to 1.55 million last year. Since late 2022, the e-commerce giant has laid off at least 27,000 employees.
This move comes as the U.S. jobs report released Friday helped ease some concerns, though signs of broader economic challenges remain. Experts suggest that such a hiring freeze could reflect broader economic trends—where mass layoffs are avoided, but hiring slows down significantly.
In May, the U.S. economy added 139,000 jobs, down from 147,000 in April. The unemployment rate remained steady at 4.2%, staying within the narrow range it has held over the past year. The labor market has remained resilient, dismissing fears that tariffs would cause a significant slowdown. So far, tariff-related disruptions have not been severe enough to destabilize the job market—at least not in May.
Data indicates that employers continue to refrain from layoffs, even as hiring has slowed considerably compared to the post-pandemic surge. Labor market analysts expect signs of weakness to emerge in the coming months, as businesses become more cautious about hiring due to uncertainty surrounding tariffs—according to recent surveys. For now, however, the labor market remains strong.
The absence of red flags in employment may give the Federal Reserve more room to maintain its patient stance on interest rate cuts. This year, Fed officials have kept interest rates higher than average to curb inflation by increasing borrowing costs. The Fed’s dual mandate is to keep inflation low and employment high, and it may opt to cut rates to stimulate the economy if the labor market weakens.Fed Chair Jerome Powell and other FOMC members have said they are waiting to see whether President Trump’s trade wars will stoke inflation, trigger job losses, or both. So far, neither scenario has materialized. Strong labor market data may give them further justification to stay in wait-and-see mode. Rosner wrote, “Given the Fed’s sharp focus on inflation risk management, today’s stronger-than-expected jobs report is unlikely to alter its patient approach. We expect the Fed to remain on hold at this month’s meeting and believe further deterioration

GBP/USD Is This the Last Dip Before 1.37?🔹 1. Price Action & Technical Structure (Weekly & Daily Charts)
Price has broken above the ascending channel highlighted on the weekly chart.
The 1.3545 area is currently acting as dynamic resistance — a weekly close above it is crucial to confirm a breakout.
Below, we find a bullish order block (demand zone) around 1.3340 – 1.3280, aligning with the 0.5 Fibonacci level.
RSI is neutral, showing no bearish divergence at the moment.
🔹 2. COT Report (Commitment of Traders)
USD Index:
Non-commercial traders: +823 new longs, +363 new shorts → Neutral to bullish positioning.
Commercials remain net short, indicating short-term USD strength potential.
EUR FX (inverse proxy for USD):
Significant reduction in speculative long positions → Less bullish pressure on the Euro, favoring USD strength.
🔹 3. Sentiment
67% of retail traders are short GBP/USD vs. 33% long.
This is a bullish contrarian signal, suggesting potential continuation toward the 1.36–1.37 zone.
🔹 4. Seasonality
Historically, June tends to be bearish for GBP/USD over the past 5–10 years.
However, the first 10 days of the month often start with bullish momentum before correcting in the second half.
🔹 5. Economic Calendar
Today: Construction PMI (GBP), ECB Press Conference (EUR), Unemployment Claims (USD).
Tomorrow: High potential volatility across all USD pairs.
Watch out — upcoming macro data may strongly impact breakout confirmation.
🔹 6. Operational Outlook
Primary Bias: Neutral/Bullish with potential for a technical pullback.
📍 Key Levels:
Resistance: 1.3545 – 1.3593 (Supply zone + 0.0 fib)
Support: 1.3340 – 1.3280 (OB + 0.5/0.618 fib)
🧠 Scenario 1 – Bullish Continuation:
Retest of 1.3340 → long targeting 1.3590 / 1.3680
Confirmation on daily close above 1.3550
🔻 Scenario 2 – Bearish Retracement:
Rejection below 1.3550 + USD macro strength → drop toward 1.3280
If that breaks → extended move to 1.3170 / 1.3150

Corn at the Cliff Edge: Bearish Breakdown or Smart Money Trap?📉 1. Price Action & Technical Context (Weekly Chart – ZC1!)
Price is currently sitting around 439'0, after rejecting the 462'2 supply zone (gray block) and confirming rejection from the macro supply area between 472'6–480'0 (red block).
The last four weekly candles show a failed recovery attempt (three green candles trapped between two strong red ones), culminating in a bearish breakout below the intermediate demand zone (445'0–442'0).
Now, price is back inside the key demand zone between 439'0–433'4, an area with heavy volume and previous significant lows.
🔍 Technical takeaway: Bearish breakout confirmed. Price is testing the last major weekly support before opening the door toward the yearly lows (~420'0).
📊 2. Commitment of Traders (COT Report – May 27, 2025)
Non-Commercials (Speculators):
Long: 324,377 (▼ -17,952)
Short: 344,710 (▼ -9,171)
Net Position: -20,333 → Bearish, but the unwinding of both sides suggests profit-taking.
Commercials (Institutions):
Long: 766,211 (▲ +12,588)
Short: 713,647 (▼ -962)
Net Position: +52,564 → Increasing → Institutional accumulation.
🔎 Key observation: Commercials are increasing their net longs, while speculators are reducing exposure. This diverges from price action and may signal institutional accumulation under 440.
📉 3. Net Positioning vs Price (COT Chart)
The chart shows a clear decline in speculative longs since March, with a new low this week.
Meanwhile, commercials are gradually increasing their long exposure, positioning themselves against the current bearish trend.
💡 Combined view: While price keeps dropping, the "smart money" is accumulating → possible bottom forming, though not yet confirmed technically.
🌾 4. Seasonality
June Performance:
20-Year Avg: -4.25%
15-Year Avg: +12.31%
5-Year Avg: +1.15%
2-Year Avg: +28.61%
📈 Seasonal Conclusion: The seasonal bias has turned strongly bullish in the last 2–5 years. June–July is often a rally period for Corn following the late-May bottoms — likely tied to U.S. planting season dynamics.

EUR/USD Reversal Imminent? 5 Powerful ReasonsEUR/USD – Tactical Bearish Outlook Ahead of Key Reversal
EUR/USD is approaching a critical inflection point where multiple technical and fundamental signals are aligning to suggest a potential short-term reversal.
📉 1. Price Action & Technical Structure (1W / 1D)
The pair recently completed a clean bullish structure inside an ascending channel, originating from the 1.0600 demand zone and reaching into the key supply area between 1.1400–1.1550.
Recent price behavior indicates:
A weekly candle with a strong upper wick, signaling institutional rejection.
A visible RSI bearish divergence, showing weakening momentum.
The most recent daily candle broke below the channel, suggesting a potential swing high.
Implication: A short-term reversal is likely, targeting the 1.1180 zone, with an extended move potentially reaching the 1.1050–1.1000 area.
🧠 2. COT Data – Institutional Positioning
USD Index:
Non-Commercials increased longs (+823) and slightly increased shorts (+363) — net bias still bullish USD.
Commercials also added to longs, further confirming institutional accumulation.
→ USD strength building.
EUR Futures:
Non-Commercials reduced longs (-1,716) and added shorts (+6,737).
The net long position in EUR continues to weaken.
→ Increasing risk of EUR retracement.
📅 3. Seasonality – EUR/USD in June
EUR/USD tends to be neutral to bearish in June.
The 5- and 10-year averages show consistent early-month declines, supporting a short bias in the first two weeks.
📊 4. Retail Sentiment
Sentiment is currently evenly split (50/50).
However, more volume is positioned long — a potential contrarian signal.
→ A break in this balance may trigger volatility and directionality.
🧭 5. Macro Context
Eurozone is facing stagnation, with falling inflation and weak growth.
U.S. data remains stronger, supporting the Fed’s “higher for longer” narrative.
→ This divergence favors a stronger USD in the near term.
✅ Trading Outlook
📉 Current Bias: Bearish (corrective)
📌 Short-Term Target: 1.1180
📌 Mid-Term Target: 1.1050–1.1000
❌ Invalidation: Weekly close above 1.1460
🎯 Strategy: Look for intraday rejection confirmations and sell pullbacks, in alignment with HTF structure and institutional flows.

USD/CHF Setup Breaking Down: Don’t Get Caught Long This TrapUSD/CHF is currently trading at a critical technical and macro-structural juncture. Price is hovering within the weekly support area between 0.8050 and 0.8200, a zone that has historically triggered significant bullish reactions. However, the latest weekly candle closed below the psychological 0.8200 level, showing a clear rejection of upper resistance and signaling a lack of buying strength on the U.S. dollar side. This weak closure undermines the bullish structure and opens the door for a potential continuation of the downtrend—especially if price breaks below the 0.8150 mark on the daily or H4 timeframe.
From a seasonal standpoint, June has historically been a bearish month for USD/CHF. Monthly average returns over the past 20, 15, 10, and 5 years confirm steady downside pressure on the dollar against the Swiss franc. Only the 2-year average shows a slight positive bias, but it remains an outlier against the broader seasonal trend. This supports the idea that the recent weakness is not only technical but also cyclical in nature.
The Commitment of Traders (COT) report reinforces this bearish view. On the Swiss franc side, commercial traders (typically the most informed and hedging-oriented participants) are heavily net long, while non-commercial traders (speculators) remain significantly net short. This imbalance is often seen around reversal points and may indicate rising CHF strength. On the U.S. dollar side, positioning is far more balanced—the Dollar Index COT shows a neutral stance, with non-commercials slightly net long but without any dominant momentum. This confirms there’s currently no structural strength behind the dollar to justify a meaningful rebound in USD/CHF.
Lastly, retail sentiment provides a classic contrarian signal: over 90% of retail traders are long on USD/CHF, with only 10% short. This extreme imbalance typically occurs ahead of bearish breakdowns, as institutional players tend to fade overcrowded retail positions.
In conclusion, USD/CHF remains vulnerable to further downside. The weekly price action is weak, seasonal trends are dollar-negative, COT positioning favors CHF strength, and retail sentiment is extremely long-biased. All factors align toward a likely bearish continuation, with technical targets in the 0.8080–0.8050 range. The only alternative scenario would require a strong H4/H1 bullish reaction with a reclaim of 0.8220—but at this stage, that appears unlikely without a major macro catalyst.

Bitcoin at a Crossroads: 110k RejectionAfter the powerful rally that began in the last quarter of 2024, Bitcoin is now at a critical market juncture. The price has once again reached the 106,000–110,000 USD zone, an area that already showed strong signs of distribution back in February and March 2025. This isn’t just a typical resistance level—it’s a psychologically loaded zone, marked by previous highs and repeated selling pressure.
In May, the monthly candle revealed a clear rejection from this zone: a prominent upper wick and a bearish body, signaling the bulls' struggle to sustain new highs. This behavior suggests the beginning of a profit-taking phase or, more likely, a medium-term consolidation.
The picture becomes even more complex when we look at the COT Report dated May 27, 2025. Non-commercial institutional traders—speculative funds, hedge funds, and portfolio managers—have significantly increased their short positions, now exceeding 26,800 contracts. Meanwhile, long positions are hovering around 24,500, resulting in a net bearish exposure. The message is clear: smart money isn’t buying the breakout—it's selling into it.
Seasonality analysis reinforces this narrative. Historically, June tends to be a weak month for Bitcoin, often followed by renewed strength in the next quarter. The 2025 seasonal curve has mirrored the bullish pattern of 2021 up to May, but now—consistent with historical patterns—is showing signs of slowing. This supports the idea that the market might need a breather before potentially rallying again in Q3.
From a technical standpoint, the key levels are well defined. The 95,000–97,000 USD area is the first dynamic support zone, where the price might find short-term relief. However, the more significant support lies between 82,000 and 85,000 USD—this is the origin of the current rally and aligns with the old breakout structure. A return to this level would represent a healthy and natural correction within a still structurally bullish long-term context.
In summary, the current outlook calls for caution. Momentum is fading, seasonality is unfavorable, and institutional players are trimming long exposure while adding to shorts. Until the price can consolidate above 110,500 USD, the dominant scenario remains a corrective pullback, with interim targets at 95k and potential drops toward the 85k zone.
However, if the market surprises with a strong weekly close above the highs, it could pave the way for a new leg up toward the 125,000–135,000 USD range—potentially fueled by macro catalysts such as ETF inflows, Fed narratives, or broader adoption.

XAUUSD - Gold awaits NFP!Gold is trading in its ascending channel on the hourly timeframe, between EMA200 and EMA50. We should wait for a valid breakout of the pattern we identified yesterday, from which we had a Fick break above. We can enter the trade after it breaks in the formed pattern, and on the other hand, if gold corrects towards the demand zone, we can buy it in the short term with a reward at an appropriate risk.
Gold came under downward pressure amid renewed optimism regarding U.S.-China trade talks. Although prices surged to a four-week high earlier in the day due to strong demand from Asian and European buyers, a wave of selling during U.S. trading hours reversed part of that gain.
This shift in momentum coincided with rising U.S. Treasury yields and a boost in market sentiment following a phone call between the presidents of China and the United States. While no official statement has been issued yet, the decision to initiate a new round of high-level negotiations was seen as a positive signal. In recent months, gold has become a key indicator for gauging geopolitical and trade-related risks, having previously surged to an all-time high of $3,500 after the “Freedom Day” tariffs were implemented.
Despite ongoing concerns over Ukraine, Iran, and the growing U.S. fiscal deficit—which provide fundamental support for gold—the metal’s inability to break above the key resistance level of $3,437 has cast doubt on the short-term bullish outlook.
Meanwhile, Goldman Sachs has projected that the upcoming U.S. nonfarm payrolls (NFP) report for May will show a 125,000 increase in jobs. The unemployment rate is expected to remain steady at 4.2%, and monthly wage growth is estimated at 0.3%. The bank also anticipates a 10,000-job decline in the public sector, largely due to tariff-related policies and reduced hiring. Overall, Goldman Sachs expects the report to be balanced and free of surprises, which should encourage the Federal Reserve to maintain its current policy stance.
Although gold has managed to stabilize above $3,000 per ounce in recent weeks, many investors remain focused on reclaiming the historic peak reached in April. According to one research firm, it’s only a matter of time before that level is tested and broken again.
In the annual “Gold Focus 2025” report published Thursday by the UK-based firm Metals Focus, analysts stated that gold retains strong momentum for further gains in 2026. They forecast that the average gold price this year could reach an unprecedented $3,210, with new highs likely in the second half of the year.
In an interview with Kitco News, Metals Focus CEO Philip Newman said it is difficult to envision a scenario that would derail the current bull market. While this perspective isn’t included in their formal forecasts, he believes the rally could extend into 2026.
Newman added, “If you look at what’s happening across the global economy, all the ingredients for a structural bull market are present.” He highlighted that one of gold’s unique traits is how quickly investors adapt to new price levels, often converting previous resistance levels into future support. A year ago, he admitted he would have expected $3,000 to trigger widespread profit-taking.
However, despite ongoing economic uncertainty and geopolitical instability, investors have not been discouraged by current price levels. Newman emphasized that what makes 2025 distinct is that new investors are just now entering the market. While gold has been rallying since 2023, much of the demand until recently came from central banks and Asian markets—particularly China.
Newman noted that only in Q4 of last year and early this year did retail investors begin to decisively adopt a bullish stance. “We’ve seen strong growth in investment demand this year,” he said, “but there’s still a large amount of capital that hasn’t entered the market yet. This is not a bubble—this is a well-supported, structurally sound market.”
He concluded by identifying changing perceptions of the U.S. dollar as a major driver behind increased gold investment.While the dollar remains a traditional safe haven, ongoing trade tensions and unsustainable government debt levels have eroded market confidence, prompting investors to seek safety and diversification through gold.
