Quick take US indices and the Fed's interest rate decisionQuick look at what can we expect from the Fed's rate decision and press conference on Wednesday.
TVC:DJI
TVC:SPX
TVC:NDQ
Let us know what you think in the comments below.
Thank you.
77.3% of retail investor accounts lose money when trading CFDs with this provider. You should consider whether you understand how CFDs work and whether you can afford to take the high risk of losing your money. Past performance is not necessarily indicative of future results. The value of investments may fall as well as rise and the investor may not get back the amount initially invested. This content is not intended for nor applicable to residents of the UK. Cryptocurrency CFDs and spread bets are restricted in the UK for all retail clients.
Federalreserve

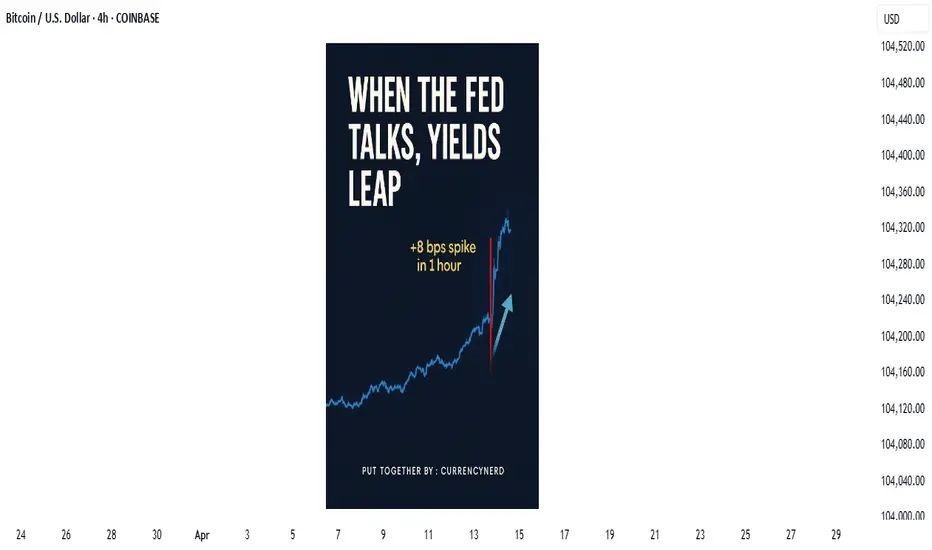
when Jerome says spike, the markets asks how low/high"Watch what they do, but also how they say it."
In the high-stakes world of central banking, few things move markets like the subtle wording of a Fed statement, But beyond the headlines and soundbites, one market absorbs this information faster—and with greater clarity—than almost any other: the bond market.
💬 What Is "Fed Speak"?
"Fed speak" refers to the nuanced and often deliberately vague language used by U.S. Federal Reserve officials when communicating policy expectations. It includes:
FOMC statements
Dot plot projections
Press conferences
Individual speeches from Fed officials
nerdy tip: the Fed aims to influence expectations without committing to specific outcomes, maintaining flexibility while steering market psychology.
📈 The Bond Market as a Decoder
The bond market, particularly the U.S. Treasury market, is where real-time interpretation of Fed policy plays out. Here's how it typically reacts:
1. Short-Term Yields (2Y, 3M) = Fed Expectation Barometer
These are the most sensitive to near-term interest rate expectations. If the Fed sounds hawkish (more rate hikes), short-term yields jump. If dovish (hinting cuts), they fall. At the May 7, 2025 FOMC meeting, the 2-year Treasury yield (US02Y) experienced a modest but clear reaction:
Just before the release, yields were hovering around 3.79%.
In the first hour following the 2:00 PM ET (20:00 UTC+2) statement, the yield ticked up by approximately +8 basis points, temporarily reaching about 3.87%.
Later that day, it eased back to around 3.79%, ending the day roughly unchanged—a sharp, immediate spike followed by a reversion.
2. Long-Term Yields (10Y, 30Y) = Growth + Inflation Expectations
Longer-dated yields reflect how the market sees the economy unfolding over time. After a Fed speech:
Rising long-term yields = stronger growth/inflation expected
Falling yields = fears of recession, disinflation, or policy over-tightening
3. The Yield Curve = Market's Policy Verdict
One of the best tools to read the bond market's verdict is the yield curve—specifically, the spread between 10Y and 2Y yields.
Steepening curve → Market thinks growth is picking up (Fed may be behind the curve)
Flattening or Inversion → Market believes the Fed is too aggressive, risking a slowdown or recession
📉 Example: After Jerome Powell’s hawkish Jackson Hole speech in 2022, the 2Y-10Y spread inverted deeply—markets were pricing in recession risks despite a strong Fed tone.
🧠 Why Traders Must Watch Bonds After Fed Speak
🪙 FX Traders:
Higher yields = stronger USD (carry trade advantage)
Falling yields = weaker USD (lower return for holding)
📈 Equity Traders:
Rising yields = pressure on tech/growth stocks (higher discount rates)
Falling yields = relief rally in risk assets
📊 Macro Traders:
The MOVE Index (bond volatility) often spikes around FOMC events
Forward guidance shifts = big rotation opportunities (e.g., bonds > gold > dollar)
(BONUS NERDY TIP) 🔍 How to Analyze Fed Speak Through Bonds
✅ Step 1: Watch the 2Y Yield
First responder to new rate expectations.
✅ Step 2: Check the Fed Funds Futures
Compare market pricing pre- and post-statement.
✅ Step 3: Look at Yield Curve Movement
Steepening or inversion? That’s the market’s macro take.
✅ Step 4: Track TLT or 10Y Yield on Your Chart
Bond ETFs or Treasury yields reveal sentiment instantly.
🧭 Final Nerdy Thought : Bonds React First, Talk Later
When the Fed speaks, don't just read the words. Read the yields. The bond market is often the first to interpret what the Fed really means—and the first to price in what comes next.
So next FOMC meeting, instead of watching only Powell’s facial expressions or CNBC pundits, open a chart of the 2Y and 10Y. That’s where the smart money’s listening.
put together by : @currencynerd as Pako Phutietsile
courtesy of : @TradingView
XAUUSD - Gold awaits NFP!Gold is trading in its ascending channel on the hourly timeframe, between EMA200 and EMA50. We should wait for a valid breakout of the pattern we identified yesterday, from which we had a Fick break above. We can enter the trade after it breaks in the formed pattern, and on the other hand, if gold corrects towards the demand zone, we can buy it in the short term with a reward at an appropriate risk.
Gold came under downward pressure amid renewed optimism regarding U.S.-China trade talks. Although prices surged to a four-week high earlier in the day due to strong demand from Asian and European buyers, a wave of selling during U.S. trading hours reversed part of that gain.
This shift in momentum coincided with rising U.S. Treasury yields and a boost in market sentiment following a phone call between the presidents of China and the United States. While no official statement has been issued yet, the decision to initiate a new round of high-level negotiations was seen as a positive signal. In recent months, gold has become a key indicator for gauging geopolitical and trade-related risks, having previously surged to an all-time high of $3,500 after the “Freedom Day” tariffs were implemented.
Despite ongoing concerns over Ukraine, Iran, and the growing U.S. fiscal deficit—which provide fundamental support for gold—the metal’s inability to break above the key resistance level of $3,437 has cast doubt on the short-term bullish outlook.
Meanwhile, Goldman Sachs has projected that the upcoming U.S. nonfarm payrolls (NFP) report for May will show a 125,000 increase in jobs. The unemployment rate is expected to remain steady at 4.2%, and monthly wage growth is estimated at 0.3%. The bank also anticipates a 10,000-job decline in the public sector, largely due to tariff-related policies and reduced hiring. Overall, Goldman Sachs expects the report to be balanced and free of surprises, which should encourage the Federal Reserve to maintain its current policy stance.
Although gold has managed to stabilize above $3,000 per ounce in recent weeks, many investors remain focused on reclaiming the historic peak reached in April. According to one research firm, it’s only a matter of time before that level is tested and broken again.
In the annual “Gold Focus 2025” report published Thursday by the UK-based firm Metals Focus, analysts stated that gold retains strong momentum for further gains in 2026. They forecast that the average gold price this year could reach an unprecedented $3,210, with new highs likely in the second half of the year.
In an interview with Kitco News, Metals Focus CEO Philip Newman said it is difficult to envision a scenario that would derail the current bull market. While this perspective isn’t included in their formal forecasts, he believes the rally could extend into 2026.
Newman added, “If you look at what’s happening across the global economy, all the ingredients for a structural bull market are present.” He highlighted that one of gold’s unique traits is how quickly investors adapt to new price levels, often converting previous resistance levels into future support. A year ago, he admitted he would have expected $3,000 to trigger widespread profit-taking.
However, despite ongoing economic uncertainty and geopolitical instability, investors have not been discouraged by current price levels. Newman emphasized that what makes 2025 distinct is that new investors are just now entering the market. While gold has been rallying since 2023, much of the demand until recently came from central banks and Asian markets—particularly China.
Newman noted that only in Q4 of last year and early this year did retail investors begin to decisively adopt a bullish stance. “We’ve seen strong growth in investment demand this year,” he said, “but there’s still a large amount of capital that hasn’t entered the market yet. This is not a bubble—this is a well-supported, structurally sound market.”
He concluded by identifying changing perceptions of the U.S. dollar as a major driver behind increased gold investment.While the dollar remains a traditional safe haven, ongoing trade tensions and unsustainable government debt levels have eroded market confidence, prompting investors to seek safety and diversification through gold.

Rate Cuts and Risky Bets: When the Fed Rolls Out the Red Carpet🎬 The Fed’s June Meeting Is Around the Corner
Mark your calendars: June 17–18 is when the Federal Reserve's Federal Open Market Committee (FOMC) convenes next. With the benchmark interest rate ECONOMICS:USINTR currently holding steady at 4.25% – 4.50%, investors and policymakers alike are keenly awaiting any signals of a shift in monetary policy.
Market expectations suggest a cautious approach, with futures markets indicating a modest probability of rate cuts in the latter half of the year. That said, the upcoming meeting could offer some juicy insights into the Fed's outlook — yes, in this economy.
🤝 Trump vs. Powell: The Sequel No One Asked For
President Donald Trump and Fed Chair Jerome Powell recently had their first face-to-face meeting during Trump’s second term, rekindling a familiar tension. Trump criticized Powell for maintaining high interest rates, saying it puts the US at an economic disadvantage compared to countries like China.
Not too surprising, Trump’s tone, that is. As a matter of fact, it’s way softer than when the President called the Fed chair a “major loser.”
Anyway, Powell was holding back at the meeting, saying that the Fed is independent and that monetary policy decisions are based on objective economic data, not political pressure.
Despite Trump's public and private criticisms, Powell remains steadfast in his approach, focusing on long-term economic stability over short-term political considerations.
📉 Inflation, Employment, and the Tightrope Walk
Inflation has decreased significantly from its peak of 9.1% in 2022 to 2.3% in April 2025 , nearing the Fed's 2% target. However, the labor market remains robust, with unemployment rates at historically low levels.
The Fed faces a delicate balancing act: cutting rates too soon could reignite inflation, while maintaining high rates might dampen economic growth. This tightrope walk requires careful analysis of incoming data and a measured approach to policy adjustments.
🛍️ Market Reactions: Bulls, Bytes, and Bullion
If rate cuts are the rumor, the S&P 500 SP:SPX is already buying the headline. The index clawed back all of its early-year slump and now sits just above the flatline. Traders are clearly pricing in a friendlier Fed, even if Jerome Powell hasn’t sent out the official RSVP yet.
Gold OANDA:XAUUSD , meanwhile, has been doing what it does best — quietly flexing in the corner as uncertainty swirls. Prices bounced back above $3,300 in late May, reminding everyone that when central banks blink, bullion blings. A rate cut could weaken the dollar — and gold’s inverse relationship with the greenback suddenly looks like a playbook move.
Speaking of the dollar, the dollar index TVC:DXY has been wobbling like it’s just finding its feet. With inflation softening and tariff noise all over the place, the buck has lost some swagger . Traders are already rotating out of safe havens and into riskier plays, including…
Yep, Bitcoin ( BTCUSD ).
Crypto’s original bad boy is back on the move, orbiting near $110,000 after rewriting its all-time high book in May.
A dovish Fed can technically pour more rocket fuel into the rally, especially as sovereign adoption and ETF flows keep pumping ( $9 billion in just five weeks?! ). In the land of easy money, Bitcoin doesn’t just survive — it thrives.
The takeaway? Markets love a dovish pivot. Whether you're holding stocks, stacking sats, or eyeing gold bars, the Fed’s next move could be the difference between breakout and breakdown.
🧠 What to Keep in Mind
As the June Fed meeting approaches, traders should consider the following strategies:
Diversification: Maintain a diversified portfolio to mitigate risks associated with interest rate volatility.
Equity Exposure: Evaluate exposure to sectors sensitive to interest rates, such as the good old tech space and throw in some financials — banks love rate moves.
Inflation Hedges: Consider assets like gold or silver to hedge against unexpected inflationary pressures.
🧾 Conclusion: Navigating Uncertainty
The June Fed meeting isn’t just another calendar event — it’s a market-defining moment dressed in central bank jargon. With politics heating up and inflation cooling down, Powell’s next move could either pump more cash into the risk rally or throw cold water on the party.
Yes, the noise is loud. Yes, the data is messy. But through it all, one thing holds: staying nimble beats being early. Whether you're riding the S&P 500, hodl’ing Bitcoin, or hugging gold like a doomsday prepper, this is the time to trade the chart, not the chatter.
Off to you : Are you in the rate-cut camp or you think there’s more ground to cover before Powell and his squad tune the pitch down? Comment below!

$USPCEPIMC -U.S Core PCE (April/2025)ECONOMICS:USPCEPIMC
April/2025
source: U.S. Bureau of Economic Analysis
-The core PCE price index in the US, which excludes volatile and energy prices and is Federal Reserve's chosen gauge of underlying inflation in the US economy,
went up 0.1% from the previous month in April of 2025.
The result was in line with market expectations.
From the previous year, the index rose by 2.5% to slow from the 2.7% jump from March, the softest increase since March of 2021.

XAUUSD - Will Gold Reach $3,300?!Gold is trading above the EMA200 and EMA50 on the 1-hour timeframe and is trading in its ascending channel. I expect the path ahead for gold to be bullish, but a downward correction of gold will lead to the creation of buying positions from the bottom of the channel.
Gold faced renewed selling pressure over the past week—an event that not only dragged down its price but also led many analysts and retail investors to temporarily abandon their bullish short-term outlooks. The return of investor appetite for riskier assets has momentarily weakened gold’s appeal as a safe haven.
Meanwhile, the credit rating agency Moody’s has finally acted, downgrading the U.S. sovereign rating from Aaa to Aa1. This marks the first time that even one of the major agencies no longer sees the U.S. as worthy of the highest credit rating. The downgrade was driven by factors such as an annual budget deficit nearing $2 trillion, a debt burden exceeding GDP, and elevated interest rates that have significantly increased the government’s borrowing costs—conditions which, if persistent, could serve as catalysts for gold’s resurgence.
Adrian Day, CEO of Adrian Day Asset Management, stated: “The downward trend continues. We expect prices to decline further in the coming weeks, especially with the potential restructuring of U.S. trade tariffs. That said, once this phase passes, it could set the stage for one of the best buying opportunities.”
Adam Button, Chief Currency Strategist at Forexlive.com, offered a similar outlook, saying: “Current trading sentiment is clearly tilted toward the downside. The market is searching for a new floor, although it seems likely that support will remain above the key $3,000 psychological threshold.”
Following a week full of economic data, the upcoming week’s calendar appears relatively light, with only a handful of reports likely to influence the markets. Early in the week, traders will face a lack of major catalysts, but focus will gradually shift toward Thursday’s releases: weekly jobless claims, the flash PMI from S&P Global, and existing home sales. Additionally, new home sales data on Friday will be one of the few key events of the week.
Alongside these economic updates, the coming days will feature a wave of speeches from Federal Reserve policymakers. Speakers include Jefferson, Williams, Logan, Kashkari, Barkin, Bostic, Collins, Musalem, Kugler, Daly, and Hsu, culminating with a speech from Fed Chair Jerome Powell on Sunday evening.

Fed pleases everyone, except for one. BoE is next on the watchThe Federal Reserve came out with its rate decision and it seems that all market participants got pleased, except for one.
Today it's the BoE's turn to deliver rates.
Let's dig in!
TVC:DJI
TVC:DXY
FX_IDC:GBPUSD
MARKETSCOM:100UK
Let us know what you think in the comments below.
Thank you.
77.3% of retail investor accounts lose money when trading CFDs with this provider. You should consider whether you understand how CFDs work and whether you can afford to take the high risk of losing your money. Past performance is not necessarily indicative of future results. The value of investments may fall as well as rise and the investor may not get back the amount initially invested. This content is not intended for nor applicable to residents of the UK. Cryptocurrency CFDs and spread bets are restricted in the UK for all retail clients.

FED FUNDS Rate Inflation Adjusted Remains TightFED FUNDS Rate Inflation Adjusted for core inflation remains in the tightening area. As inflation rises over the next few months, thanks to Trump's liberating all Americans with higher taxes and less discretionary income to spend.
I expect this chart to drop as inflation rises and Fed holds rates steady. Alternatively, FED lowers rates bc we will be in a recession, and it is trying to make private money creation cheaper to pump the economy.
Which of the two will occur first, I could not tell you. However, it is important to keep a close eye on this chart in the months ahead.
Click like, follow, subscribe.

ETH Summer BearishA potential path for ETH before resuming a bullish major trend, is drawn with a purple arrow.
I don't think the FED will cut rates today. In fact, maybe in September. Maybe. If the FED cut rates, then the target scenario (green box in the chart) would not play out, we would shift to a bullish movement. I wish for that, but I don't think is near yet.
That being said, the current potential risk, I calculated it to -30% from current levels. Exact prices are impossible to predict, rather I focus on target areas.
DISCLAIMER:
Do Your Own Research, don't use mine to invest! This is not a financial advice, it is only a mere opinion of mine. I own several cryptocurrencies, including ETH.

Recession indicator #2 Just realized that measuring the spread between TVC:US02Y and FRED:FEDFUNDS gives you a pretty accurate heads up of looming recessions. We might be in one from a few months now.

Gold Market Outlook – Upcoming FED Decision & Trading StrategyAs we head into the upcoming week, all eyes are on the Federal Reserve's interest rate decision, which is a major catalyst for gold. This event could significantly influence gold’s direction — either fueling the ongoing bullish trend or triggering a pullback.
🔎 Current Technical Outlook:
Gold is currently showing strong bullish momentum across higher timeframes.
Liquidity targets remain above, with key zones likely to be breached via wicks or trendline taps.
Given the uncertainty around the news and macro factors, we’ll execute trades only on confirmed setups from lower timeframe's confirmation.
📌 Trade Plan:
Open 50% of the position at $3160,
an inevitable level which is a critical level backed by technical confluence.
Enter remaining positions based on lower timeframe confirmation.
📝 Supporting Fundamentals:
COT (Commitment of Traders) Report indicates an increase in net long positions on gold.
$3160 is highly probable — we anticipate price to tap this zone.
The U.S. has significantly increased gold imports, reflecting strategic accumulation.
Smart money has taken partial profits, but large bullish positions are still being held.
Expectation: A sweep of major liquidity levels, followed by a continuation of the bullish trend.
Stay sharp and disciplined. Wait for confirmation before adding full exposure.

Trump vs. Powell: 4d Gold Price Roller Coaster📊 Summary of Recent 4 Trading Days
During the ongoing US-China trade war, President Trump has ramped up his public criticism of Federal Reserve Chair Jerome Powell. Though he lacks the authority to remove Powell directly it seems, Trump's frustration with the Fed’s independent policy direction has led to an apparent institutional power struggle.
This conflict hasn’t gone unnoticed by the markets. Just the mention of removing Powell caused the gold price to spike, as stock market money got squeezed out, amplified by tensions in the trade war. The Federal Reserve’s credibility is high, so such remarks naturally trigger significant volatility.
After Trump's initial outburst, gold surged $216. But when he softened his tone, the price reversed just as dramatically—falling about $240 (with the trading day still ongoing at the time). Hopes for progress in trade negotiations also played a role in this sharp reversal.
⚠️ Warning Signs of Market Distortion
Statements from the US President now function almost like market-moving events in addition to normal news. For gold traders, this creates an unstable environment where typical technical setups may fail.
The past days showed signs of manipulated or artificial movements—with potential insider activity. One notable example: Gold looked set to break higher after a 1-hour candle closed above the EMA 20 line. But a sudden $12 bearish candle in the last 30 seconds erased the setup. It felt orchestrated—possibly by institutional players defending key levels.
💡 Trader’s Takeaway
Don’t blindly trust technical signals in this environment.
Watch for political noise—it’s louder than usual.
Prefer quieter markets if you’re risk-averse.
Expect $100+ daily ranges and frequent price whipsaws.
🗣 What’s your take?
Is Trump really influencing the gold market on purpose—or just creating chaos? Let’s discuss below. 👇
-------------------------------------------------------------------------
This is just my personal market idea and not financial advice! 📢 Trading gold and other financial instruments carries risks – only invest what you can afford to lose. Always do your own analysis, use solid risk management, and trade responsibly.
Good luck and safe trading! 🚀📊

USD/CHF Bearish Tri Breakout - 5 Signs of a Strong Bearish BreakOANDA:USDCHF Bears have started the week off hot with Price having dropped 1.16% at the time of publication since Market Open. This price decline has seen a Breakout and fresh low after price has been caught in a Bearish Triangle Pattern, formed by Lower Highs into a Support Level.
1) Price has been trading well Below the 200 EMA.
2) After Price makes contact of the 34 EMA Band while attempting a Breakout of the Falling Resistance of the Triangle, it is sent back down into pattern.
3) After the rejection at the Falling Resistance, we see an influx of Volume enter the Markets, ultimately leaning Bearish.
4) All the Price Action while in Pattern has happened while the RSI has been Below 50, adding Bearish Pressure.
5) Price has made a strong Bearish Candle Break so far of the Support Level of the Triangle and the currently Low of Price @ .80684 has given us a new Lower Low, breaking the Support Level Low @ .80983, suggesting Bears have taken the Support Level and will turn it Resistance.
** With all Indications combined, I believe we are looking at a True Bearish Breakout of the Triangle and will be looking for a Break & Retest Set-Up!
--> Once Price Confirms the Break and Closes, We should expect a Retest of the Break of Support between ( .80983 - .81141 ) to deliver potential Short Opportunities!
Now, Fundamentals:
Price Action lately has heavily been influenced by a couple factors:
- Federal Reserves current dilemma with deciding to not cut Interest Rates in the assumption that the Tariffs will Rise Inflation while the CPI y/y on April 10th printed a -.4% drop from 2.8% to 2.4% which could create complications later if Interest Rates are not cut soon enough.
(If Global Trade slows, that alone will Inflate prices, Tariffs (once applied) will affect as well)
- ECB has made the decision to cut Interest Rates 25 bps from 2.65% to 2.4%. This alone in-time will start the act of slowing the economy so the euro doesn't inflate too much and, in theory, will make the Euro seem less attractive for foreign investment.
This could leave investors to lean towards one of the worlds most "Safe-haven" currencies, the Swiss Franc with the Franc currently hitting a 10-Year High!
www.tradingview.com

heading to trend support at 84-85macro sentiment continues to be pessimistic. established trend support and resistance will continue until macro sentiment has sufficient reason to change.

XAGUSD: Silver, and the latest on tariffs!Silver is trading in its ascending channel on the 4-hour timeframe, between the EMA200 and EMA50. If silver reaches the supply zone, it can be sold. A downward correction will also provide us with a buying opportunity with a good risk-reward ratio.
U.S. President Donald Trump has implemented tariff policies with the aim of revitalizing domestic manufacturing. During the 1980s, a significant portion of American manufacturing jobs either moved overseas or were replaced by automation technologies.
The shift in production was largely driven by wage disparities across countries. Nevertheless, the United States remains a leading global manufacturer, although it now focuses on producing higher-value goods. Experts argue that imposing import taxes is unlikely to achieve one of its stated goals: restoring manufacturing as a central pillar of the U.S. economy.
According to many economists, Trump’s campaign to impose tariffs on a wide range of goods from trade partners is unlikely to bring back the manufacturing jobs that once formed the backbone of the blue-collar middle class.
In the mid-20th century, the U.S. was the manufacturing capital of the world, employing more workers in this sector than any other. At its peak in the 1950s, one-fourth of the civilian workforce was engaged in manufacturing.
However, starting in the 1980s, free trade agreements facilitated the relocation of many industries abroad, while automation reduced the need for human labor in the remaining factories. Today, only about 7% of the workforce is employed in manufacturing—a figure that has remained largely unchanged since the Great Recession.
The goal of tariffs is to incentivize businesses to relocate their factories to the U.S. to avoid paying import taxes—costs that are typically passed on to consumers.
While some economists believe this approach could work for select industries, it is unlikely to recreate an era in which most household items carried the “Made in America” label.
According to a report by The Wall Street Journal, while it’s unlikely that the Chinese President will initiate a call himself, the odds of Xi Jinping responding to a call from Trump are reportedly high.
This comes amid heightened tensions between the two nations due to new tariffs and escalating trade disputes, where both sides appear to be locked in a power struggle—neither willing to be the first to back down.
Although this news may seem minor on the surface, it carries a deeper signal for the markets: despite ongoing tensions, the possibility for communication and negotiation remains. This prospect, especially in a highly volatile environment, could be seen as a positive sign by investors.
Earlier in the week, Trump had stated he was waiting for a call from Xi. Now, the Wall Street Journal suggests that if Trump initiates the conversation, a response from China is likely. While this may be an unofficial message from within the Chinese leadership, it still indicates that the door to dialogue and de-escalation is not entirely closed.

EURUSD LIVE TRADE 100 PIP MOVE EUR/USD trades decisively higher on the day above 1.1000 on Wednesday as the US Dollar (USD) stays under persistent selling pressure on growing fears over a recession as a result of the US trade war with China. Later in the American session, the Federal Reserve will release the minutes of the March policy meeting.

Most likely path forward, Fed stops the bleeding in JuneLooking at this chart I can see a clear trajectory to 68k, though bulls may end up staving off that price until June when the Federal Reserve plans to meet and talk interest rates, which will most likely be lowered to stop the bleeding of the stock market. I predict, if they do, there may be a drop in BTC price right before the meeting so folks can get their discounted bitcoin.
from www.forbes.com
Now, as the chief executive of BlackRock warns bitcoin could end the U.S. dollar’s world’s reserve currency status, traders are betting the Federal Reserve will be forced to cut interest rates to stave off a U.S. recession—something that could see the market “flooded” with dollars.
BlackRock CEO Issues Huge $952 Billion Bitcoin Price Warning To The U.S. Dollar
Federal Reserve chair Jerome Powell is having to recalculate the need for interest rate cuts after ... More U.S. president Donald Trump followed though on his threat of global trade tariffs—potentially playing havoc with the bitcoin price.
Short-term interest-rate futures are showing a 70% chance of a Fed interest rate cut when it meets in June, up from about 60% before the tariffs were announced.
That meeting is scheduled for June 17th and 18th.
Shorting isn't a crazy idea for now, while hedging on short term upswings until we hit 68k.

Crypto Market at Critical Crossroads: Is History Repeating?Maybe an altcoin season seems too luxurious for us investors right now.
The TOTAL market cap is currently at a critical point, showing price action similar to past cycles.
Previously, we had COVID as our black swan event - could today's equivalent be a trade war?
We're probably approaching the final wave before the market truly enters a downtrend. It's crucial now to stay alert and prepare carefully.
Everything the US is currently doing—including tariffs—serves one goal: shrinking their huge federal debt load, absorbing wealth from other global economies, and keeping gold prices in check. This gives the FED more room to reduce interest rates and reignite growth.
Eventually, global markets always rebalance. Governments typically respond by printing more money to ease the pain, and historically, that's positive news for BINANCE:BTCUSD
Cheap money policies always return; it's just a matter of when.
Your job now is straightforward:
- Be patient
- Stay flexible
- Maintain solid cash reserves
Remain calm, stay sharp, and be ready for opportunities.
#BTC #FED #TotalMarketCap #CryptoTrading #TechnicalAnalysis #CryptoVeteran #TheCryptoFire

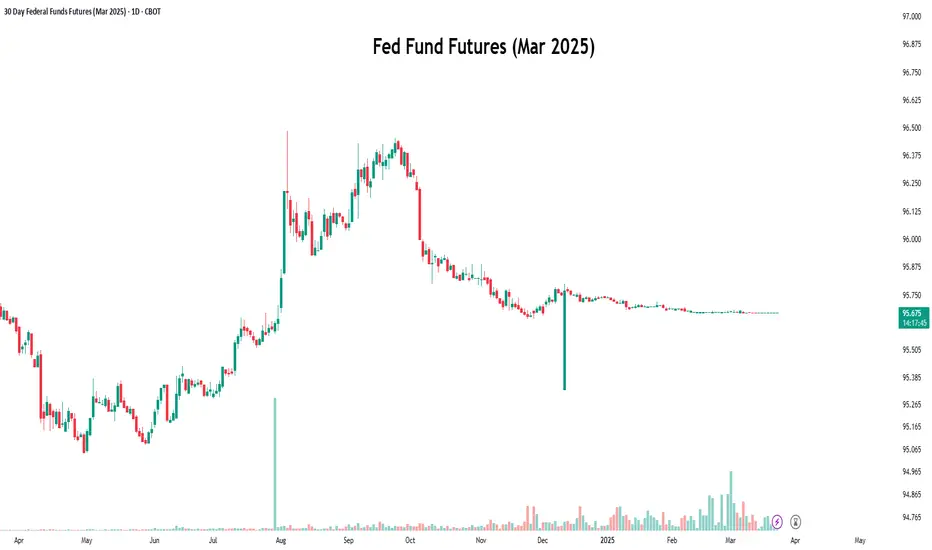
Decoding Fed Rate Changes via Federal Funds Futures Index◉ What Are Federal Funds Futures?
● Definition: Federal Funds Futures are financial contracts traded on the Chicago Mercantile Exchange (CME) that allow market participants to bet on or hedge against future changes in the federal funds rate (the interest rate at which banks lend to each other overnight).
● Purpose: These futures reflect the market's expectations of where the Fed will set interest rates in the future.
◉ How Federal Funds Futures Work?
● Pricing: The price of a federal funds futures contract is calculated as 100 minus the expected average federal funds rate for the contract month.
➖ Example: If the futures price is 95.00, it implies an expected federal funds rate of 5.00% (100 - 95 = 5).
● Contract Expiry: Each contract represents the market's expectation of the average federal funds rate for a specific month.
◉ Why Use Federal Funds Futures?
● Predict Fed Policy: Traders and investors use these futures to gauge the likelihood of the Fed raising, cutting, or holding interest rates.
● Hedge Risk: Institutions use them to protect against potential losses caused by interest rate changes.
● Market Sentiment: They provide insight into what the broader market expects from the Fed.
◉ Steps to Analyze Fed Policy Using Federal Funds Futures
● Step 1: Check Current Federal Funds Futures Prices
Look up the prices of federal funds futures contracts for the months you're interested in. These are available on financial platforms like Bloomberg, Reuters, or the CME Group website.
● Step 2: Calculate the Implied Federal Funds Rate
Implied Federal Funds Rate = 100 - Futures Price.
➖ Example: If the futures price for March is 95.5, the implied rate is 4.5% (100 - 95.5 = 4.5).
● Step 3: Compare Implied Rates to the Current Rate
If the implied rate is higher than the current federal funds rate, the market expects the Fed to raise rates. If it's lower, the market expects a rate cut.
● Step 4: Estimate the Probability of Rate Changes
By comparing the implied rates of contracts expiring before and after an FOMC meeting, you can estimate the probability of a rate change.
➖ Example: If the implied rate for March is 4.75% and the current rate is 4.5%, the market is pricing in a 25 basis point (0.25%) hike.
● Step 5: Monitor Changes Over Time
Track how futures prices change over time. Shifts in prices indicate changes in market expectations. For example, if futures prices drop (implying higher rates), it suggests the market is anticipating a more hawkish Fed.
◉ Practical Applications
● Trading: Traders use federal funds futures to speculate on interest rate movements.
● Economic Forecasting: Economists use them to predict the Fed's monetary policy and its impact on the economy.
● Investment Strategy: Investors adjust their portfolios based on expected rate changes (e.g., shifting from bonds to equities if rates are expected to rise).
◉ Limitations of Federal Funds Futures
● Market Sentiment: Futures prices reflect market expectations, which can be influenced by sentiment and may not always accurately predict Fed actions.
● External Shocks: Unexpected events (e.g., geopolitical crisis, pandemics) can disrupt rate expectations.
● Liquidity: Less liquid contracts (further out in time) may not accurately reflect expectations.
◉ Example Analysis
Let’s assume:
➖ Current federal funds rate: 4.5%
➖ March federal funds futures price: 95.5
● Step 1: Calculate the implied rate:
100 − 95.5 = 4.5%.
● Step 2: Compare to the current rate:
The implied rate (4.5%) is equal to the current rate (4.5%), suggesting the market expects no change in rates by March.
● Step 3:
If the futures price drops to 95.25, the implied rate becomes 4.75%, indicating the market now expects a 25 basis point rate hike..
◉ Why This Matters?
● For Traders: Federal funds futures provide a direct way to bet on or hedge against interest rate changes.
● For Investors: Understanding rate expectations helps in making informed decisions about asset allocation.
● For Economists: These futures offer valuable insights into market expectations of monetary policy.
◉ Conclusion
Federal funds futures are a powerful tool for analyzing and predicting the Fed's interest rate decisions. By understanding how to interpret these futures, traders, investors, and economists can gain valuable insights into market expectations and make more informed decisions. However, it's important to consider their limitations and use them in conjunction with other economic indicators for a comprehensive analysis.
$USINTR - U.S Interest Rates (March/2025)ECONOMICS:USINTR
March/2025
source: Federal Reserve
- The Fed keep the funds rate unchanged at 4.25%-4.5%,
but signaled expectations of slower economic growth and rising inflation.
The statement also noted that uncertainty around the economic outlook has increased, but officials still anticipate only two quarter-point rate reductions in 2025.

Ultimate summary of Powell’s comments today As expected, Powell reiterated that the Fed is in no rush to adjust rates, and the labour market is stable.
He also reaffirmed the Fed’s reliance on hard data over sentiment and the approach of slowing balance sheet reduction.
What’s different this time:
Inflation & tariffs: Powell acknowledged that recent inflation upticks may be tariff-driven, delaying progress toward price stability. The Fed’s base case assumes tariff inflation is temporary.
Economic sentiment: Consumer sentiment has weakened, partly due to Trump policy changes, and concerns over inflation are growing.
Recession risk: Forecasts now lean toward weaker growth and higher inflation, with recession risks slightly elevated but still not high.

Recap: Weekly Trade Plan March 10th, 2025CME_MINI:ES1!
In this TradingView blog, we will recap our trade plan posted on March 10th, 2025.
Please note that this is a recap, and since then, we have also published our updated price map and weekly plan for the current week. Today is also the Federal Reserve's decision day.
Here is our updated price map from the weekly plan published on March 10th, 2025:
Our updated price map for ES Futures
Key Levels:
• Important Level to reclaim if no correction: 5795.25 - 5800
• Key LVN: 5738 - 5696
• Mid 2024 range: 5574.50
• Key Support: 5567.25 - 5528.75
• 2024-YTD mCVAL: 5449.25
• 2022 CVAH: 5280.25
It is important to note that when we provide our thoughts and reasoning for the levels we map in our recap, we have the benefit of hindsight. Likewise, when we publish our weekly trading plan and share our thoughts at the start of the week, we are anticipating potential market movements on the hard right edge. This is where randomness and uncertainty are key points.
If we were to rank our process chronologically, this is how we note the importance of each component that makes up our plan.
1. Big Picture
2. Key Levels/Price Map
3. Scenarios
Our big picture is based on how we view the global macroeconomic and geopolitical landscape.
Key levels are mapped utilizing our methodology considering market auction theory and volume profiling. Note how our key level, 'Mid-range 2024', on higher time frame provided support.
At times you may see two scenarios, at other times three. Scenarios are just an anticipation which a trader should adjust should any new information come to light. Although you may note that our scenarios play out mostly from reviewing our blogs. Our aim is to help you create a process for yourself. Note how we anticipated near-mirroring price action for the week, though our reasoning was influenced by higher inflation data. However, the inflation reading came in lower than expected.
Fast forward to today, all eyes are now on the Federal Reserve’s rate decision, SEP, and the FOMC press conference scheduled for later today.

If you don't have DXY, keep an eye on USDCHF.Today we are waiting for the Federal Reserve interest rate decision, where the Bank is expected to keep the rates unchanged. However, it's the press conference, which we are more bothered about. Keep your eyes on TVC:DXY , but if you don't have MARKETSCOM:DOLLARINDEX , then MARKETSCOM:USDCHF will be just as good.
Let's dig in.
FX_IDC:USDCHF
Let us know what you think in the comments below.
Thank you.
74.2% of retail investor accounts lose money when trading CFDs with this provider. You should consider whether you understand how CFDs work and whether you can afford to take the high risk of losing your money. Past performance is not necessarily indicative of future results. The value of investments may fall as well as rise and the investor may not get back the amount initially invested. This content is not intended for nor applicable to residents of the UK. Cryptocurrency CFDs and spread bets are restricted in the UK for all retail clients.
