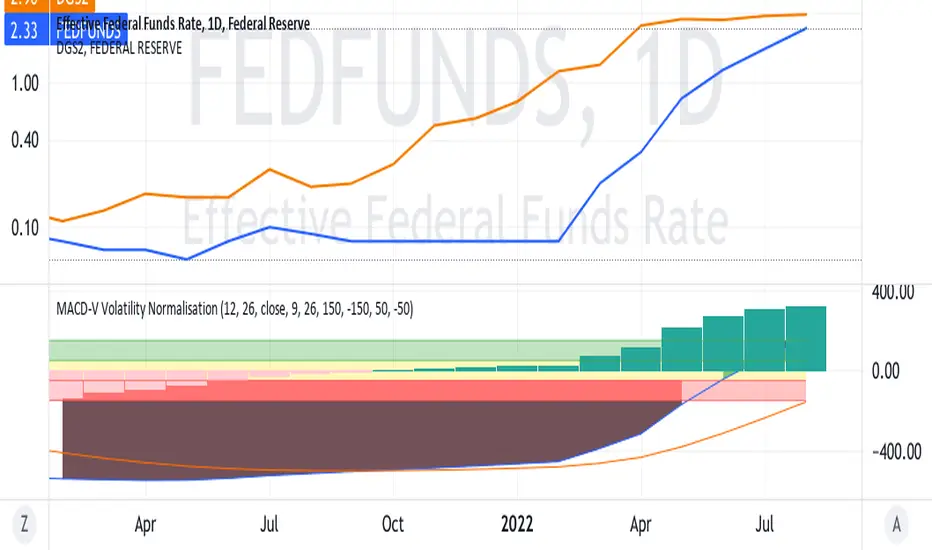
FEDERAL EASING IMPENDING WITH SEPTEMBER MEETING?On the chart, is the Federal Funds rate about to intersect
the yield of the 2 year Treasury Bills ?
If so , will this mark the technical point at which the Federal
Board will loosen things up in the context of the big picture
including jobs, core inflation, et cetera.
Will the fed lighten up and make any hike only 25 / 50 points ?
Has the market already factored all of this in ?
( Maybe too many questions !?!?!?!?)
Federalreserve
SPY will bottom before FED ends rate hikes:see contrarian viewLast August 27 I already gave the bearish scenario wherein the FED continues even into a recession. The downsides were 350, 320 & 280 IF SPY breaks below 400 & 380. Today, Friday, SPY seems to be doing an oversold bounce. So let us assume the contrarian role against the market’s extreme pessimism. What if the market sentiment changes & the market suddenly realizes that the FED is just pretending to be very hawkish just to kill that big rally from June bottom of 362?
From June low, SPY rallied a little more than 61.8% Fibonacci to be stopped by the ma200 at 431. From there it reversed down exactly to Fib 0.618 at 3900. This bullish view will take into account certain things:
*The duty of the FED is not only price stability & full employment but also to fund the government. Rising interest rates will blow up the govt debt.
*Inflation has gone down in commodities like gasoline, food, durable goods. Rents & wages are more sticky. Fuel prices will go down if Iran deal push through or if Saudi agrees to increase production. The US, unlike EU, has enough supply of natural gas.
*A FED pause is still possible in 4Q2022 or early 2023 if inflation & the economy really slows down due to demand destruction, earnings recession, lay-offs & rising unemployment. FED may keep rates steady for a while & then continues with less hawkish hikes. If rate hike is overdone, rate cuts & QE will return quickly to save jobs, the economy & control government debt.
*This may be enough for sentiment to change & for buyers to come in pushing this rebound even higher.
Let us just assume that the June low of 362 is already the bottom & SPY is doing an ABC wave up. Using Fib extensions, the possible levels are 460, 476 (double top), 500 & 530. Volatility will remain high with recession fears & geopolitical uncertainties not going away soon. See the wedge down & the wedge up.
FADING THE FED IS TECHNICALLY POSSIBLE but fundamentally less probable.
Not trading advice

The Only Chart That Matters for The Next DecadeConsumer Price Index Year over Year (CPI YOY) vs 2 Year Yield (2YY) vs Fed Funds. To even begin to arrest inflation, the Fed has to get Fed Funds above the 2YY. To break the back of inflation, the Fed must get Fed Funds above CPI YOY. Does the most recent drop in CPI YOY mean that peak inflation is already in? People forget that when inflation runs hot, so does its volatility. For lasting inflation reduction, the Fed has to get to the real neutral rate. And consider that the CPI formula you are seeing in this chart has been altered numerous times, proponents would say to better reflect productivity gains, critics would say to mask real inflation to benefit the government. Whatever you believe, if we calculated CPI the way we did in 1980 it would be nearing 18% . So it's much, much worse than this.
This is the only chart that matters for the next decade.

Euro rebounds after sharp losses, NFP nextThe euro is in positive territory today after taking a nasty spill on Thursday. In the European session, EUR/USD is trading at 0.9984, up 0.40%.
Thursday was a day to file away and move on for the euro, as EUR/USD tumbled 1.07%. The euro is under pressure from a high-flying US dollar and is having trouble staying above the symbolic parity line. A combination of solid US numbers, weak eurozone data and lower risk sentiment sent the euro sharply lower.
German Manufacturing PMI dipped to 49.1, down from 49.3 in July. This marked a second straight contraction, and was the lowest level since May 2020, at the start of the Covid pandemic. It was a similar story for the eurozone Manufacturing PMI, which dropped from 49.8 to 49.6, a 26-month low. The manufacturing sector continues to struggle with supply chain disruptions and a shortage of workers, and high inflation and an uncertain economic outlook are only exacerbating matters.
In the US, the ISM Manufacturing PMI held steady at 52.8, showing modest expansion. The labour market remains strong, with initial jobless claims dropping to 232 thousand, down from 237 thousand a week earlier and much better than the consensus of 248 thousand.
Adding to the euro's woes is the uncertainty over European energy supplies from Russia. Russia has shut down Nord Stream 1 pipeline for three days for maintenance, but Germany has charged that the shutdown is politically motivated and that the pipeline is "fully operational". Nord Stream is supposed to come back online on Saturday. Even if Moscow does restore service, this episode is a reminder of Europe's energy dependence on an unreliable Russia. Germany has greatly reduced its dependence on Russian gas, from 55% in February to just 26%, but a cutoff from Moscow would result in a shortage this winter.
The week wraps up with the August nonfarm payrolls report. The consensus is for a strong gain of 300 thousand, after the unexpected massive gain of 528 thousand in July. The report could well be a market-mover for the US dollar. The markets are finally listening to the Fed's hawkish message, and a strong reading will raise expectations of a 0.75% hike in September and likely push the dollar higher. Conversely, a weak report would complicate the Fed's plans and raise the likelihood of a 0.50% hike, which could result in the dollar losing ground after the NFP release.
EUR/USD is testing resistance at 0.9985. Above, there is resistance at 1.0068
There is support at 0.9880 and 0.9797

EURUSD in the BOX !Hi dear friends;
According to the two falling equal lags that you can see in the chart left side (two-piece spike), now I think we are in the trading range of the market cycle after the descending channel.
On the other hand, we can see the price second encounter to the top of the trading range also, it seems that the double top has been forming, and the price can fall to the lowest part of the box.
I will be waiting for the confirmation of this double top in different time frames.
The news from the Federal Reserve indicates an increase in interest rates also.
I think that the Euro will lose resistance soon!
Cordial regards.

S&P 500 Daily Chart Analysis For August 26, 2022 Technical Analysis and Outlook
The current market fate is the newly created Mean Res 4205 - inverse from Mean Sup 4205. This was a critical sell zone if you short minded. The current downtrend is expected to continue to Inner Index Dip 3965. Interim bullish moves are possible within the current downtrend.

HPQ: Charts dnt lie?!HP Inc
Intraday - We look to Buy at 28.99 (stop at 26.49)
Short term momentum is bearish. Price action continues to gravitate towards crucial support levels with aggressive selling interest. Support could prove difficult to breakdown. Dip buying offers good risk/reward. Although the anticipated move higher is corrective, it does offer ample risk/reward today.
Our profit targets will be 35.19 and 38.00
Resistance: 36.00 / 41.00 / 46.00
Support: 27.00 / 23.00 / 15.00
Please be advised that the information presented on TradingView is provided to Vantage (‘Vantage Global Limited’, ‘we’) by a third-party provider (‘Signal Centre’) . Please be reminded that you are solely responsible for the trading decisions on your account. There is a very high degree of risk involved in trading. Any information and/or content is intended entirely for research, educational and informational purposes only and does not constitute investment or consultation advice or investment strategy. The information is not tailored to the investment needs of any specific person and therefore does not involve a consideration of any of the investment objectives, financial situation or needs of any viewer that may receive it. Kindly also note that past performance is not a reliable indicator of future results. Actual results may differ materially from those anticipated in forward-looking or past performance statements. We assume no liability as to the accuracy or completeness of any of the information and/or content provided herein and the Company cannot be held responsible for any omission, mistake nor for any loss or damage including without limitation to any loss of profit which may arise from reliance on any information supplied by Signal Centre.

Another Dip in the Market. What's the Silver Lining for Crypto?With inflation's end nowhere near in sight, the Federal Reserve this week announced more "tough times" ahead - indicating that they're likely to do more interest hikes for the rest of 2022. Inflation rates in the US right now sits around %8-10 - but since CPI reports exclude food and energy prices by design, the "real" inflation rate is likely a lot higher. Most people see the prices of food and gas rising in their own lives and are probably feeling more than what the "official" numbers say, at least.
A lot have been said about what this means for the economy as a whole, but if you're a crypto investor the things to recognize are:
- This is the first time in history that the Federal Reserve has increased interest rates during a recession - normally you lower rates as the economy dips to give it a boost, but the Feds have no room to do that since the rate was already at 0 for most of the last decade. The problem is much more severe than it is typically reported, especially in the wake of the COVID lockdown procedures that we have yet to experience the full effects of, yet. Some are predicting a market correction as high as 50-60% in stocks, 30-40% in real-estate. We don't know if it's going to go that high but there's no reason to think that it's going to improve, at this point. ("Brace for impact", as many have been warning for a while - it's finally coming.)
- Increases in interest rates generally means borrowing is more expensive, which is likely going to slow down startup investments in the Web3 space, too. Crypto projects, VC/VC firms, and "thought leaders" in the space as we know now are likely to disappear in the next few years as access to cheap money dries out.
- Crypto projects that have been heavily reliant on marketing to keep their prices up will likely tank with the fiat markets, because of its increased overlap with the mainstream economy. Even Bitcoin, Ethereum, Dogecoin, etc. may be in trouble since their notoriety may turn sour when the fiat markets tumbles further. (Being well-known is not an asset in this case, in other words.)
- Currently the most popular crypto coins have no means of reacting to inflation rates (except for Ethereum, which will begin its staking services after the "merge" in September, in theory), so they may struggle to justify convincing people to HODL while the banks start to offer higher interest rates for savings accounts overall. Staking coins like Tezos , Algorand (ALGO), Cosmos(ATOM), are in better position to take advantage of these trends since they are, at least for now, outperforming the banks by a very large margin.
- When the economy as a whole starts to get unstable the common wisdom is that money will flow into the USD. We don't know if that will happen this time - especially with the USD's credit rating outlooks having deemed "negative" by international agencies since 2013. We know that generally speaking, interest in crypto assets tends to increase in countries where its fiat currencies are less stable - but that often requires a breaking point in which the population loses faith in the banking system as a whole. Are we at that point, yet?
- For crypto prices to stay stable, all it needs is about 1% of existing fiat money to maintain its current price. (The general economy is about a 100x bigger than the crypto economy as a whole right now.) But it's allocation, per coin, is not likely to stay even. Crypto will bottom out with the fiat economies, but only a select few coins are likely to make a comeback during the recovery process.
Many crypto investors are banking (literally) on the general public losing faith in the fiat system as the market dips further, which will make crypto investments look more appealing. The most obvious "utility" for crypto right now is staking rewards - which are objectively outperforming the banks right now, but the bear market will also be a period for altcoins working on providing real value to its users to come out ahead. It's going to be a wild ride either way - good luck, folks. 🤞

TOTAL CRYPTO MARKET CAP LOOKING BEARISH!The market is currently on route to levels lower in the following days to come. This statement will be justified in the paragraphs that follow.
Flag break: The market was trending in a bearish flag formation starting on the 18th of June and has recently broken out on the 19th of August. The breakout target levels for this flag formation puts the total market cap at prices as low as $618b, however there are a few strong levels of support that will prevent a sudden drop in price which will result in a hopeful healthy decline in price. It could be argued that the $765b support could be a bottom for this move as there should be a huge buy back at these levels as it does pose as a strong support, being the intraday low of the flag formation.
EMA: Following the break from the flag formation, the price has fallen below the 100 Ema again, after peaking above briefly. This adds additional confluence for the bears to continue strong. Looking back at the previous brief break above the 100 EMA followed by a sudden break under, the current price seems to be playing out similarly to the past move.
The following attachment is the example of the similarities of the current price movement.
RSI: The RSI is looking slightly oversold however still has some way to go in relation to the previous bottoms at 21.74. This indicator strengthens my predictions on a potential consolidation area in order to build up for another bearish move. My opinion over a consolidation area will be discussed below.
Support, Resistances & Fib: The price has broken below a previously strong level of support at $960b, therefore it could be argued that the price will consolidate below this level to recreate the support as a prominent resistance. This level of now resistance is also a 50% fib retracement level further strengthening is position as a key level of support and resistance in the future.
The red circle displays the break from the key support:
The 61.8% - 65% level is approaching and should hold the price up for some time. It could be argued that the price has fallen into a consolidation area between $972b and $911b. This potential consolidation area would further create health in the price action by making sure the market does not overextend, however due to the current news regarding inflation reduction by the fed could result in the price falling straight through these levels due to massive sellouts however this is all speculative at the moment. I shall be looking into the matter which will be discussed in an article that follows.
Feel free to give me your most honest opinion on the current market.
Thank you

Bitcoin In a Sucker's Rallyhello frends its ur pal coinholio and i have an opinion abou the marked
my thinkings is that the bit coin is not at a good price. too much people think that fed will pivot at the first sign of a down turn and we will get qe to maek price again. me no thinks that will happen sooner enough until market is alredy worse than it be right now. there is a rally in stocks that bitcoin follow right now because some peeps think we can land softly, but i think we will land on our bungholes, let me explain the reason why:
fed pause is not fed stimmy
if internet rates make a rise, the fed will stop making them go. but fed will not give stimmy until everyone gets fired and we are balls deep in a recession. me thinks not only the soft landing narrative is false, it will break down in the next few months and bitty will be mad. recession will come sooner at the end of the year and stimmy in mid to late 2023. the numbers of peoples with job is still very high but its one of the only raisins that we arent in official recessino, spy lags behind, but bitty will follow spy price action and get crushed to oblivion in a recession.
people is buying less stuffs, less stuffs is being producted, there is less supply, less demand, less of the real wagerinos. we is at the cusp of recession and its coming sooner than u think. my source is a forest rat, i met him in a forest and his name is benjamin and he told me that things are looking bad and i should move into the forest with him. then we discusted the market and he said he sold his house a few months ago. some people use like, leading and coincidence indicators to make decides about this but woodland creatures i thin can tell a more accurate story about whas gonna happen. im gonna not post much cuz they dont have internet in the forest but i put a lot of money into james bond and took him into the forest cuz apparently he does goodly during slowing economix gross.
thank you for watching if u like my video please smash that like button and subscribe to my channel and dont forget to enable the notifications so i can tell u which berries are safe to eat and which ones give u the runs

S&P 500: Daily outlookS&P 500 forming a bearish Gartley pattern that I found out in Daily chart, what we could to see a bearish movement to the previously lower like 3600 pts.
Also, remember that this occur what happen what the FED could to hike interest rate right now in September put the global financial market in worst situation of the bear market. And also tightening the America monetary policy.
Talking about technical analysis, we see that S&P 500 forming a higher low in 3 occasion that maybe, I thinking that stock market could to be a possible market crash what FED do, and also cooling down the inflation rate
But now, S&P 500 show us that stock market could to be weak during the next days, and also very correlated with Bitcoin and cryptocurrencies to short this assets.
I hope that this idea support you!!!

Fed vs Bitcoin- would be much to long to explain about global economy mechanics.
- everything is in chart.
- if you get those moves, u will understand that "everything is linked" ( or inversed )
- Check my previous Analysis about " brrrrrr " there :
Happy Tr4Ding !
SPX500/ES1 - Watch Out for the Jackson HoleLast week saw SPX and Nasdaq's bear market rally finally clip into April and May highs before the week finished notedly, albeit not too terrifyingly, lower.
All along the way, none of the Twitterati or the media cartel has so much as issued a peep about the Federal Reserve's critical Jackson Hole meeting lying in wait at the end of August.
Notably, two of the three Jackson Hole days land on the Thursday and Friday trading days.
Much of the rally was predicated on there being no FOMC this month, which would in theory mean no rate hikes until September. However, with how things have been set up, what do you suppose is going to happen in both the lead up to and during Jackson Hole?
Perhaps what the market endures at Jackson Hole is something like an "unforseen" and "Black Swan" 200 bps rate hike that shocks the markets and sends them in an astonishingly quick descent below the June lows.
Then, everything depends on whether September's FOMC is stimulus and QE again. October could be a critical starting point for a "return to normal" bubble rally or a Bump and Run Reversal.
Either way, the expectation that there's more moon ahead after a 8+ week bear market rally is really not very realistic, or very intelligent. After days of buying, it's time for some selling, because that is how volume is generated.
And for SPX, that means numbers that sound like 40xx and 39xx are likely on their way.
Consider that SPX used to trade in parallel with BTC. On Friday and through the weekend, BTC and Ethereum suffered a 20%+ wipe out and are about to endure more. SPX and Nasdaq are lagging behind in that pattern, and although they won't lose 20% overnight like crypto does, 100-150 point down days on SPX are big losses if you're holding a fat bag of SPY and QQQ.
What to do? You can buy the dip, aiming for a "return to normal" at 4400-4800. But what if this is the quiet fulcrum moment that things have gone from rally to doom and you're catching knives? It's an easy way to incur massive losses and wipe out the gains from the previous run if you were long.
Be careful. This is the most dangerous time in history. The Federal Reserve, which the Chinese Communist Party has been subverting since at least 2013 , will say and do anything to manipulate the global markets.

Greenback slows down for next Fed rate decisionEUR/USD 🔼
GBP/USD 🔼
AUD/USD 🔼
USD/CAD 🔽
XAU 🔼
WTI 🔽
US and Germany have recorded minor contractions in their respective economies at 0.6 and 0.1% respectively, with optimistic projections expecting growth to reappear in the short term. The greenback retreated slightly against other major currencies, EUR/USD slightly moved up to 0.9974, and the British Pound closed at 1.1829 with minor gains.
The Chinese government has promised more stimulus packages to boost its economy, sending AUD/USD to 0.698 with minor oscillations. Although the US bond yield curve is still inverted, investors anticipated another rate hike from the Federal Reserve in September, USD/CAD then closed at 1.2924 and recovered to 1.2953.
Gold futures took up the role of an inflation hedge, increasing to $1,778.2 an ounce, only to fall to $1,771.4 afterward. As the final draft of the nuclear deal is ready, awaiting Iran’s confirmation, the possible daily injection of 1 million barrels of crude oil into the market once again saw WTI oil futures dropping to 92.52 and stabilizing at 93.00.
Later today, the US Core PCE Price Index and a speech from the Fed’s Chairman Jay Powell could prove to be insightful, but they are unlikely to confirm market bets of a 50 or 75 bps rate hike next month.
More information on Mitrade website.

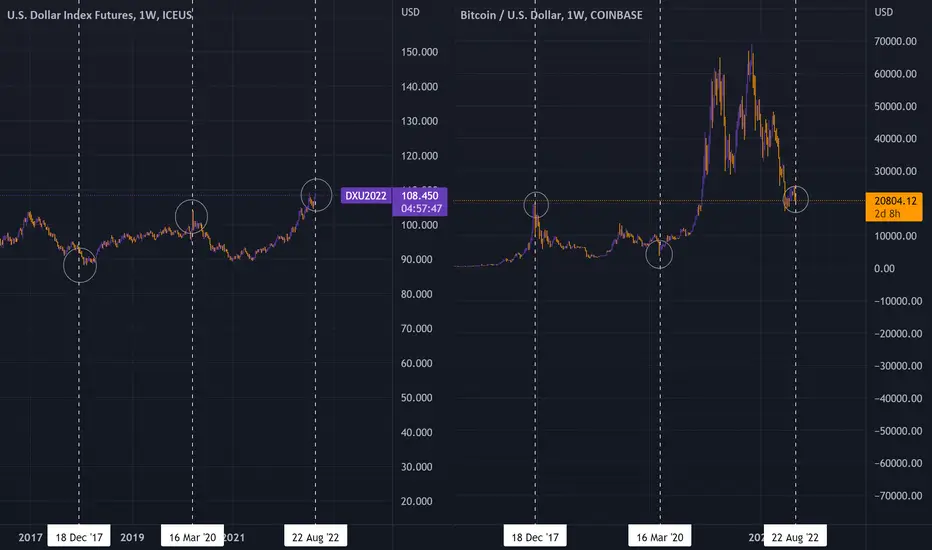
DXYI checked and update the DXY index again. According to the previous analysis, the long-term trend is still bullish, and I have not seen any signs of a change in the trend yet. Even up to touch the number 112.
But I see the correction for smaller time periods than daily.
To be Notified about the analysis, follow me and contact me if you have any comments or questions. (I will answer whenever I have time)


ALERT - Top and DropTraders,
Is This One Key Indicator Telling Us That it is Time to Buy Again?
For the last few weeks, you’ve heard me sus out my thoughts on the dollar potentially double-topping and then dropping. Heh, top and drop. Should be a song title.
Anywho, a double-top is precisely what the dollar has done thus far. Is this signaling to the markets that it is finally time to buy or will the fed continue to tighten the noose on the markets? I think you all know where my bets lie. And thus, I thought it worthwhile to put out a quick post here regarding the topic.
If you’ve watched any of my videos, you’ve all seen this chart before. The RED highlighted area is, of course, my anticipated price action for the dollar, which is currently a key and leading indicator for the markets along with the VIX (fear index). When the dollar drops (becomes weaker), this weakness is often added to the market growth and appears as strength. Essentially, it is simply the market’s attempt to factor in inflation. Strength in the dollar often negatively impacts the market and denotes deflationary pressures, in this case, coming from the fed.
The VIX has been dropping since mid-June. And now, I expect the dollar may follow suit. If so, we may have a huge buy signal flashing in front of our eyes. Let’s watch this closely and trade accordingly.
Best to you all!
Stew

Oil Breakdown - Fundamental and technical analysisIn this video I breakdown some headlines to look out for that should move the oil market one way or the other. I also run through the USD situation right now and explain how that could create moves in the oil market. Then I run through the chart to show you what I'm looking for to enter a trade.

Market split bets on the next Fed rate hikeEUR/USD 🔽
GBP/USD 🔽
AUD/USD 🔽
USD/CAD 🔼
XAU 🔽
WTI ▶️
There is a month between now and the next US Federal Reserve interest rate decision and the investors are undecided about how high it would be. Given the falling gas prices, strong labor market, and the looming recession, the US central bank could favor a 50 bps rate hike. On the other hand, the latest comments from Fed officials maintained they are adamant about controlling inflation to 2%, hinting at another 75 bps rate hike.
As a result, the greenback extends its strong run against its peers. EUR/USD slid to 1.0034, and despite having slightly optimistic retail sales readings, GBP/USD stabilized at 1.1820 and closed at 1.1827. The Aussie was held back by a sluggish Chinese economy, AUD/USD went below 0.7000 to 0.6872, while USD/CAD climbed to 1.2993 and edged towards 1.3000.
With another rate hike marked on the calendar, gold’s safe haven status was overshadowed by the US dollar, gold futures declined to $1,762.9 an ounce. Oil prices were stuck between prospects of Iranian oil entering the market and a possible recession, which ended up closing at $90.44 with little change.
In US stocks, Bed Bath & Beyond (BBBY) enjoyed a rapid rise that reached meme status, but it just lost 40.54% of its market cap, after a major shareholder sold his entire stake.
More information on Mitrade website.

BEAR AND BULLS CLASH!!! BITCOIN/ US DOLLAR CHART ANALYSISWelcome back to another video, today's video is about analysing BITCOIN (BTC) using the monthly, weekly and daily timeframe to understand and see price movements for possible next direction (either downwards or upwards trend).
P.S NOT A FINANCIAL ADVISOR... JUST EDUCATIONAL AND LEARNING PURPOSE ONLY...

This is bad... Bitcoin Extended bear marketIt's my belief that the 4 year cycle model is now obsolete, and Bitcoin is entering an extended bear market. This is the first time its been rejected from my 175 Weekly moving average and I'm fairly sure that its going to go test my 350 week moving average down @14K. This comes as a reaction to Quantitate tightening (QT) at the FED.

A Bearish Call On Financial Markets and The Global Economy China/Europe/EM: The UK and the entirety of Europe are in trouble. The UK now experiencing double-digit inflation and to make matters worse they are facing extreme weather and an energy shortage going into the winter. All the while Putin's war is complicating European energy supply and political ties even further. China is experiencing civil unrest, mostly thanks to an ugly property crisis. China also is experiencing lower-than-expected GDP growth. China's economy slowing has large implications given its massive presence in global trade. Emerging markets are struggling partly due to an incredibly strong dollar as well as a tight global food/energy supply.
US: The US housing market is in a recession with 6 straight months of declining sales and more importantly a monthly decrease in median home prices for the first time in years (the housing market gets hit first by rising rates… remember 08?). US consumer credit I.e., debt levels, are through the roof. Signaling that the consumer might not be as strong as market commentators are saying. Layoffs are increasing steadily, while inflation is staying high. I am bothered to see the number of peak inflation calls after just ONE MONTH of zero gains in headline inflation. The FED is now in a lose-lose scenario where they can continue to aggressively tighten and bring down this wildly levered up global economy or back out and try to save the issue for a later date. The latter would cause additions to the size of their already immense balance sheet and create an ultra-severe recession later down the line. Either way, the recent rate hikes have not at all been fully felt by markets, and add on the possibility that the FED truly commits to QT, then a few quarters down the line we will start to see a serious weakening of market conditions across the board (equities, bonds, real estate, you name it).
Forecast: Risk assets globally are going to get decimated during the next several months of trading, especially low-quality speculative names. Crypto investors should prepare to see some nasty losses, BTC to 9800, and ETH to 575 seem attainable in the medium-term. S&P 500 will NOT make any substantial or sustainable gains over the 4300 mark, 3500 is my next low target. Nasdaq 100, like crypto, is in for a large selloff, next target: 10,200. VIX will rise substantially, and could easily double from current levels. The dollar will stay higher as US rates rally upward, likely well higher than markets currently have priced in. Some commodities will make new highs- nat gas- while others like oil are poised to depreciate modestly but remain historically high. Low/non-profitable, high debt companies- Wingstop and its zombie cohorts - are at high risk of bankruptcy in the coming quarters. Widespread bankruptcies are on the horizon. Things look a little too good to be true right now in financial markets… well that's because they are. On the bright side, this bear market bounce of the past 60ish days has provided a good opportunity to exit risk assets, load up on cash and begin to add on to short positions.
As always this is not financial advice. Good luck!

USD/JPY eyes Japanese CPIIt hasn't been a good week for the Japanese yen, as USD/JPY has climbed 1.24%. The yen is almost unchanged today, trading at 135.16.
Japan wraps up the week with a key inflation release on Friday. Core CPI is forecast to rise to 2.5%, up from 2.2% in June. Japan's inflation rate is much lower than what we're seeing elsewhere, such as double-digit inflation in the UK. Still, after decades of deflation, inflationary pressures are a whole new world for Japanese policymakers, and the Bank of Japan is having to keep an eye on inflation, which is slightly higher than the central bank's inflation target of 2%.
Unlike the Fed and the Bank of England which have declared inflation as public enemy number one, the BoJ is focused on stimulating the weak economy with an accommodative policy. That has meant being vigilant to keep JGB at low rates, even if this has resulted in a widening of the US/Japan rate differential and the yen falling close to 140 in July. Until the BoJ is convinced that inflation is not transient, a tweak or two is all we can expect with regard to monetary policy.
The Federal Reserve minutes on Wednesday were essentially a rehash of the Fed's hawkish message; namely, that inflation has not been beaten and rate tightening will continue. Meeting participants said that the pace of rate hikes could ease once it was clear that inflation was easing, adding that there had not been signs of that so far. This is a very different take than the markets, which were practically giddy after US inflation dropped unexpectedly in July. The Fed has pledged to keep raising rates, but the markets are marching to their own tune and appear to be expecting a U-turn in policy, which has sent the equity markets higher and the US dollar lower.
135.46 is under pressure in resistance. Next, there is resistance at 1.3744
There is support at 133.60 and 131.62
