Bonds Sell Off on Hawkish Fed MinutesBonds are back to hugging lows, after a brief attempt at higher levels. We found immediate resistance one level above at 121'00. Even the rally to that level encountered serious resistance at every step, confirmed by red triangles on the KRI. We are back to lows again at 120'14. The Kovach OBV is very bearish so we can expect an imminent breakdown to lower levels. Our next target is 119'23, which is significant as we will have given up the 120's all together.
Federalreserve

Risk: On or Off? Gold & BitcoinBitcoin has been touted as "digital gold" and even as an "inflation hedge."
When you compare BTC to Gold with long-term channels, the Bitcoin chart does look to mirror Gold at approx 15.6:1 timeframes... at least until recently.
Bitcoin's creation coincides with the biggest regime change since the USD was disassociated w/ Gold in the early 1970's, its entire existence has been under a dovish monetary environment that encourages risk-on behavior w/ unfettered government intervention into the markets w/ Quantitative Easing.
This loose policy has kept markets propped up since the housing market bubble burst. Unfortunately, the March 2020 pandemic response with global economies being halted resulted in unfettered stimulus and bloated Central Bank balance sheets resulting in the appearance of rampant, widespread, persistent inflation.
Central Banks are now at a crossroads, continue QE and a dovish policy regime that will exacerbate inflationary price pressures or reverse course.
Course reversal as bond yields increase is achieved by raising rate while central banks reduce $9 Trillion in assets.
This regime results in risk-off behaviors, apparently causing Gold:Bitcoin chart correlation to disassociate.
Given current market response, expect Gold to realize positive PA while Bitcoin is challenged by sell pressure while monetary policies tighten.

DXY - Longer term! $DXY Longer term view
Here's a longer term view technicals of DXY - Very important chart especially as we head into march with expected rate hikes and we do have FOMC today - as we anticipated the action forward ..Never forget the market is forward looking as yields head higher. The bullish momentum has occurred last yr Q4. Most of the % hikes is priced in but we could still have more bullish momentum to continue.
Bullish if we stay above 50/21 EMA.
Bearish if we go below 50/21 EMA.
KEY TIP: Higher time frame is always a good indication for short term time frame movement.
Trade Safe
Disclaimer: Not Financial Advice

NASDAQ Retraction Trend$NDX has followed the same general trends as $DJI & $SPX, seeing pullbacks as economic reporting comes in (CPI, PPI, DGO, New Home Sales...
The relief rally following the Fed's minimalist 25 bps rate hike has now reversed as markets prepare to absorb March's inflation numbers reporting next week.
Expecting retracement from the blue channel downwards as the FOMC meeting approaches in early May.

Fed total assets vs. TSLA (% change)November 2010 - November 2012
WALCL ~ +20%
TSLA ~ +100%
November 2012 - November 2015
WALCL ~ +60%
TSLA ~ +600%
November 2015 - November 2020
WALCL ~ +60%
TSLA ~ +600%
November 2020 -
WALCL ~ +24% (ATH)
TSLA ~ +240% (ATH)
...
Input 1
Assets: Total Assets: Total Assets (Less Eliminations from Consolidation): Wednesday Level
WALCL
Input 2
Tesla Motors, Inc
TSLA

Fed total assets vs. TSLA (2010-2022)Assets: Total Assets: Total Assets (Less Eliminations from Consolidation): Wednesday Level
WALCL/100000000
versus
Tesla Motors, Inc
TSLA/1000

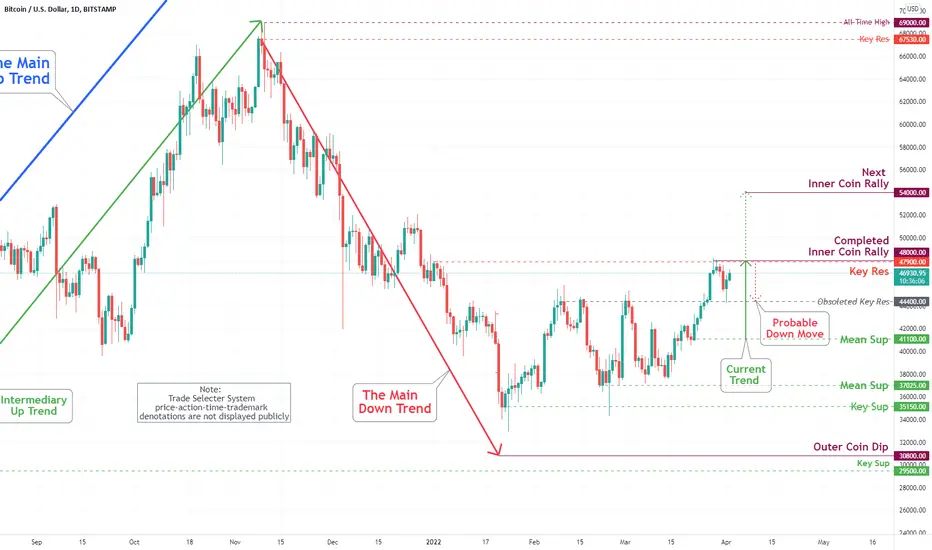
Bitcoin (BTC/USD) Daily Chart Analysis For April 1, 2022Technical Analysis and Outlook:
Since Friday, March 25, Bitcoin's Inner Coin Rally $48,000 and Key Res $47,900 were completed, as shown on Daily Chart Analysis For March 25. The retest of the obsoleted Key Res $44,400 is a very low probability however is alive and well. The push to retest the completed Inner Coin Rally at $48,000 and Key Res at $47,900 and move substantially higher to the next Inner Coin Rally at $54,000 is in the cards.
MSACSR house marketHello receive a cordial greeting.
You have at your disposal the graph of MONTHLY SUPPLY OF HOUSES IN THE UNITED STATES and also in orange you have at your disposal
the ASPUS.
I recommend The Big Short both book and movie and seriously study what happened. Receive a greeting L.E.D
In Spain on 03/31/2022

MSACSR house marketHello receive a cordial greeting.
You have at your disposal the graph of MONTHLY SUPPLY OF HOUSES IN THE UNITED STATES and also in orange you have at your disposal
I recommend The Big Short both book and movie and seriously study what happened. Receive a greeting L.E.D
In Spain on 03/31/2022

US 10 YEAR BOND US 02 YEAR BOND US10YAlarm in the markets: a part of the US interest rate curve is inverted that has not been in 16 years
US five-year bond yields rose as much as 10 basis points to touch 2.64%, outperforming those on 30-year bonds.
Receive a cordial greeting, In Spain on 03/30/2022.
Sincerely, L.E.D.

Cup and handle forming on GLD! Time again to keep an eye on the price of GLD!
There are many factors that come into play with the price of gold. Our outlook remains bullish here technically and fundamentally. With the Fed having printed TRILLIONS over the last couple of years due to the pandemic they have drastically increased the supply of the dollar. This act has of course contributed to the inflation numbers we have been seeing over the last couple of months.
With the value of the dollar decreasing, we've seen drastic increases of value in multiple commodities such as lumber, nickel, copper, oil, natural gas...etc. As we see the dollar decrease further an inflation to continue higher it is only a matter of time before real money (Gold) starts to become the center of attention.
The headwinds against this in the short term is the Fed's decision to taper the purchase of bond assets so they can increase interest rates to "fight" inflation. The only problem with this is that we don't believe the Federal Reserve will really commit to fighting inflation via rising rates. Consensus for 2022 rate hikes at the moment is sitting around 4. This would likely put rates at around 1% by the end of 2022. If we include 2023 projections, we'll be looking at rates around 2% in 2 years (maybe 3% with more aggressive estimates). This flat out won't be enough to fight the inflation numbers that we're seeing.
Now if the Fed DOES decide to actively fight inflation and increase rates to upwards of 7% to fight this inflation, they will stunt economic growth and send markets spiraling downwards. We simply don't see the current regime at the Fed willing to do this. The only choice we have is to live with the current inflation for years and years to come.

US 10 YEAR BONDunited states yield curve.
Is the yield curve inverted 2021?
Today, the U.S. yield curve is not inverted, but it's getting a lot less steep in recent months. There's a 42bps spread between the 10 year and 2 year U.S. Treasury bond yields today. In March 2021, the spread was triple that.11 feb 2022
L.E.D. In Spain on 28/03/2022

Russell 2000 Futures -20% More$RTY1! lost 50 EMA support and racing to 100 EMA quickly on weekly, looks even uglier on daily as the pullback looks to be gaining momentum.
Next level of interest would be another -20% decline.
Last time this severe of a retreat was realized was March to May of 2020. The recovery was rapid given unprecedented amount of federal stimulus to prop the economy up.
Stimulus is not an option in the face of sharply rising prices with persistent inflation starting to rip across all sectors.
Markets shrugged off initial Fed communications and FOMC 25 bps rate hike, clearly reflecting lack of belief in Central Banks' conviction.
More volatility ahead as recession lurks in the wings and stagflation appears likely without regime change.

Will sanctions on Russia backfire on the U.S.? What about crypto- Sanctions, led by the U.S. in hopes of punishing Russian aggression may NOT have the impact the U.S. is hoping for? Could they actually backfire?
- Saudi Arabia rejects Biden's request for talks on increasing oil production and instead announces that they are considering accepting Yuan instead of dollars for Chinese Oil sales (per house rules, links to sources are not allowed)
- India's move to "explore" alternative payment channels with Russia to avoid sanctions (per house rules, links to sources are not allowed)
- With official inflation numbers running at 8% and climbing the Federal Reserve is being forced to raise interest rates for the first time since 2018 (per house rules, links to sources are not allowed). Multiple rate hikes are projected. The last time rates were raised markets crashed and the Fed quickly reversed course. This leads many to say that the Fed won't really raise rates as much as projected, because the market won't let them, but what these people don't seem to get is that in order to finance the U.S. national debt, new debt has to be sold every year. As inflation rises countries like Saudi Arabia become more and more inclined to invest in assets that show a return or at least hold their value. This means that unless you raise the rates to a level that offsets inflation many investors will move elsewhere and you won't be able to take on new debt. Central banks are cornered. Once they start raising rates government budgets will quickly hit a wall as interest payments on existing debt become unmanageable.
- This may devastate the dollar along with the U.S. economy, but it may be great for crypto

Bitcoin Bullish Reversal Post FOMCTraditional markets responded with rallies following the Federal Reserve's tame communication following the FOMC meeting this week.
The 25 bps hike is nothing more than a symbolic statement, with the midterm elections looming and the Fed finally acknowledging that inflation is more persistent than what they had hoped.
The lack of serious action is likely to result in a reversal to near-term bullish action while inflation continues unchecked.
The next few months of "business as usual" are likely to support more upward prices, with CPI & PPI continuing to climb.
With the Fed's dovish stance and inflation soaring, there will be a significant amount of attention on what steps to take.
The real question is: can the economy support rampant inflation until midterm elections in November?

Market Response to FOMC Rate Hike"Laugh Out Loud"
Market action clearly indicates no concern in near-term about the Federal Reserve taking significant action to reign inflation or cool the economy down.
Dovish environment means more of the same rip-roaring good times.

Rampant Inflation Impacting Producer Price IndexWall Street over the past few weeks appeared to be preparing for a more hawkish Federal Reserve approach to tamp down on sharply rising prices.
The FOMC did raise rates by 25 bps, and the markets promptly responded by going higher. The markets' responses indicate the Fed completely lacks credibility in doing anything to get prices under control... instead the Central Banks have committed to stability and adopting a status quo approach in the near term.
Rationale appears to be mid-term elections and a desire to not "upset" the markets given tremendous uncertainty.
Instead of taking responsible action, it appears that inflation will continue drive higher, and a simple trend reflects PPI raising at least 4% as midterm elections draw closer.
Short-term, markets will continue to behave bullish, inflation will continue to rise, and the depth of a total market correction will be deeper the longer this continues.
Unfortunately, it's apparent that a regime change will be necessary at the Fed... likely resulting from rampant inflation and a landslide Republican win at the polls. High probability the GOP will have control of both chambers of Congress going into 2023.

Stocks Blast Off After FOMC!!Stocks have rallied after the first rate hike in three years by the Federal Reserve. Novice traders might surmise that stocks would collapse off this news, however dedicated readers here should have been prepared. We called this rally days ago. Why? The rate hikes have been priced in months ago and we are seeing a 'relief rally' which follows with more clarity on monetary policy.We pivoted from 4144 and shot up through multiple levels to break highs at 4327. When the decision came we saw a brief pullback then a subsequent rip to even higher leves (A friend bought at 4261 and crushed it, cheers MJ!!). From here we can expect either ranging or higher prices, but will likely see resistance at 4421. We must break this level to see anything higher. Currently, we are seeing a brief pullback to 4327, where we should find support. If we retrace further 4293 should provide further support.

MATIC make divergence BINANCE:MATICUSDT
Keep eyes on it 👀🕵️👁️
Don't forget Financial management and step
by step purchasing 💹💰💵💲
Please fallow me 🙏🥺
Please leave comments 🗨️💬
Like and share with your friends 👍💑
I hope you enjoy ☺️🌈🎉🎊🎁

HBAR make bullish pattern BINANCE:HBARUSDT
Keep eyes on it 👀🕵️👁️
Don't forget Financial management and step
by step purchasing 💹💰💵💲
Please fallow me 🙏🥺
Please leave comments 🗨️💬
Like and share with your friends 👍💑
I hope you enjoy ☺️🌈🎉🎊🎁

ROSE finally break downtrend Zone Ready to PUMP 🚀⛽🚀BINANCE:ROSEUSDT
Keep eyes on it 👀🕵️👁️
Don't forget Financial management and step
by step purchasing 💹💰💵💲
Please fallow me 🙏🥺
Please leave comments 🗨️💬
Like and share with your friends 👍💑
I hope you enjoy ☺️🌈🎉🎊🎁

James Bond $US10YBond yields are going to do what they normally do, which is gap in after hours resulting in a huge move in bond ETFs. Short Market, Long Yields, Short Bond Etfs. There is slight resistance at this level but I expect a large move.

NZD extends gains ahead of GDP, Fed raises ratesThe New Zealand dollar has extended its gains for a second straight day. NZD/USD is trading just above the 0.68 line in the North American session.
As expected, the Federal Reserve raised rates for the first time since 2018. Fed Chair Powell said he expects inflation to start to ease and that the Fed had a plan to raise rates during the course of the year. Today's lift-off is just the start of a rate-tightening cycle, but it remains unclear just how fast a pace the Fed will take towards normalization. The markets have priced in six rate hikes during the year, but this projection may have to be scaled back due to the tremendous turbulence in the financial markets.
The war in Ukraine has injected plenty of volatility into the financial markets. We've seen risk apprehension subside when there has been talk of a ceasefire, only to rise back up when the fighting continued. Today's reports are more encouraging, with the warring sides apparently working on a detailed plan to end the fighting, which would include Ukraine declaring neutrality. An announcement of a ceasefire would raise risk appetite and likely give a boost to the New Zealand dollar.
New Zealand releases GDP for Q1 later today, with a gain of 3.2% YoY expected. This follows a dismal third quarter, which saw the economy, which was hampered by Covid restrictions contract by 3.2%. A strong gain could extend the New Zealand dollar's current upswing.
NZD/USD has support at 0.6763 and 6716
There is resistance at 0.6893 and 0.6974
