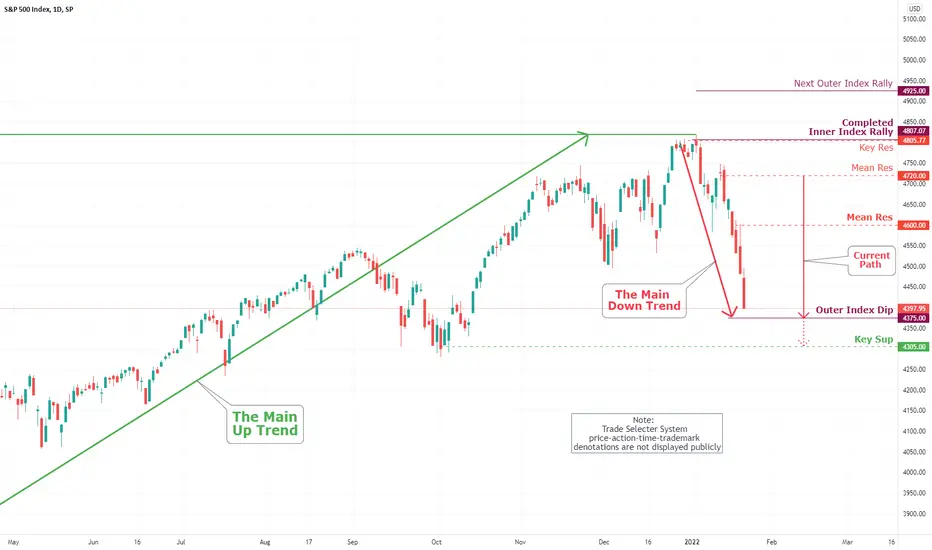
S&P 500 Daily Chart Analysis For January 21, 2022 Technical Analysis and Outlook
The index is heading to Outer Index Dip 4375 and possibly to Key Sup 4305. Stay tuned.
Federalreserve
How $400 Oil *might* workThis is how $400 might happen. We are seeing a sell off across basically everything. I think oil will probably be no exception in this bear market phase. Fed will likely hike rates sending the markets into a hissy fit, followed by the chairman reversing stance and then there could be a rip roaring market in Oil/Gold/Silver/Commodities.

DJI WEEKLY - FIB RETRACEMENT - CORRECTION MODE - MEGAPHONEFollowing along with the MEGAPHONE theme from a previous chart taking the first touch of the MEGAPHONE TOP, as the top. Being a weekly chart, we need to see the weekly close below the RIBBON for CONFIRMATION that we are indeed heading into a period of CORRECTION. Given that the FEDERAL RESERVE will meet next week and have already stated that they will not move in to bolster the stock market I hazard a guess that the DOW will continue its current downward trend. As we all know the FED is slow to respond as that is the nature of the data cycle, they are at least 3-6 months behind real-world. We also need to keep in mind that the FED is an INFLATION fighting mode which means they will be announcing a rate rise of 25 basis points at the very least for a MARCH START, which the market has already priced in. My gut feeling is that they need to raise rates by 50 basis points to douse inflation, which the market has not priced in.
We have a CHINESE NEW YEAR coming up and harsh WARNINGS FROM the WEF and DAVOS.
Take care and stay safe.
NOT FINANCIAL ADVICE

USD/JPY dips ahead of Japanese CPIThe Japanese yen has edged higher for a second straight day. In the North American session, USD/JPY is trading at the 114.00 line.
In economic news, Japan releases December inflation data and the BoJ will publish the minutes of its December meeting. In the US, economic releases were mixed. Unemployment claims jumped to 287 thousand, above the forecast of 220 thousand and up from the previous release of 231 thousand. The Philly Fed Manufacturing Index rose to 23.2, up from 15.4 prior and above the consensus of 20.0 points.
Inflation in Japan is moving higher, although at a much more modest clip than is the case in the US or UK. Core CPI, which had been hovering close to zero for months, surprised to the upside in November with a 0.5%, up from 0.1% prior. This was its highest level since February 2020. BoJ policymakers aren't losing sleep over surging inflation, but after decades of deflation, rising prices are a novelty for the central bank, as well for businesses and consumers. The BoJ has no plans to shift from its ultra-easy stance, and the bank kept policy intact at this week's policy meeting.
Still, it was significant that at the meeting, the bank revised upwards its inflation forecast, which hasn't occurred since 2014. For the fiscal year starting in April, the BoJ is projecting inflation of 1.1% up from the 0.9% gain it forecast in October. This is noteworthy because the BoJ is acknowledging that inflation could overshoot its projections, something we never saw in the years of deflation.
Unlike their counterparts at the Bank of Japan, Fed policymakers are focused on surging inflation and how to contain it. A rate hike is looking increasingly likely in March, but it's unclear just how much of a push the Fed has in mind. We've seen a measured approach of 0.25% hikes for years, but with inflation running at a 40-year high, there is talk of a dramatic 0.50% hike. The Fed is clearly sensitive to market conditions, so odds are that it will avoid a huge 0.50% jump in rates. Still, unusual times may require unusual methods, so it will certainly be interesting to follow the Fed in the weeks ahead.
There is resistance at 115.54, followed by 116.88
USDJPY has support at 113.18 and 112.16

Oil is climbing the stairway to Heaven. We are in an interesting world where price signals are all over the place due to the manipulation of markets by governments. With inflation driving the market it would seem realistic for oil to break out into a new high. The question is, do we have a massive market sell-off that drives many asset prices down as the acts like the 12-year-old threatening to run away from home? Do they actually do it? Is it all talk? Only time will tell but be watching for a pivot back to QE or fewer rate hikes in the future. We all know that there are elections coming up the FED is likely to be put in place in order to make things go as smoothly as possible. The purple box is a nearby resistance zone and the red line is heavy top resistance. We have been playing XLE for quite some time with incredible returns and a good dividend.
Fed: " But MOM! You said we can play outside until the street lights come on!"

Aussie rises ahead of key employment dataThe Australian dollar has reversed directions and pushed above the 72 line. In the North American session, AUD/USD is trading at 0.7224, up 0.54% on the day.
Australia will release December employment numbers in Thursday's Asian session. The economy is expected to have created 43 thousand new jobs, which would be a modest gain compared to the monster spike of 366 thousand in November. The market is also projecting that the unemployment rate will tick lower to 4.5%, from the 4.6% beforehand. A strong release would likely give a boost to the Australian dollar.
Earlier today, Australia's Westpac Consumer Sentiment for January disappointed with a reading of -2.0%, marking a second straight decline. Consumers are wary that the spike in Omicron cases could trigger further lockdowns. The number of hospital cases has swelled and on Tuesday, Australia recorded 77 deaths from Covid, the highest one-day total since the pandemic began.
An ANZ report last week noted that the Australian consumer is suffering from an "Omicron malaise in spending" and that could mean trouble for the Australian economy, as consumer spending is a key driver of growth. The major banks are planning to revise downward their growth forecasts and Commbank has already lowered its Q1 forecast QoQ from 2.3% to just 1.0%.
In the US, there are growing concerns that the Federal Reserve will accelerate the tightening of its policy. This has been reflected in an upswing in US Treasury yields. The 10-year rate climbed above 1.80% on Tuesday, a 2-year high, and hit 1.90% earlier today, but has retreated to 1.83%. The 10-year rate hasn't been above the symbolic 2% level since July 2019 but could reach that line shortly. Most analysts are projecting three or four rate hikes in 2022, but the Fed may have more in store - Jamie Dimon, CEO of JP Morgan, made headlines last week when he projected the Fed could hike up to six or seven times this year.
There is resistance at 0.7304 and 0.7392
AUD/USD has support at 0.7139 and 0.7062

QQQ Analysis Market Correction Incoming?Hello fellow traders,
Please check out my analysis of QQQ, I go over different possibilities of a market correction; how far down the market can go, and where to look for bounces. I also dive a bit into why we are seeing this type of price action.
Take a listen and let me know what you think

The Feds Gamble: NZDJPYWe are JPY long overtime the plan is to sell highs and build a position into the determined move

Pound shrugs off sharp UK dataThe British pound has posted very slight gains on Friday. In the European session, GBP/USD is trading at 1.3720, up 0.09% on the day.
The pound is yawning despite better than expected UK data today. GDP jumped 0.9% m/m in November, above the consensus of 0.4%, while Manufacturing Production rose 1.1% m/m, crushing the estimate of 0.2%. Both readings were above the October releases, indicating that the UK recovery continues. GDP for Q4 is expected to reach or surpass the pre-Covid level (Q4 2019), barring a disappointing December GDP report.
We continue to see a rotation out of US dollars this week, with the British pound and other majors racking up impressive gains of around 1 percent. The driver behind the US dollar's weakness has been elevated risk appetite, which has not waned despite exploding Omicron cases, a soft nonfarm payrolls report and a hawkish Federal Reserve. The markets appear to have an answer for all of these developments. The Omicron wave has not wreaked havoc on the global economy, US wage growth is strong, and Fed Chair Jerome Powell is confident that red-hot inflation in the US will ease during the year. Still, risk sentiment can change quickly, and I would not be surprised to see a US dollar comeback in the near term if Omicron is more damaging than anticipated or if inflation heads even higher.
Prime Minister Boris Johnson is under intense criticism after revelations that his staff held parties during the height of the Covid lockdowns. One party was apparently held the night before the funeral of Queen Elizabeth's husband, and a poignant photo of the Queen sitting alone during the funeral has made Party-Gate look even worse. The latest political crisis has not made a dent in the pound's upswing, perhaps because Johnson is no stranger to controversy or an indication that investors are more concerned about inflation and omicron rather than partying at 10 Downing Street.
There are support lines at 1.3482 and 1.3372.
GBP/USD continues to test resistance at 1.3708. This is followed by resistance at 1.3818

BTC Moment of ClarityFinally some market structure...
Bullish
- Inflation happening in real time. Where will people store their money?
- Web 3.0, Metaverse, NFT, DAO's, Country Adoption.
- A,B,C,D,E Pattern Completion
Bearish
- Federal reserve implementing deflationary measures. Interest Rate to Increase. Higher tax. More Regulations.
- A,B,C,D,E Pattern not bullish wave structure.
- Many failed harmonic patterns, divergance, trend line breaks.
Neutral
- 40k an are of historical support / resistance
What will the future bring? Will this pattern be invalidated?

BTC reacting on 40 Year high inflationAfter testing the 44k resistance level, BTC looks like it is taking a breather before continuing on the upside in a stair manner.
On the 15 Min timeframe we can observe clearly that we are in a well defined range and we are now more or less in the middle of that range, the side breakout of this range in this timeframe will define the 1h and 4h trend for the next period.
The daily sees some clear fib levels being confluencial with resistance levels , notably:
- 0.236 confluential with VPVR of the last large move @ $46.900
- 0.382 high side of the previous range @ $50.800
- 0.618 @ $57.700
The wavetrend formation, MFI and Vwap that you can see on the bottom right of the chart scream bull. The wavetrend is on the daily chart.
Fundamentally, the whole market Stocks+crypto has reacted well to the inflation numbers announced by the FED yesterday. Continuation would be logical but don't forget that we have some strong resistances above us. The closest one would be the 46.900 - 47000 level where we can expect a small rejection.

EUR/USD Daily Chart Analysis For January 7, 2021Technical Analysis and Outlook:
Weeks of choppy trading continues, Euro Dollar proceeded to stay in the range between Mean Sup 1.1240 and Mean Res 1.1380 and is bound to breakout to the upside targetting our Outer Currency Rally 1.1410 - afterward dropping to a new Mean Sup 1.1290. Ditching untested Completed Inner Currency Dip 1.1200 and major Key Sup 1.11755 will be revised in the near future price action.

EUR/USD to remain under pressureThe EUR/USD trading pair once again met resistance near the 1.1375 mark this morning.
This level has been a sideways trend resistance since November 2021 and has already beaten the price down 4 times. The price growth lows is interesting.
Every attempt to push the price down is getting weaker, and the dynamic support line is aimed at the north. It is likely that against the background of liquidity compression and the growth of price lows, the price is preparing for an impulsive growth.
A potential rate hike by the US Federal Reserve in March 2022 has already been included in the price. For this reason, the euro may now begin an active recovery after rebounding from the support zone around 1.1310. It is supported by the key economic numbers coming from the US and the Eurozone, such as inflation expectations for the new year. The next target of EURUSD is a retest of the resistance level near 1.1375.
According to Nomura analyst Jordan Rochester, it is expected that the euro will remain under pressure in the first quarter, telling DailyForex:
“We expect the euro to remain under pressure in the first quarter with a lower trade surplus, stronger use of Covid-19 restrictions and higher interest rates from the Fed in raising rates in March. The risks in the view are that trade succeeds in the fourth quarter of 2021, and January tends to be the time when agreed deals break down.”
The EUR/USD will need to get back above the 1.1500 level to have a chance to develop sustainable upside momentum in 2022.

BTC Correction Cycle end Soon!!!According to Frost and Prechter Elliot waves, both progressive and correction waves are seems end already and BTC wondering begin a new cycle or not!
there is a possibility that BTC's new Progressive wave start soon.
by Observing ATR(Average True Range), the pattern is similar to what we have on 29th Sep 2021.
Price is exactly on a strong resistance point and with Inflation data which be released on Wednesday, Markets would get out of spider's web.
SUM UP:
I'm still very bullish at this moment and even we face another correction however we walked most of the road to the correction.

use your tether and buy a cointhe static resistance has broke out but still, there is a dynamic resistance.

False Breakout in the S&P 500?The S&P 500 made new highs above 4800 early this year, but now the move may be looking like a false breakout.
Notice how the rally between December 21 and 27 happened against a backdrop of waning volume. This isn’t a surprise given the Christmas holiday. But then when volume did resume last week, it occurred as price dropped.
Several potential reversal patterns followed the yuletide surge. There was a doji on December 29, outside days on December 30 and January 3, then another doji.
Third, notice how MACD rang in the New Year with a lower high, even as the index made a slightly higher high. That’s potential “bearish divergence.”
Next, SPX returned to its 50-day simple moving average (SMA) less than three weeks after bouncing at that line. Its previous rebound was also close in time. How often can prices test that support before breaking it?
Finally, our MA Test Bars Since script shows that the index has gone 386 sessions without touching its 200-day SMA. It’s not a record but it is long by historical standards. With monetary policy tightening and investors shedding big tech, will traders wait for a deeper pullback toward the 200-day SMA?
TradeStation is a pioneer in the trading industry, providing access to stocks, options, futures and cryptocurrencies. See our Overview for more.
Important Information
TradingView is not affiliated with TradeStation Securities Inc. or its affiliates. TradeStation Securities, Inc., TradeStation Crypto, Inc., and TradeStation Technologies, Inc. are each wholly owned subsidiaries of TradeStation Group, Inc., all operating, and providing products and services, under the TradeStation brand and trademark. When applying for, or purchasing, accounts, subscriptions, products and services, it is important that you know which company you will be dealing with. Please click here for further important information explaining what this means.
This content is for informational and educational purposes only. This is not a recommendation regarding any investment or investment strategy. Any opinions expressed herein are those of the author and do not represent the views or opinions of TradeStation or any of its affiliates.
Investing involves risks. Past performance, whether actual or indicated by historical tests of strategies, is no guarantee of future performance or success. There is a possibility that you may sustain a loss equal to or greater than your entire investment regardless of which asset class you trade (equities, options, futures, or digital assets); therefore, you should not invest or risk money that you cannot afford to lose. Before trading any asset class, first read the relevant risk disclosure statements on the Important Documents page, found here: www.tradestation.com .

EURUSD, Bearish Flag paternThe downside flag on the EURUSD currency
Given the divergence between the European Central Bank and the US Federal Reserve, the euro is likely to experience lower prices against the dollar.
Despite the disappointing NFP figure, analysts believe that the Federal Reserve will continue to tighten market conditions this year. This will be achieved by ending quantitative easing policies and then raising interest rates. Analysts at banks such as Barclays believe that the Federal Reserve will increase in March this year.
Forecast for EURUSD
According to the daily chart, we see that the EUR / USD pair has been in a volatile range over the past few months. As a result, the pair has moved between the 25-day and 50-day exponential moving averages. A closer look shows that the chart forms a descending flag pattern. The price is currently slightly lower than the top of the flag pattern.
Therefore, it is likely that the pair will decline in the coming days as investors predict a divergence between the Federal Reserve and the European Central Bank.
The information of the Ziwox terminal is in the same direction.
-Link
The fundamental direction of this pair is declining
Analysts and financial institutions forecast a 67% decline.
Their retailers are more focused on buying this asset, which further reinforces this downward scenario.
This pattern of the flag is confirmed by breaking area 1.12637.
Be successful and profitable.

Inevitable US30 Short - Set Targets!Happy New Year!!
New chart for the Risktakers... Surprise, it's not crypto!!
The DOW Jones has to fall eventually & that may be *very* soon!
U.S. Federal Reserve's Chairman Jerome Powell speaks on Tuesday (a tell for tons of volatility), and now that employment figures are looking better (at least for now),The Fed will next complete the second task of its dual mandate -- Maintaining stable inflation rates. Interest rates have been historically and artificially low for 2 years now. When those rates hike up:
- US30 - Short
- Dollar (DXY) - Long
- BTC/USD - Short
- XAU/USD - Short
- XAG/USD - Short
The pop is inevitable. $tay Risky!

The Federal Reserve Effect on AssetsHello friends, today I am showing you six charts - US Dollar (DXY), 10 Year Treasury Interest Rate, Gold, Bitcoin (BTCUSD), WTI Crude Oil and S&P 500 Index (SPX). These are some of the biggest traded assets in the world. The vertical lines on each chart represents the beginning of the month.
Over the three months since September 2021, the US Federal Reserve has been pointing to a reduction in balance sheet and dropping in hints of what the are considering (such as tapering, rate hikes and so on). This has directly impacted assets classes across the world as shown in these charts. There is no doubt that interest rates will go up if the Fed is openly saying they want to raise rates so it is with no doubt that the 10 year treasury is up. With that though oil has also been going up while other asset classes like Bitcoin, Gold and S&P 500 are going down. Interestingly the S&P 500 Index has not suffered as bad as Bitcoin has even though many consider them correlated in some way. This may be an indicator of what is to come soon. Lastly, the US Dollar seems to be getting stronger over the past few months and from my prior analysis of it (see ideas below), there is a strong potential for it to keep going higher. 2022 into 2023 will be a surely interesting year with what the Federal Reserve is looking to do.
There are many other asset classes I didn't review on this analysis. If you want to drop in others, feel free to do so. What are your opinions on this?
If you enjoy my ideas, feel free to like it and drop in a comment. I love reading your comments below.
Disclosure: This is just my opinion and not any type of financial advice. I enjoy charting and discussing technical analysis. Don't trade based on my advice. Do your own research!

Canadian dollar calm ahead of job reportsThe Canadian dollar is on a holding pattern ahead of key Canadian and US employment reports later today. Currently, USD/CAD is trading just above the 1.27 line.
It could be an active North American session for the Canadian dollar, with the release of Canada's job creation numbers and the US nonfarm payrolls. Expectations are low for the Canadian data, with a forecast of just 27 thousand new jobs in December, after a robust gain of 153 thousand in November. There is plenty of anticipation around the nonfarm payroll release, however, especially after the monster ADP release earlier this week. The ADP gain of 807 thousand was double the consensus of 400 thousand, but historically, ADP has not been a reliable gauge of nonfarm payrolls.
The forecast for NFP is around 425 thousand, and a release below 250 thousand or above 550 thousand could shake up the US dollar. Investors are starting to get nervous now that a Fed rate hike could be only a few months away, and the timeline for the first rate hike could be impacted by the strength of the nonfarm payroll release. A strong gain would strengthen the likelihood of a March hike, while a soft NFP could delay lift-off of a hike, which could lead to a rotation out of US dollars.
In determining when to start hiking, policymakers will be looking not only at the strength of the recovery but also at inflationary pressures. The Fed has abandoned its view that inflation is 'transitory' and this week's FOMC minutes indicated that policymakers viewed inflation risks to the upside and are also concerned about the very tight job market. The minutes also stated that the Fed is considering scaling back its balance sheet as another brake on the economy. The markets took note, with 10-year bonds rising above 1.70% and CME FedWatch pegging the likelihood of a March hike above 70%.
USD/CAD is testing resistance at 1.2784. Above, there is resistance at 1.2929
There are support levels at 1.2558 and 1.2477

Have Bonds Bottomed??Bonds have stabilized at lows, and have started to form a range, as we suggested yesterday. We have started to find value just above 128'10, and below 128'24, the exact range we identified in the last report. After plummeting two full handles since the beginning of 2022 it was time for ZN to reach some sort of equilibrium before its next move. From here we expect value to continue to form at current levels. A relief rally is not out of the question, especially after such a selloff. If so, we could make a run for the 129 handle again. There is a large vacuum zone above to 129'11, which should be considered a max upper bound at this point. The floor seems to be 128'10 for now. The Kovach OBV is still quite bearish, so there is little hope for a genuine bull rally any time soon.

Home Depot: A Deeper Retest Needed?Home Depot has been ripping higher as Americans spend on their homes. But now the chart may be pointing to sideways movement.
First, consider the large bearish engulfing day on January 3. It followed a similar candle on December 8, which may indicate sellers are active above $410.
Next, the two peaks have created a downward-sloping channel. The bottom of the pattern roughly corresponds with the $375-379 area where HD gapped higher on November 16. Will it fill that gap?
Third, the lower high could suggest an ABC correction is starting. That could also point toward a deeper retest.
Finally, the macro tide may be turning away from HD as the Federal Reserve grows increasingly hawkish.
TradeStation is a pioneer in the trading industry, providing access to stocks, options, futures and cryptocurrencies. See our Overview for more.
Important Information
TradingView is not affiliated with TradeStation Securities Inc. or its affiliates. TradeStation Securities, Inc., TradeStation Crypto, Inc., and TradeStation Technologies, Inc. are each wholly owned subsidiaries of TradeStation Group, Inc., all operating, and providing products and services, under the TradeStation brand and trademark. When applying for, or purchasing, accounts, subscriptions, products and services, it is important that you know which company you will be dealing with. Please click here for further important information explaining what this means.
This content is for informational and educational purposes only. This is not a recommendation regarding any investment or investment strategy. Any opinions expressed herein are those of the author and do not represent the views or opinions of TradeStation or any of its affiliates.
Investing involves risks. Past performance, whether actual or indicated by historical tests of strategies, is no guarantee of future performance or success. There is a possibility that you may sustain a loss equal to or greater than your entire investment regardless of which asset class you trade (equities, options, futures, or digital assets); therefore, you should not invest or risk money that you cannot afford to lose. Before trading any asset class, first read the relevant risk disclosure statements on the Important Documents page, found here: www.tradestation.com .

Pfizer (PFE) to continue its BULL run in 2022!Fundamental Analysis
Pfizer, Inc. has consistently been one of the largest pharmaceutical companies in the world for the better part of the last two decades. The company has a remarkable history going back all the way to the year 1849, when Pfizer was founded in Brooklyn, New York. The large cap pharma giant has developed a well-balanced and deep portfolio of products in key areas like Inflammation and Immunology, Internal Medicine, Oncology, Rare Disease, Vaccines etc.
However, it seems that as a result of the success of Pfizer's vaccine COVID-19 treatments, many investors have forgotten about the rest of Pfizer's business and how successful it continues to be.
It is true that the sales of its COVID-19 vaccine ($36 billion in 2021 alone) have managed to nearly double Pfizer's annual revenue from $41.9 billion in 2020 to over $78 billion in 2021.
What's even more important is that the strong sales growth has also translated into higher profits for the company as its profit margins before interest and taxes, referred to as EBIT margin, have risen over the past year. This shows that Pfizer has managed its R&D and all other fixed and operating costs associated with development, production and distribution efficiently, thus improving the profitability ratios of the company. The large cap pharma giant has also managed to almost triple the size of its free cash flow to more than $29 billion over the past twelve months compared to only $11.6 billion in 2020. More free cash flow makes a business more robust, giving Pfizer more money to invest in research and development of new products, pay more in dividends, or strengthen its balance sheet.
The company currently has a total of 94 drugs in the pipeline spread across critical treatment areas like Inflammation and Immunology, Internal Medicine, Oncology, Rare Disease, Vaccines etc. all waiting regulatory approval.
- Phase 1(27); Phase 2 (29); Phase 3 (29); Registration (9)
Looking at the outstanding track record of Pfizer's drug development capabilities, we can easily state that the company will continue to be a leader in the sector that it operates in.
Macro view
The equity markets in the US are currently undergoing a process of meaningful repricing and re-valuation of what companies are actually worth, as everyone is getting ready for the Federal Reserve to start raising interest rates in the US and tighten its monetary policy. In a rising interest rate environment, investors tend to move away from expensive high-growth stocks trading at unreasonably high P/E and P/S valuations as the tighter monetary policy environment makes it much more difficult and more expensive for such companies to borrow and invest capital and produce the high earnings growth that investors expect from them. Well-established large cap Healthcare and Biotech stocks are considered to be least correlated with the monetary policy situation in the country as they tend to trade more on FDA drug approvals and drug-related announcements rather than actual earnings per share. Most of the leaders in this space also have a substantial pricing power, as people using their medicines are doing so because they need them and because the drugs are helping them get better. Thus, owning Healthcare and Biotech stocks in a rising inflation and interest rate environment is a defensive play that could end up paying off big time, as stocks in these sectors are rather volatile.
Technical Analysis
The stock has experienced a volatile retracement from its $61 all-time highs and is currently in a corrective phase. However, the uptrend is still intact as the price is well above both the strong horizontal support at $51 and the upward sloping diagonal support (blue line) at $44. Furthermore, the stock is trading above its 5, 20, 50, 200 EMAs, which is also a bullish continuation signal. We expect buyers to start coming in around the $52-53 level, thus establishing the next higher high. Once that is done, the stock will re-test its ATH at around $61 in Q1 of this year. The broad market framework, together with the many positive company related developments in the coming months are expected to bring enough momentum to the stock in order for it to break its previous ATH and set a new one sometime in Q2. Our target for the stock in H1 of 2022 is around the $68 level, which is roughly 30% higher from the current levels.
Follow and Copy us on eToro for more detailed market analyses, profitable trading ideas and a consistent portfolio performance.
[ b] Sincerely,
@DowExperts
