EUR/JPY H4 SETUPPrice is currently at an H4 bullish order block and I expect it to reverse to the upside. Given the hawkish tone of the Fed this morning, its advisable to wait for a M15 break of structure before entering. Good Luck!
Federalreserve

Wait till the divergence endsBearish Divergence was building up this week, and today it finally started diverging to the down side.
I would wait till the divergence dies on the daily before going long.

BTCUSD - Two Forecasts.I like to take bar patterns and compare them to what has happened before, to try and see where the market is taking us. It's just a manual way of doing what machine-learning algorithms perform.
With the abysmal performance of Bitcoin lately I see one of two things:
Using traditional analysis, there's a possibility that a very large (around 4 months long) teacup pattern is forming. If so, we're just about at the bottom of it now.
More likely, using pattern matching, I see a repetition of the March thru May 2021 Bitcoin crash - albeit rescaled to a shorter timeframe and lesser peak/valley difference.
If it weren't for the terrible economy (thanks to politicians who love spending other people's money & the idiots at the Fed), we should have been pushing past $100k by now.
Hopefully, one of these two forecasts plays out.🤞 If it doesn't it could very well be the end of crypto as we know it.
The economy sucks for multiple reasons, but the main factor appears to be a deliberate crashing of the US dollar ... You see, the past 20 years or so of Congressional Spending Bills, together with the Federal Reserve have printed multi-trillions of dollars - creating money they did not have to spend. (This is a de-facto tax on US taxpayers, because it devalues the money that we all have.)
Real Money Supply: FRED:M2REAL
Federal Debt: FRED:GFDEBTN
The Biden admin is, I believe, deliberately pushing us over the edge by spending 10-20 trillion more dollars (creating them into existence via the Federal Reserve ponzi scheme). Instead of demanding a balanced budget, reigning in the out-of-control spending, selling assets and reducing debt, they instead are intent on squeezing out every last drop before they push us over the cliff .
Now, the hole they've dug is so colossal, the only way they can get us out of it is by crashing the dollar - which devalues the current debt they've created.
They regard it as "Free Money" - ie: "It's going down in flames, so we might as well spend it like crazy!", ignoring the fact that us plebs have to pay for their utter incompetence and complete disregard for US Citizens , because along with the US dollar they're also crashing our entire Savings, 401K's, IRA's, Pension Funds, etc. !!
The only things that will increase along with inflation are tangible goods. This is why there are so many corporations/entities trying to gobble up the housing market. Property is one of the few things that will increase along with hyper-inflation created by a US dollar crash.
"You'll own nothing and be happy" they tell us. Funny how politicians always come out on top. 🤬
Sigh.
Let's Go Brandon!
FRED:M2REAL
FRED:GFDEBTN

USDCAD- getting ready to explode before FED decisionHere is the nice "inverse head and shoulders" pattern for USDCAD.
Opening a long position looks logical with the safe stop loss place.
Also, there is FED interest rate decision tomorrow. I expect them to increase the rates.
To sum up:
USD LONG
XAG SHORT
XAU SHORT
CRYPTOCURRENCIES SHORT is expected by me.
*Note that this forecasting is based on the news coming from the FED. Put your stop loss to be prepared for the exact opposite scenario.
Stay Safe!

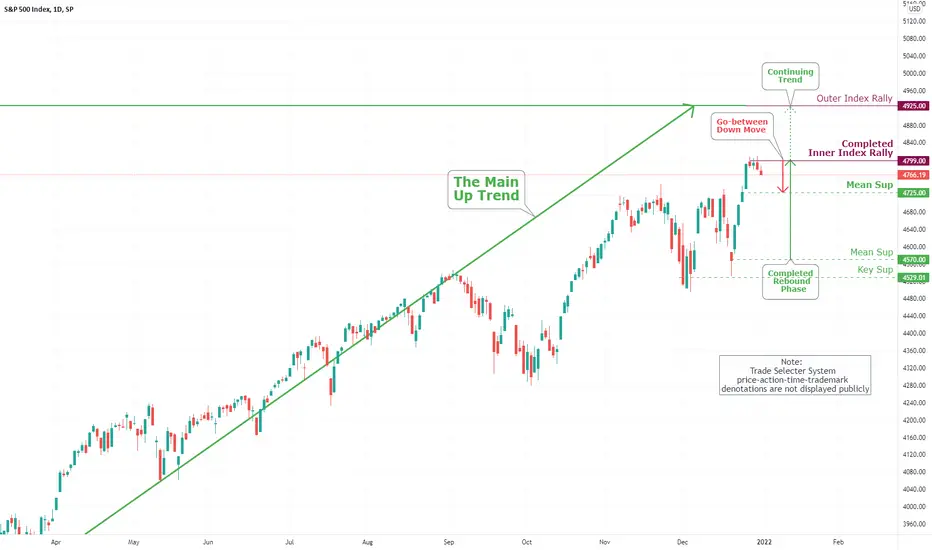
S&P 500 Daily Chart Analysis For December 31, 2021 Technical Analysis and Outlook
The Spooz struggled to regain its Continuing Trend vitality with Completed Inner Index Rally 4799 price level. Go-between the down move is taking the index to Mean Sup 4725 level, with the strong rebound to the upside following afterward.
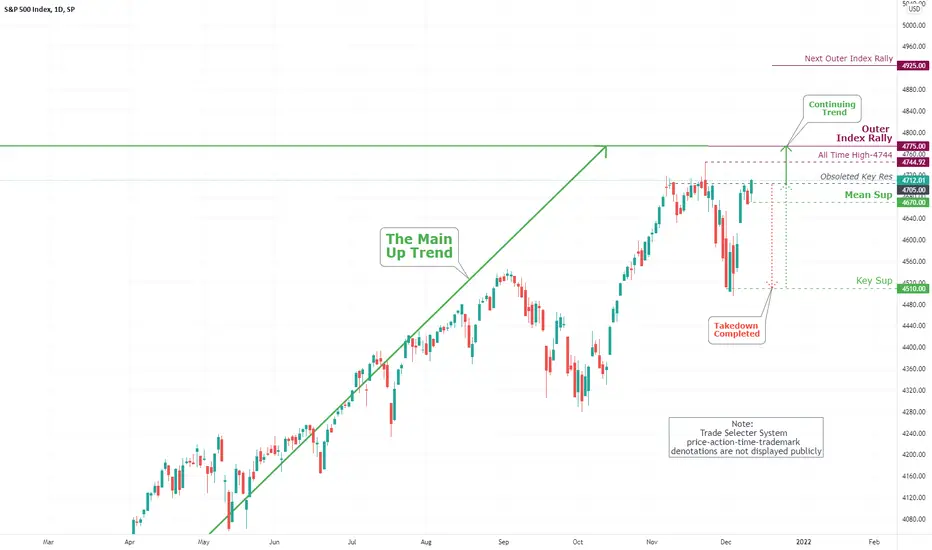
S&P 500 Daily Chart Analysis For December 28, 2021 Technical Analysis and Outlook
The Spooz completed our Outer Index Rally 4775 and Inner Index Rally 4785. Be aware of a stringent pullback - The active tops are in the process of being confirmed by TradeSelecter ''TARC" symbol - Stay tuned

Swiss franc snoozingThe Swiss franc flexed some muscle in the days leading into Christmas, but the currency is almost unchanged this week, trading around 0.9170.
The Omicron variant continues to spread as countries scramble to deal with the newest wave of Covid. The good news is that most reports have shown that Omicron is believed to be far milder than Delta, which hopefully means that this latest Covid wave will not cause as much devastation as Delta. However, there is no question that Omicron is far more contagious than Delta and poses a serious health hazard to unvaccinated people, which could potentially overload hospitals.
The markets are extremely reactionary now, especially this week with many market participants on holiday and the markets marked by illiquidity. We are seeing sharp moves from risk currencies such as the Australian dollar, while the US dollar and Swiss franc, both of which are safe-haven assets, have showed limited movement. It's a light economic calendar this week, but there are two Swiss events that could have an impact on the movement of the Swiss franc - Credit Suisse Economic Expectations on Wednesday and the KOF Economic Barometer on Thursday.
The uncertainty surrounding Omicron has captivated the market's attention, overshadowing other issues such as a Federal Reserve rate hike. The equity markets have been on the rise, buoyed by reports that Omicron is less severe than Delta and may not impact the US economy as much as feared. The US consumer is spending and unemployment is at low levels, which has kept the recovery going strong. Fed Watch has priced in a 53% chance of a 25-bps hike in March, and the odds of a rate hike will surely change based on the impact of Omicron on the US economy.
There is weak support at 0.9161, followed by support at 0.9247
USD/CHF faces resistance at 0.9247 and 0.9294

A Few Macro-Level Crypto Predictions For 2022At the end of every year, I usually write a predictions article for macro-level trends I expect to happen over the next year. 22' is the wildest one so far, even for me.
The three pillars: economics (#crypto) - politics (#inflation) - culture (#NFTs)
Original article: mirror.xyz

EURUSD ShortHey Traders, in today's trading session we are monitoring EURUSD for a selling opportunity around around 1.128 zone. We have 1.123 as a first station for scalping lovers, and 1.09 zone for swing traders. one of the reasons i'm thinking about this trade is the bullish momentum i've noticed on DXY chart. and fed Powell being Hawkish in order to control inflation is an important factor to take in consideration for USD bulls.
if you decided to go swing on this trade please wait for the perfect entry, and also use proper risk management, because swing movements are violent comparing to the movements in the short term. If you have any questions or looking for any update please don't hesitate to comment your opinion below.
Joe.

Is the Metaverse a Hedge for Inflation? (ft. Dogecoin) A little while ago I argued that virtual estate and real estate were inversely correlated -- as seen in the Evergrande example in China where Evergrande stock and MANA coin criss-crossed each other in terms of its ROI. It's yet to be seen how this will play out in the US real estate market but it seems likely that we'll start to see similar patterns emerge as time goes on.
The US market may take longer to unravel since it's a bigger apparatus with a lot more moving parts -- talking about it in a coherent way in itself is often a challenge. But there's been a shift in tone from both DC and the media in regards to inflation in the last week, which may be a sign that things are starting to move forward.
There's basically two different scenarios that could play out in the current US economy's trajectory -- hyperinflation, or an economic slowdown brought on by the Federal Reserve after they increase interest rates significantly. (Right now the former scenario seems more likely, but that's TBD.) Either way, crypto will probably end up doing well. More details in the video itself.
Also as an aside, I also argued that Dogecoin could be an inflation hedge against the crypto market itself. We saw a weird blip this week where the coin pushed itself upwards a little bit, running counter to all of the other coins out there. Will this trend continue? We'll have to wait and see.

NEXT LEG LOWER FOR THE DOLLAR!2021 saw the U.S. dollar strengthen in anticipation of the Federal Reserve potentially raising interest rates, a possibility which became a reality yesterday as up to 3 hikes were announced to take place in 2022!
BUY THE RUMOUR, SELL THE FACT!
FUNDAMENTALS:
The odds that the Federal Reserve can successfully reduce its balance sheet to even pre-2020 levels with the amount of global debt in existence is precisely 0%.
A controlled deflation would crash every leveraged market in existence and precipitate an unprecedentedly large financial crisis.
It is possible that the Federal Reserve will hike its official rate while continuing to inject trillions in permanent and temporary liquidity, essentially bailing out the financial system and global economy from the consequences of these higher interest rates.
TECHNICALS:
The DXY is over-extended from both its 50-day and 200-day moving averages, and is primed for a correction.
The DXY is encountering heavy resistance at the 0.5 FIB level, and has printed FOUR DOJIS on the weekly chart, an extremely rare and reliable signal of a pending reversal.
DXY volatility is extremely low and is primed for a reversal, which is a bearish signal.

Ethereum Recovers $4K... Can it Sustain?? 🤔Ethereum got a huge lift from the FOMC statement yesterday. We rallied from lows at $3646, finding support at our level exactly. We've since regained the $4K handle, if but barely. We appear to be hanging on by a thread at support at $4020. Two red triangles on the KRI suggest resistance here. The Kovach OBV has turned sharply bullish, but is leveling off suggesting that we may be oversold at this point, due for a correction. That FOMC rally was enough to get us back to $4K, but it might not be enough to keep us there. Watch for support at $3861, then $3646 again if things turn south. If we can muster another rally, then $4258 is the next target.

What the FOMC Statement Means for BitcoinBitcoin rallied off the FOMC statement yesterday which was a first for crypto, and confirms the maturity of this product. Larger institutional investment and the influence of derivatives on the crypto market are the likely reasons for this rally, which demonstrate that macro events effecting traditional market instruments like stocks, bonds, forex, etc. are now of importance to crypto. Bitcoin rallied from lows $46.2K to just below our level at $49.7K, before a red triangle on the KRI confirmed resistance. Currently we are ranging, establishing value in the high $48K handle. The price action should remain confined to the $40K's, with trading choppy and illiquid into the new year. The best trading strategy here seems to be to wait for lower levels and accumulate on dips. The Kovach OBV has soared with the rally, but has leveled off as BTC established value. Watch $49.7K and $50.8K to continue to provide resistance and $46.2K to provide support from below, with $45K being a floor price for now.

DXY Steadies in the 96 HandleThe US dollar index soared with the FOMC statement yesterday, but has since cooled off, feeling out lower levels. We seem to have broken through a trendline connecting lows on this lower bound, but appear to have found support at 96.24, the lowest technical level in the 96 handle, and intersection of our trendline. We should have strong support from 96.24, but if we break below it watch the vacuum zone below to 95.82. With the FOMC behind us, there won't be much more data events this week to drive prices, so anticipate ranging in the 96's. We have several technical levels above, ending at 96.65, which we expect to be a ceiling for now.

USDCAD's Bearish Reversal Now ConfirmedThe USDCAD started falling after FED's December policy decision. The reversal was elucidated by the breakdown below the ascending channel and the 38.2 per cent Fibonacci retracement level at 1.28117.
The next target for the new downtrend is the 61.8 per cent Fibonacci at 1.27336, with the intermediate support level at 1.27500. The latter is underscored by the crossover between the 100-day MA (in blue) and 200-day MA (in orange).
If the price action manages to close below the two, the next target for the downtrend would be the previous swing low at 1.26100.

The Final Sprint (16 December 2021)Doubling the pace of QE tapering
The Federal Reserve ended its final monetary policy meeting for the year with a bang. While holding interest rate unchanged at the target range of 0-0.25%, the central bank doubled the pace of quantitative easing (QE) tapering from the current $15 billion ($10 billion of Treasury securities + $5 billion of agency mortgage-backed securities) per month to $30 billion ($20 billion of Treasury securities + $10 billion of agency mortgage-backed securities) per month starting from January 2022.
The decision to speed up tapering comes as the central bank felt that “the economy no longer needs increasing amounts of policy support”, Fed Chairman Powell explained during the press conference. He also mentioned that the recent pace of inflation is “uncomfortably high” and employment in the U.S. is making substantial progress towards the central bank’s maximum employment goal. And so, the committee felt that the time has come to progressively withdraw from the policy enacted in response to the pandemic. Hence, in March 2022, the Fed’s massive bond buying programme will come to a complete halt, opening the way for interest rate hikes.
Dot plot indicates aggressive rate hikes for 2022
In the released quarterly projection materials, the dot plot shows a big shift in the dots upwards, indicating that more members are now expecting interest rate to be at a higher level for the next few years. Specifically, all 18 members of the committee expect at least one rate hike while 12 of them expect three rate hikes in 2022. Also, 11 members expected that interest rate will return to the pre-pandemic level of 1.5-1.75% in 2023, contrasting from the previous projection materials that only three members expect so. The sense of urgency for more rate hikes come as inflation has escalated to a near 40-year high level.
Persistent inflation
Ever since consumer prices set new highs in decades for two consecutive months, the Fed has changed its view that inflation is transitory. The central bank’s Chief is now acknowledging that inflation “may be more persistent” and is having an upward pressure on inflation expectations. It was also mentioned in the rate statement that supply and demand imbalances have led to “elevated levels of inflation”. Thus, the Fed has revised PCE inflation expectations upwards for 2022.
Moving forward, we can expect the Federal Reserve to wind up its QE during the first quarter of 2022 since good progress towards its dual mandate has been made – annual inflation has more than doubled the central bank’s target for several months and the rate towards maximum employment has been fast and is expected to continue in the near future.

Divergence spotted on Bitcoin! After Feds. Daily chart!Just after the feds meeting on tuesday dec 14, i anticipated a buy the news opportunity but decided to wait untill today( dec 15). I went to the BTC/ETH daily chart and tried to spot potential buying opportunities and to my greatest amaze for the first time in my short crypto trading life i had spotted a bullish divergence on the RSI oscillator on the daily chart. After realizing that the market is coming from a recent dip and a potential bull run next year january, i am considering buying the "dollar cost averaging" style and probably waiting till the end of the week to examine the full divergence set up on all possible time frames for more accurate confirmation. Hopes these helps?

Daily Crypto Market Update - All about the FOMC!In this video:
* We discuss Fed potentialities and future actions
* What will the Fed do to tackle debt?
* What will the Fed do to tackle inflation?
* How this will influence market sentiments?
* How the Fed will alleviate fears?
* How this spills over into the crypto space and influences sentiment here.

SHORTING EUR/USDSHORTING EU!
Brief Technical Analysis:
- Bearish Flag forming on the H8/Daily TF
- Nice impulse to the downside breaking past 1.13000
- Retest of the round psychological number 1.13000
- 61.8 Fib level lines up with previous stated confluences
- 3rd touch of trendline on H1 timeframe
Brief Fundamental Analysis on the currency pair:
- ECB aren't looking to change monetary policy anytime soon
- Energy crisis in Europe growing concern
- Concerns over new Covid strain 'Omicron'
- The FED are looking to increase their tapering pace, raise interest rates as soon as early 2022
- US Dollar seen as a safe 'haven' for investors (risk-off market = bullish for the Dollar and bearish for the Euro)

TOTAL CRYTOCURRENCY MARKET VIEWSThe TOTAL CRYPTO MARKET CAP is found on a pretty strong support, where we have $2.153T and $1.965T as Monthly supports, and $1.963T as weekly support. The recent dump took it all the way down to the Monthly and weekly support of $1.96T, where we got a bounce pretty quick. There is a possibility that we could slowly test the $1.96T again in the few next days. A Monthly close above the $2.153T is crucial so that the bullish momentum can continue into beginning of next year 2022. But if we close a weekly/monthly below $1.96T, we will probably see the bullish momentum being delayed for a couple more months. Bear in mind that the FED decision about tapering still has to come out in the next few days, and that also can impact the markets negatively for a while, but yet to be seen.
What I am seeing now, it is a accumulation phase for a few days/weeks between $2.4T and $1.9T, which can be a good opportunity to buy for the long term.
My sentiment: MONTHLY -> BULLISH . WEEKLY -> BULLISH . DAILY -> BEARISH
Red lines = Monthly Supp. Resist.
Blue lines = Weekly Supp. Resist.

$AAPL is nearing a climatic top, brings major risk to the marketAAPL stock is currently vertical, see way too many traders asking "should I sell my AAPL calls" or "its going to $200." - "its going to 3T market cap" reminds me of the last time it was around 2T mc and tanked. Funds buying large amounts of weekly calls always leads retail into a trap, they do this because in the interim they are planning to offload shares. Market makers are forced to hedge by buying up shares, when supply runs out and that option flow isnt there to support price through a gamma squeeze- the stock falls sharply. Retail is left holding the bag, the headlines/talking heads on cnbc sucker them in every time. Be patient, a big trade is coming. (Might be aligning with fed meeting on Wednesday.)

S&P 500 Daily Chart Analysis For December 11, 2021 Technical Analysis and Outlook
The Main Trend is currently reignited - with obsoletion of Key Res 4705; the Spooz is on its way to Outer Index Rally 4775 with the incentive of takeout all-time high 4744. The Mean Sup 4670 go-between buying opportunity.
The Bond Marekt Awaits Inflation DataBonds have continued their slow decline trough support at 130'07 and are hovering just above 130'00. We are starting to see support form in the middle of the vacuum zone between these two levels, confirmed by two green triangles forming on the KRI. Both Kovach momentum indicators have dropped precipitously, which might indicate that we are staring to become oversold and that 130'00 is a floor for now. If we see a relief rally, watch 130'07 or 130'19 for a target. If we continue to decline and break 130'00 then 129'26 is the next target. ZN is likely not to make any significant moves until CPI data comes out this morning.
