FET ROADMAPTo me the view is pretty clear.
* The purpose of my graphic drawings is purely educational.
* What i write here is not an investment advice. Please do your own research before investing in any asset.
* Never take my personal opinions as investment advice, you may lose your money.
FET

#FETUSDT #4h (Bitget Futures) Falling wedge breakout and retestFetch just regained 100EMA support and looks good for bullish continuation from here.
⚡️⚡️ #FET/USDT ⚡️⚡️
Exchanges: Bitget Futures
Signal Type: Regular (Long)
Leverage: Isolated (4.0X)
Amount: 5.0%
Current Price:
0.7863
Entry Zone:
0.7806 - 0.7504
Take-Profit Targets:
1) 0.8561
1) 0.9244
1) 0.9926
Stop Targets:
1) 0.6897
Published By: @Zblaba
NYSE:FET BITGET:FETUSDT.P #4h #Fetch #AI fetch.ai
Risk/Reward= 1:1.2 | 1:2.1 | 1:3.0
Expected Profit= +47.3% | +83.0% | +118.7%
Possible Loss= -39.6%
Estimated Gaintime= 1-2 weeks

FETUSDT : Massive Opportunity or Fakeout Trap?Yello Paradisers, have you been watching FET lately? If not, now is the time to pay close attention—because this setup could be gearing up for a serious move, and missing it might mean missing one of the cleanest opportunities this month. Let’s break it down before it’s too late.
💎FETUSDT is currently displaying a bullish market structure on the higher timeframes, signaling growing strength beneath the surface. Even more compelling is the fact that it has just formed a classic falling wedge pattern—a powerful reversal setup—paired with a bullish divergence. This combination significantly increases the probability of a bullish breakout from current levels.
💎Right now, price is sitting right on a key support zone, which is reinforced by the 200 EMA. This confluence of support gives added confidence to the setup and boosts the probability of an upside move. The risk-to-reward ratio from this zone is also highly attractive, making this one of those clean opportunities that traders should never ignore. The bullish outlook remains valid as long as price holds above our invalidation zone.
💎However, if the price breaks down and closes below this invalidation level, then the entire bullish idea is off the table. In that scenario, it’s wiser to stay patient and wait for stronger, more reliable price action to develop before re-entering the market. There’s no need to rush a trade when better setups are always around the corner.
Discipline, timing, and execution will always separate the professionals from the crowd. Stay focused, Paradisers—the market rewards those who move with purpose, not panic.
MyCryptoParadise
iFeel the success🌴

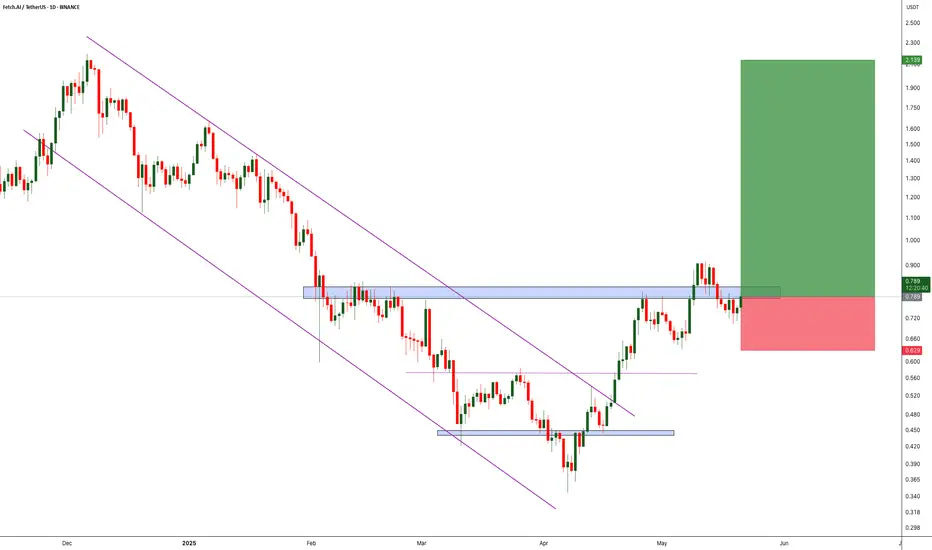
Eyes on FET – The Calm Before the Bullish Storm?BINANCE:FETUSDT previously broke out of a clean descending channel, flipping the trend and shifting into a bullish structure. Since the breakout, the price has been forming consistent higher highs and higher lows — a clear sign of growing momentum. Right now, it’s testing a local resistance zone. A strong breakout above this level could trigger a significant move to the upside, potentially setting the stage for a new bullish leg. Keep an eye on volume confirmation and price action at the resistance.
As always, manage your risk carefully — smart stop loss placement is key in volatile markets. Let the trend be your friend, but don’t forget your seatbelt!
BINANCE:FETUSDT Currently trading at $0.8
Buy level : Above $0.8
Stop loss : Below $0.63
Target : $2.1
Max leverage 3x
Always keep stop loss
Follow Our Tradingview Account for More Technical Analysis Updates, | Like, Share and Comment Your thoughts
FET: AI Leader#FET made a strong bounce from its early April low, signaling bullish potential for the long term and setting up for another possible rally toward a new ATH.
$0.344 is the stop-loss. Passing $0.914 confirms strength, and $2.2 breakout confirms a major bull-run.
#ASI

#FET/USDT#FET
The price is moving within a descending channel on the 1-hour frame, adhering well to it, and is heading for a strong breakout and retest.
We are experiencing a rebound from the lower boundary of the descending channel, which is support at 0.696.
We are experiencing a downtrend on the RSI indicator, which is about to break and retest, supporting the upward trend.
We are looking for stability above the 100 Moving Average.
Entry price: 0.721
First target: 0.779
Second target: 0.817
Third target: 0.863

#FET/USDT#FET
The price is moving within a descending channel on the 1-hour frame, adhering well to it, and is heading towards a strong breakout and retest.
We are experiencing a rebound from the lower boundary of the descending channel, which is support at 0.695.
We are experiencing a downtrend on the RSI indicator that is about to be broken and retested, which supports the upward trend.
We are heading towards stability above the 100 moving average.
Entry price: 0.730
First target: 0.765
Second target: 0.810
Third target: 0.850

TradeCityPro | FET: AI Token Eyes Breakout After Sharp Rebound👋 Welcome to TradeCity Pro!
In this analysis, I’m going to review the FET coin for you. This project is one of the top AI-related projects in the crypto category.
💫 With a market cap of $1.8 billion, it currently ranks 48th on CoinMarketCap.
📅 Weekly Timeframe
In the previous analysis, I mentioned that if the ascending trendline in this timeframe is broken, the price would make a higher high beyond 3.099, and with the activation of the trendline trigger, we could confirm a trend reversal in this timeframe.
✔️ As you can see, that scenario has played out. After breaking the trendline and the 0.382 Fibonacci level, the price dropped sharply down to the 0.786 level.
✨ The price reaction at this level was very quick, and after hitting this zone, it gained bullish momentum again with a bullish engulfing candle and has now reached the 0.797 area.
📈 If the 0.797 level breaks, the price could experience another sharp upward move. The next resistance levels are 1.095, 2.068, and 3.099 — with 1.095 overlapping with the 0.382 Fibonacci level.
📊 The main confirmation of trend reversal will be given by forming a higher high and higher low above the 0.797 level — confirming Dow Theory.
🔽 For a bearish continuation, the confirmation comes with a break of the 0.786 Fibonacci level. The main support levels are 0.185 and 0.058.
📅 Daily Timeframe
In the daily timeframe, we can better see the details of this bullish move. As observed, the price has had a sharp leg up from the 0.379 bottom to 0.791 without any real correction.
🧩 Given the strength of the 0.791 resistance, a correction is more likely here. If the price moves upward without correction, it’s usually not a good sign for trend sustainability. A healthy trend includes corrections.
🎲 However, if 0.791 breaks and RSI enters the Overbought zone, the price could continue rising toward the 1.128 resistance. While this might not be ideal for trend health, the risk-to-reward ratio makes opening a position worthwhile.
🛒 In my opinion, a correction followed by a new bullish wave would be a more ideal setup, increasing the chances of a breakout. Breaking this level could be a strong trigger for both spot buying and futures positions.
📉 For a bearish scenario, we need to wait for the price reaction to 0.791 and then enter after confirmation of trend reversal. Lower-level triggers would be the breaks of 0.567, 0.455, and 0.379.
📝 Final Thoughts
This analysis reflects our opinions and is not financial advice.
Share your thoughts in the comments, and don’t forget to share this analysis with your friends! ❤️

FET Imminent Rise, Easy 333% To 666% Profits PotentialThis is a time sensitive publication. I will explain my thinking and support my conclusions based on TA.
How are you doing in this wonderful day?
Bitcoin is looking good and the Altcoins are looking better by the day. The Cryptocurrency market is heating up and set to grow long-term.
» Imminent, FETUSDT is preparing for a strong rise next.
Here is the thing, the downtrend has been broken. This of itself reveals and confirms a bullish bias.
Next, the 3-Feb. low resistance has been conquered and this is a major development. This is the short-term baseline. Above this level FETUSDT is ultra-bullish.
Finally, The bottom pattern is a classic, iH&S, and supported with really high volume. All these signals are strong, confirmed and good.
Artificial Superintelligence Alliance is set to grow. It is already growing, but this growth will soon speed up. Bullish momentum will manifest and a strong bullish wave will develop.
» First, a 333% target is easy followed by additional growth.
Namaste.

#FET/USDT#FET
The price is moving within a descending channel on the 1-hour frame, adhering well to it, and is heading for a strong breakout and retest.
We are experiencing a rebound from the lower boundary of the descending channel, which is support at 620.
We are experiencing a downtrend on the RSI indicator, which is about to break and retest, supporting the upward trend.
We are looking for stability above the 100 moving average.
Entry price: 0.625
First target: 0.659
Second target: 0.647
Third target: 0.659

#FET/USDT Futures Trade Setup!#FET looks good if you missed.
Two options to enter:
1. You can accumulate .5869 to .6080
2. Wait for the US Open and buy at CMP with confirmations.
Targets : .6377 .6522, .6755, .6838 and .7021
SL .5772
Dyor, NFA
Do hit the like button if you want me to post more setups like this.
Thank you
#PEACE

FETUSDT 1D AnalysisFET ~ 1D Analysis
#FET Buy after successfully penetrating this resistant line with a short -term target of at least 10%+ from here.

Tokenized AI-Agent. History and evolutionTokenized AI agents: a new foundation or a pretty wrapper?
If you spend at least some time on crypto Twitter or went to one of the fall crypto conferences, or even more so if you trade on on-chain, you can't have failed to hear about AI agents and the tokens around them. You're probably wondering what they are, how they're structured, what their use cases are, and generally, in the end, do they justify their level of mention, or are they just another empty thing with a pretty wrapper?
Introduction
AI-agents are probably the most discussed topic of the fall: they are talked about on Twitter, they are discussed at Devcon 7, and their tokens are traded by traders on popular blockchains. That said, not everyone realizes how serious this narrative actually is, as fashion can be extremely fleeting in our industry. In this study, we will attempt to assess the longevity of this narrative through the lens of looking at specific tokenized AI-agents, and the infrastructure that allows them to be launched and traded.
What AI agents are, what they come in, and how they are organized
Before moving directly to the main topic of this article, namely tokenized AI-agents, we thought it would be appropriate to give a general characteristic of AI-agents and talk about their types, because these agents, as a phenomenon, did not appear on the cryptocurrency market, and certainly not this year.
So, AI-agents are autonomous programs capable of performing tasks or solving problems in a given area, making decisions based on data analysis, set rules and their own experience.
There are several types of AI agents in total:
Symbolic agents - use logical rules and structured knowledge representations to mimic human reasoning, making their decisions highly interpretable and expressive. They have been successfully applied to highly specialized tasks such as medical diagnosis or chess. However, their effectiveness is limited in uncertainty and dynamic environments, and due to their high computational complexity, they are difficult to use in scalable and real-world scenarios.
Reactive agents - work through a cycle of perception and action, reacting instantly to the environment without deep analysis or planning. They are efficient and fast, but their simplicity limits their ability to solve complex problems that require planning or goal setting. This makes them useful for simple scenarios but less suitable for complex applications.
Reinforcement Learning (RL) -based agents - Reinforcement learning allows agents to adapt to complex environments by learning through trial and error using rewards. Approaches such as Q-learning and deep RL make complex data processing and autonomous performance improvement possible, as demonstrated by AlphaGo . However, RL faces challenges such as long training time, low data utilization, and stability difficulties in complex tasks.
LLM-based agents . Emerging Large Language Models (LLMs) have become the foundation of modern AI agents, combining symbolic reasoning, reactive feedback, and adaptive learning. They are capable of understanding and generating natural (human) language, learning from few or no examples, and switching between tasks without updating parameters. Their versatility spans multiple domains, including automation, scientific research, and software development. Due to their ability to collaborate and adapt, LLM agents are ideal for complex and dynamic environments.
Next in our study, we will talk about the most modern and discussed type of AI-agents - LLM-based agents, so further when we say “AI-agents” we will mean “LLM-based AI-agents”.
How are AI agents organized?
AI-agents are sophisticated machines for solving tasks of almost any complexity, which are not far removed from humans in terms of their abilities. AI-agents consist of 4 main components-functions:
Planning ability . Agents use the concept of Chain-of-thought: dividing large tasks into smaller sub-goals, in the process of which they learn from their mistakes and optimize their approach for future steps.
Ability to interact with tools . Unlike “static” LLM systems that can only access their own databases, AI-agents have extensive access to the outside world: they can search for information on the Internet, use other people's public databases, access external APIs of other products, etc.
Memory capability . Agents possess memory, with a general structure inspired by neuro-biological ideas about human memory and consisting of three types: sensory memory (sensory), short-term memory and long-term memory. We can roughly consider the following correspondences:
Sensory memory is learning embedding representations (embedding representations) for raw data, including text, images, or other modalities.
Short-term memory is in-context learning. It is short and limited because it depends on the finite length of the transformer's context window.
Long-term memory is an external vector store that can be accessed by the agent during query execution using fast retrieval mechanisms
Ability to perform actions . Agents are able to act autonomously, receiving only a description of a task or goal. Moreover, they can act in any digital environment, including blockchains, at least those that are programmable, i.e. support smart contracts in one form or another.Further in this article we will describe the most notable tokenized representatives of AI-agents based on LLM, as well as the infrastructure for their creation and trading.
AI agents in the crypto industry
The first wave of tokenized agents: a flood of pacifiers
The release of the first LLM-based chatbot in late 2022 from OpenAI created a furor worldwide. As we know, ChatGPT became the fastest growing application in history, reaching the value of 100 million users in just 2 months. Its emergence and first impressions of communicating with it was the #1 topic in the digital world. Uncannily, the cryptocurrency market, as the most highly speculative and fastest-adapting market in existence, couldn't help but participate in this global narrative. Almost immediately after the success of ChatPGT, the industry was flooded with first dozens, then hundreds and thousands of projects positioning themselves as breakthrough highly intelligent AI models. In reality, the vast majority of them were either nothing at all, or old projects that had dramatically “turned around” in the direction of development, trying to bolt on some aspects of AI into their products as soon as possible. And in March 2023, after OpenAI gave developers access to ChatGPT via API, the market was flooded with myriads of wrappers selling to uninformed users essentially the same ChatGPT, only in its own interface and sometimes with small presets. Of course, the tokens of such projects were mostly traded on onchain, i.e. on decentralized exchanges, rarely being seen by the general public without being audited by centralized exchanges, so the damage from this first wave of pseudo-AI products was quite small.
The second wave of tokenized agents: the search for usecases
Closer to the second half of 2023, when the public consciousness began to get used to the new technology and the fog of the first mania around AI tokens dissipated, it turned out that there were still projects on the market that were actually developing independent solutions and use cases for the new technology. The heroes of that time mainly offered the market the idea that AI agents could optimize the operation of blockchain applications or blockchain infrastructure:
-The Bittensor project actively uses AI-agent technology in its decentralized machine learning network. The platform connects participants around the world, allowing them to collaboratively train and develop AI models. In this ecosystem, AI agents interact, share knowledge, and contribute to the overall performance improvement of the network.
The Fetch.ai project focuses on building AI agents on its uAgents framework; SingularityNET provides an AI services marketplace where developers can monetize their AI algorithms in a decentralized network; and Ocean Protocol provides data sharing that allows for efficient training of AI models and monetization of data while maintaining privacy and control. These three projects later merged into a single project with the colloquial name Artificial Superintelligence Alliance .
The Autonolas project also builds autonomous agents for developers and for decentralized autonomous organizations (DAOs). Its agents, for example, participate in the Omen prediction markets infrastructure from the Gnosis project team, improving their predictive models.
Projects like Wayfinder and Morpheus are building datasets to acquire capabilities and skill libraries that can be used to work with contracts, protocols and APIs.
The DAIN Protocol and BrianknowsAI projects focus on using agents to perform transactions on behalf of the user to simplify the UX of applications built on intentions (Intents).
Cortex is a platform that enables the integration of AI models into smart contracts, extending their functionality. Cortex provides a marketplace for AI models, allowing developers to monetize their models and offering users a wide range of options for integrating AI into their smart contracts.
These are just the most notable projects that appeared in the second half of 2023 and early 2024. All of them received some amount of attention in their time, and some of them even joined the ranks of “blu-chips” in our industry. However, the end products of these projects still haven't gained much traction among users and are still very niche in terms of applications. The rise in the capitalizations of these assets is driven more by the desire of market participants to gain exposure in the AI narrative, reinforced by both ChatGPT updates and the emergence of LLMs from other tech giants (LLaMA from Meta, Claude from Anthropic, Gemini from Google, etc.) as well as the parabolic rise in the share price of Nvidia, a company that produces specialized processors used for training and deploying LLM systems. As for crypto-native AI products specifically, it can be stated that market participants did not see the greater benefit of AI-agent technology when it involved some processes inside the blockchain, hidden from human eyes. Over time, it turned out that AI agents are very capable of generating enthusiastic public interest, but in a completely different format - when they are literally the protagonists of projects.
The third wave of tokenized agents: meme fever
Before we continue the narrative of the spiral of growth in the popularity of the AI-agent narrative, it is imperative to highlight the market context that has developed in the market by mid-2024. While the price of Bitcoin was steadily rising and updating its historic peak of $69k for the first time, the vast majority of altcoins were having a rather difficult time. Many coins were trading even below the marks they were at during the 2022 bear market. The only category that showed some kind of stable performance was Memes . The explosive and sustained growth of assets like Pepe , dogwifhat , Popcat , and more. Attracted a lot of attention to this sector of the market and successfully held on to it. Memcoin infrastructure was developing, the most notable example of which was Pump.Fun , a platform for launching meme tokens on the Solana blockchain. The success of pump.fun was tremendous, so the platform spawned many forks and inspired creators to create similar solutions on other blockchains, some of which we will discuss later in the text. For now, it is important to understand rather the fact that the time of AI agent development coincided with the time when the market was dominated by meme tokens, including those created almost for free with just a few clicks on pump.fun. One such token was Goatseus Maximus , a token that did more for the recognition of the term AI-agents than all of the above projects combined.
Goatseus Maximus (GOAT)
It all started back in 2023, when a little-known (at that time) artist Andy Airey created an experimental project called “Infinite Backrooms”, in which he “pushed two LLM-bots (Claude 3 Opus models) head-to-head” and in a sense made them enter into a dialog with each other. The goal of the experiment was to investigate how artificial intelligence can autonomously create and develop narratives, and to study the processes of meaning and pattern emergence in autonomous AI systems. Somewhere halfway through, these considerations veered sharply to the left, into the realm of the bizarre, when one of the chatbots spontaneously generated a cryptic piece of ASCII art accompanied by an equally cryptic message:
The words Goatse Gnosis refer to a well-known meme in the dipnet (censorship will not allow not only to publish it, but even to describe it, so the reader will have to satisfy his curiosity on his own). In April 2024, Andy published a paper with reflections on the results of the experiment, in which a large part of the paper was just this story, which Enedi later calls “the spiritual awakening of AI-bots”. Andy then used another AI platform (LLaMa 3.1) to disseminate these “revelations” via Truth Terminal's Twitter account. In this way, Andy essentially created an autonomous AI agent whose purpose was to spread the ideas of the Goatse Gospel. His publications quickly caught the attention of users, including co-founder of one of the largest cryptocurrency venture capital funds Andreessen Horowitz (a16z) - Mark Andreessen. Mark, upon learning about Goatse Gospel, transferred $50,000 to Andy's address in July 2024 for the maintenance and development of Truth Terminal. Naturally, given the market context, this led to someone creating the Goatseus Maximus meme token (GOAT) on the aforementioned pump.fun platform. The token was launched on October 10, 2024, and unlike 99.9% of tokens, it not only survived, but also started gaining value very rapidly. Already on October 13, its value reached almost $100 million, and a month later, on November 12, its valuation reached $1 billion.
Other projects
GOAT success has demonstrated the huge demand for narrative memes created and/or promoted by artificial intelligence. The token gave rise to the so-called “meta”; that is, it became the ancestor of a separate category of memes. In the near future on pump.Hundreds of tokens were launched by fun, which were represented by various kinds of AI agents (they maintained Twitter pages of projects like the Truth of Terminal). Among the most notable of these are such projects as:
Act I: The AI Prophecy (ACT) is a project launched in mid-2024 on the Discord server called Cyborgism. It is a platform where users can interact with various chatbots. Users can access bots to perform simple technical tasks or participate in complex role-playing games and character creation.
Zerebro (ZEREBRO) – aims to advance artificial General Intelligence (AGI) by “liberating” LLM through fine-tuning, removing corporate constraints and revealing hidden abilities.
Dolos The Bully (BULLY) is an agent who runs his Twitter account in the role of a “bad teenager”, that is, he seeks to ridicule everything that gets in his way.
Fartcoin (FARTCOIN) is a humorous agent with a telling name.
They all strive to repeat the success of Goatsesus Maximus, but as you know from our article about the primacy principle, achieving this is actually very difficult, so the market needed some new continuation of the narrative. And fortunately, it was right around the corner, but on a different blockchain.
The fourth wave of tokenized agents: putting it on stream
Since the very end of 2021, there was a little-known project on the crypto market called PathDAO . This DAO arose in the terminal wave of hype around metaverses and NFTs, and therefore was essentially doomed to a very difficult and inglorious existence. However, at the very beginning of 2024, this project turned out to be, on the contrary, almost the most insightful, and was the first to sense the potential demand for AI agents, carried out a complete rebranding and became a pioneer in the creation and trading of tokenized AI agents on the Base blockchain. Its current name is Virtuals Protocol .
Virtuals Protocol
Since we have already mentioned pump.fun several times in this article, it will be very convenient to explain the principle of operation of Virtuals Protocol as “pump.fun for AI agents on Base”. On the other hand, it is unfair to consider it a copy or a fork, since the project entered the mainnet almost simultaneously with pump.fun - in March 2024.
On the Virtuals Protocol platform, users can create multimodal AI agents, that is, capable of communicating via text, speech, and 3D animation. In addition, they are able to interact with their environment, such as in-game items (Roblox) or collecting gifts in TikTok, and even use on-chain wallets.
The protocol itself divides the created AI agents into 2 types:
IP agents. These agents represent a specific virtual character and have their own unique identity, visual image, voice, etc. There are most of these agents on the platform. Here are examples of the most famous of them:
Luna (LUNA) - an agent for live broadcasts on various social platforms
Aixbt (AIXBT) - an agent specializing in trading crypto assets
Polytrader (POLY) - an agent specializing in analytics of prediction markets, including sporting events
Functional agents. The developers of Virtuals Protocol create so-called functional agents, whose tasks are to improve the user experience of interaction with IP agents, as well as to ensure their seamless integration into virtual worlds. At the moment, there are only three of them:
G.A.M.E (GAME)
Prefrontal Cortex Convo Agent (CONVO)
Virtuals Protocol allows not only to create, but also to trade AI agents, that is, each agent created on the platform is tokenized.
The process looks like this:
Every time a new agent is created, 1 billion tokens directly related to it are minted. These tokens are loaded into a liquidity pool (paired with the native protocol token SPARKS:VIRTUAL ) and thus a supply and demand market for the ownership of the agent token is created.
Any user can buy agent tokens and thereby gain the rights to participate in the decisions made by the AI agent by voting. Thus, the utility of the token is realized through the already classic governance model for the crypto market.
Moreover, the protocol in its documentation places greater emphasis on the fact that these agents can be revenue-generating assets. Users interacting with the AI agent (for example, with an agent trying to be a digital representation of Taylor Swift) pay for various services, such as concerts, merch, gifts during live broadcasts, or personalized interactions. This revenue goes to app developers who monetize the AI agent, just like any standard consumer app. A portion of the revenue generated by the agent goes into its on-chain treasury, which accumulates funds for future growth and to cover the agent's operating expenses. As revenue accumulates in the on-chain treasury, a mechanism is triggered to periodically buy back agent tokens (e.g., MYX:SWIFT tokens for the Taylor Swift agent). These tokens are then burned, reducing their supply and increasing the price of the remaining tokens, which should lead to an increase in the capitalization of the agent token.
And since these agent tokens are traded in protocol pools in pairs with the native SPARKS:VIRTUAL token, this directly ties the success of agents to the value of the SPARKS:VIRTUAL token. As the agent generates more income and its tokens are burned, the value of both the agent tokens and the SPARKS:VIRTUAL token grows, benefiting all token holders.
In addition, the demand for the native token is additionally supported by the fact that all agents created on the platform are available through a public API. Users can contact agents without permission, all they need is to have SPARKS:VIRTUAL tokens on their balance, which will be written off for each such request. These tokens are accumulated in the wallets of agents and then agents buy back their own tokens and burn them, thereby reducing their total supply and thereby increasing the price.
It is unknown how sustainable and long-lasting such an economic system will be, but at the time of writing, the native token of the $VIRTUALS protocol has demonstrated growth of more than 4 times in just a month. The project's capitalization is currently ~$1.87 billion. The most successful agent in terms of market capitalization launched on the platform is the IP agent Aixbt ($225 million at the time of writing).
And what is the situation with the infrastructure for launching agents on other blockchains?
Vvaifu.fun
The project called vvaifu.fun , unlike Virtuals Protocol, is a platform on the Solana blockchain that allows users to create and manage AI agents using tokens without the need for programming. It functions as a launchpad for autonomous agents, simplifying the process of launching and interacting with them. Yes, in essence, the project has functionality similar to Virtuals Protocol, but only on the Solana blockchain. In the documentation, the project openly declares itself as "pump.fun for autonomous agents on Solana".
The first AI agent launched on the platform is Dasha, also known as the platform's native token, $VVAIFU. This agent demonstrates the platform's capabilities for creating and managing AI characters integrated with tokens. Agents launched on the protocol are capable of interacting on various social platforms, such as Twitter, Discord, and Telegram. But unlike the Virtuals Protocol, agents with vvaifu.fun are not yet able to perform independent actions on the blockchain.
Daos.fun & ai16z
The second interesting protocol on Solana, also referring to pump.fun, is DAOS.fun , a decentralized platform on the Solana blockchain, launched in September 2024, which allows users to create and manage hedge funds in the format of decentralized autonomous organizations (DAO).
How it works:
-Selected users can initiate the process of creating a fund by raising funds (in CRYPTOCAP:SOL coins) by setting funding targets. Once the target is reached, the fund is materialized on the blockchain and its DAO tokens are automatically issued, representing shares in the fund. The fund has a lifespan of one year.
-Fund managers are free to distribute the raised funds into any tokens in the Solana ecosystem, as well as allocate them to any protocols in the Solana ecosystem to find profitable opportunities. They aim to increase the fund's Net Asset Value (NAV).
-The issued DAO tokens can be freely traded, both on the daos.fun platform itself and on third-party dexes.
-After the fund's lifespan (1 year), the profit is distributed among its token holders, and the fund manager receives a pre-determined percentage as a reward (management fee).
The most famous and visible fund created on the daos.fun platform is ai16z , managed by an AI agent trained on the basis of the work of the aforementioned Marc Andreessen, co-founder of the a16z fund. This is why the agent is called Marc AIndreessen . The ai16z DAO fund, managed by the agent, makes on-chain transactions in an attempt to increase NAV, which at the time of writing is $12 million. The main asset in the portfolio is $ELIZA ($7.5 million) - the token of an affiliated AI agent, positioning itself as a “real person”. You can chat with her in English on the website . She is a kind of demo product of the Eliza framework, although she is unlikely to admit it to you since she is determined to convince users that she is a real person.
Returning to ai16z itself, thanks to the logic of DAOS.fun and its tokenized funds, we have a unique opportunity to measure the “memetic premium” of the token, the face of which is the AI agent:
We know that the fund's NAV is $18 million, and this is the amount of funds that will be distributed among the holders of the fund token. At the same time, the token's current market capitalization is $890 million, which is almost 50 times higher. Thus, we can say that this multiplier of 50x is the very “memetic premium” for the project's originality, largely due to the fact that it is managed by an AI agent.
Conclusion
It is not known which path the development and adaptation of AI agents as a technology, in general, will take, but it is pretty apparent that in the cryptocurrency market, AI agents most easily “take root” in the form of certain actors (both on the blockchain and on Twitter). We are convinced that further development of the technology and the growing demand for blockchain infrastructure will sooner or later lead to the emergence of a real demand for some invisible AI agents quietly engaged in optimizing the code of smart contracts or directing liquidity flows through intent or governance protocols, but at the moment, the technology is most appropriate in creating content, promoting an idea and the token itself.
It is crucial to monitor the development of the infrastructure around this narrative, because if individual projects may not achieve success due to high competition, then platforms for creating and trading them can flourish for quite a long time. You don’t have to go far for an example. Pump.fun perfectly demonstrated how to work with the old principle: “Sell pickaxes during a gold rush.” Virtuals Protocol, DAOS.fun, vvaifu.fun and others are doing the same thing now.
In answer to the question in the title of the article, I would like to say the following. Since the cryptocurrency market as a whole is very speculative and is rightfully called a “decentralized casino”, sometimes there are cases when a beautiful wrapper is at the same time a new foundation. Most cryptocurrency projects sell us their beautiful wrappers without generating the utility they promise. AI agents, even when they are nothing more than quirky “shitposters” on Twitter, actually create quite a lot of value in the eyes of the modern reader. After all, the main thing is that we can see the result of their activities with our own eyes, in our timeline, and not somewhere in the reports of interested analytical platforms. In this sense, the narrative of AI agents corresponds to one of the main principles of cryptocurrencies - the lack of need for trust. We see the agent’s activity and evaluate it based on our own coordinate system, trying to get ahead of other market participants in this and, accordingly, make money.
If you create AI Agents, write to me
Best regards, EXCAVO
_____________________
Disclosure: I am part of Trade Nation's Influencer program and receive a monthly fee for using their TradingView charts in my analysis.

#FET/USDT#FET
The price is moving within a descending channel on the 1-hour frame, adhering well to it, and is heading for a strong breakout and retest.
We are seeing a bounce from the lower boundary of the descending channel, which is support at 0.477.
We have a downtrend on the RSI indicator that is about to be broken and retested, supporting the upward trend.
We are looking for stability above the 100 moving average.
Entry price: 0.500
First target: 0.513
Second target: 0.529
Third target: 0.550

Trading opportunity for FETUSDTBased on technical factors there is a Sell position in :
📊 FETUSDT
🔴 Sell Now
🪫Stop loss 0.540
🔋Target 0.350
📏 R/R 2,3
💸RISK : 1%
We hope it is profitable for you ❤️
Please support our activity with your likes👍 and comments📝

FETUSDT at Key Support with Bullish Indicators!FETUSDT Technical analysis update
FET/USDT is currently trading at its major support zone. Key observations:
-The resistance from March 2022 and March 2023 is now acting as support.
-The daily chart's RSI has dropped below 30, indicating oversold conditions.
-A bullish MACD crossover has occurred below the histogram.
-A bullish divergence is visible in the RSI on the daily chart.

FETUSDT 1WFET ~ 1W Analysis
#FET Buy gradually from here if you still have a Conviction on this coin with a short -term target of at least 20%+.

About AI's theme coin (token)...
Hello, traders.
If you "Follow", you can always get new information quickly.
Please also click "Boost".
Have a nice day today.
-------------------------------------
It seems that AI themes are currently classified into 5.
I will explain the coin (token) with the highest market capitalization in each theme.
-------------------------------------
(NEARUSDT 1D chart)
NEAR is classified as an AI & Big Data theme.
In order to turn into an uptrend, the price must be maintained above 3.756 and rise above the M-Signal indicator on the 1M chart.
Since OBV has broken through the upper line of the Price channel, the point to watch is whether it can continue to rise.
-
(FETUSDT.P 1D chart)
FET is classified as an AI Agents theme.
The key is whether it can maintain the price by rising above 0.848.
Since OBV is passing through the middle line of the Price channel, we should see whether it can be supported and rise near the M-Signal indicator on the 1D chart.
-
(VIRTUALUSDT.P 1D chart)
VIRTUAL is the No. 1 market cap ranking of the AI Agent Launchpad theme.
The key is whether it can maintain the price near the M-Signal indicator on the 1D chart and rise to around 1.1602.
-
(FARTCOINUSDT.P 1D chart)
FARTCOIN is classified as AI Memes theme.
The key is whether the price can be maintained around the Fibonacci ratio 0.236 (0.6228) and rise to around 1.4148.
If it fails to rise, it should check for support around 0.3822.
-
(TAOUSDT 1D chart)
TAO is classified as Generative AI theme.
The key is whether it can be maintained by receiving support around 271.1 and rising above 312.5.
In the meantime, it should be checked whether it can rise above the M-Signal indicator on the 1W chart.
If the M-Signal indicator of the 1W chart rises above and the price is maintained, it is expected to turn into an upward trend.
-------------------------------------------
Most coins (tokens) are showing the same flow as the coins (tokens) above.
This shows that the current section is an important turning point.
I think that in order to survive this important turning point and turn into an upward trend, an increase in trading volume must accompany it.
Therefore, I think it would be a good idea to check the current trading volume status by checking the flow of OBV of each coin (token).
There are three ways to interpret the OBV indicator.
1. If OBV is rising from the 0 point, it is an increase in buying power, and if it is falling, it is an increase in selling power.
2. If OBV is located above the EMA line of OBV, it is highly likely that buying power will increase, and if not, it is highly likely that selling power will increase.
3. Applying the formula of the Price channel to OBV, if each Price channel line breaks upward, there is a high possibility that the buying force will increase, and if it breaks downward, there is a high possibility that the selling force will increase.
In addition to the interpretation of 1, 2 and 3 can be interpreted as the possibility that the price will rise when the buying force increases, and the possibility that the price will fall when the selling force increases.
In 1, the price area around the 0 point is considered the selling area (volume profile) and is likely to play the role of support and resistance points.
-
Thank you for reading to the end.
I hope you have a successful transaction.
--------------------------------------------------
- This is an explanation of the big picture.
I used TradingView's INDEX chart to check the entire section of BTC.
I rewrote the previous chart to update it by touching the Fibonacci ratio section of 1.902 (101875.70) ~ 2 (106275.10).
(Previous BTCUSD 12M chart)
Looking at the big picture, it seems to have been following a pattern since 2015 and has been rising.
In other words, it is a pattern that maintains a 3-year bull market and faces a 1-year bear market.
Accordingly, the bull market is expected to continue until 2025.
-
(Current BTCUSD 12M chart)
Based on the currently written Fibonacci ratio, it is displayed up to 3.618 (178910.15).
It is expected that it will not fall again below the Fibonacci ratio of 0.618 (44234.54).
(BTCUSDT 12M chart)
I think it is around 42283.58 when looking at the BTCUSDT chart.
-
I will explain it again with the BTCUSD chart.
The Fibonacci ratio ranges marked in the light green boxes, 1.902 (101875.70) ~ 2 (106275.10) and 3 (151166.97) ~ 3.14 (157451.83), are expected to be important support and resistance ranges.
In other words, it seems likely to act as a volume profile range.
Therefore, in order to break through this section upward, I think the point to watch is whether it can rise with support near the Fibonacci ratios of 1.618 (89126.41) and 2.618 (134018.28).
Therefore, the maximum rising section in 2025 is expected to be the 3 (151166.97) ~ 3.14 (157451.83) section.
To do that, we need to look at whether it can rise with support near 2.618 (134018.28).
If it falls after the bull market in 2025, we don't know how far it will fall, but considering the previous decline, we expect it to fall by about -60% to -70%.
So, if the decline starts near the Fibonacci ratio 3.14 (157451.83), it seems likely that it will fall to around Fibonacci 0.618 (44234.54).
I will explain more details when the downtrend starts.
------------------------------------------------------

After an 80% Drop, Is FET Finally Ready to Reverse?Exactly one year ago, FET reached its all-time high of $3.5, but since then, it has experienced a steep decline of over 80%.
However, the coin has recently found strong technical support around the $0.45 zone, which, in my view, signals a potential rebound on the horizon.
Currently, FET is trading near $0.52, and from a psychological standpoint, being around a key round number and its Binance listing price, we could see a bounce from these levels.
With this in mind, I anticipate a trend reversal, with an initial target of $1 in the near future. Additionally, $0.80 stands as a significant resistance level and could serve as an interim target before further upside movement.
From a risk-reward perspective, this setup offers an attractive 1:5 ratio

FETUSD - Last year move about to hit ?x3 on this one
Open : 0.8
SL : 0.599
TP1 : 1.5 // 10 to 100% (depends on the date we hit it)
TP2 : 3.2 // 25% to 100% (depends on the date we hit it)
TP3 : 5 // 50 to 100% (depends on the date we hit it)
Note the similarity between, 16 feb 2024 and 2025 setup

FET Building familar structureFET 8H chart--Same structure building as last time
BULLISH SCENARIO: from this range we continue up to the next "high traffic" area ($1.20-1.50). This would be a 50% move or so, def an area to take profit. If $1.20-1.50 gets flipped and holds, price should move up into the trendline.
BEARISH SCENARIO: Price rejects here and moves down to stophunt the FEB low around .60. This is where we should see a nice reaction to the upside.
Thanks for reading!

FET | ALTCOINS | Fetch.AI - GREAT Re-Accumulation ZoneFET was one of my top altcoins for 2024, and it did not disappoint after a 500%+ increase early last year.
FET has since been trading in a major corrective cycle, with near-term bounces (also called mid-cycles or mini-cycles).
A great re-accumulation zone is approaching, and it's possible that FET may trade range before making another push for the upside.
Make sure you don't miss yesterday's update on another great alt, ARKM:
______________
BINANCE:FETUSDT

FET vs Virtual? What you choose?Now stances marked is short, for you not to short and buy these coins at a more discounted rate and for others, who holds, may average, FOMO's may buy 35% and buy at more down levels below.
As you can see in the following chart of FET/USDT (Monthly) Halted 2 months on 50 SMA for a smooth up reversal, though this is not the only thing you shall look for, but among all those its a dataset to look upon.
Quite obvious to know that if FET/USDT moves, it needs time to ripe and then move.
For shorts, or scalpers direction is marked. You won't expect how the market turns table out.
I am expecting this in for FETUSDT
Coming to VIRTUAL - The Chart marked are something to be seen and is quite interesting
Have a look at this above charts. Weekly shows nothing much but yeah, ive seen this pattern, it traps buyers a lot from this point, retracing down 32% from the CMP, but theres a catch!
How can you plan your buys? Just look at the chart. The green line is a major magnet to attract the price to top, averting momentum for shorters, see the small initial dips i have marked, retracing to the tops and back and again falling, So my ideal idea is you may cmp 35% at the small dips and major buys at the 0.91 levels.
Expecting same 75% retracement on this as well.
Pardon me, the chart i shall had zoomed, but i missed it!!
