Flex Your Muscles FET/BTC #FET $FET #FetchAIWow ! Look at that huge candle up on $FET ! I had predicted 1920 as a target area before and we hit that target last night ! As you can see we are now inside that light purple line of our colorful Gann Fan indicator . Below us the bottom of that line ( 3/1 on the Gann) is basically at 1550 sats which was our previous resistance . In other words we may have just flipped our resistance into a support ! I suspect that is the case but it's always possible to retrace below there at some point but for now all looks good . Above us the top of that line ( 2/1 on the Gann ) is around 2150 - we may hit there and then cool off a bit but notice that target symbol on my chart ? That's also showing you the 1.618 fib which is at 2398 . So we may see that target soon as well , Above that you see a green checkmark which is also near our strong weekly resistance area near 3200 - and that won't be easy to break through . I suspect we get there by Halloween but may retrace hard before we break up from there ( no doubt Bitcoin will be going for higher highs too ! ) Anyway I still think FET is playing within a Gann Fan and will see 5400 sats in December . Right now FET is flexing it's muscles !
FET

FETBTC Sağlam bir direnç bölgesi aşıldı.Haftalık mumu 0.00001550 üzerinde kapatırsa 0.00002725 ilk satış yerim olur.

FETBTC, the end of the accumulation?On the higher timeframes, Fetch has never been in an uptrend, declined until end of 2019 and experienced a big big flat consolidation since 2020.
--> Maybe an accumulation by whales?
Price has made a Higher Low, we need to see a Higher High now. Easy entry, easy to adjust risk.
Want to see more charts like this one? Join us at Subverto Trading Club !

Fetch.ai (FET) 5% Gain to ATH, Expect $1 FET Soon!Fetch.ai (FET) 5% Gain to ATH, Expect $1 FET Soon!
Fetch AI (FET) has been in a very strong bullish continuation pattern since the Fast and Slow moving average crossover. We can expect a NEW ATH at the 127.20% Fib level @ $1.10. Fetch has been in a bullish continuation pattern since 24/07/21 when the 13 EMA crossed up the 50 SMA signalling a strong Buy signal on the swing call script. Fetch broke above the 38.20% fibs with a 115% gain from the buy signal from our script from the 24th July to 11 August. From this bullish momentum from the 24th July, FET has shown little to no selling pressure retracing on every bullish move up down to the 78.60% Fibonacci level showing us weak retracements as traders take profit, but we are still in a very bullish sentiment and the Bulls are very much still in control.Happy Trading $FET #LongFet
Key Notes on Fetch AI:
Fetch.AI (FET) is a combination of Blockchain and artificial intelligence (AI), an ambitious project aimed at creating a fully automated economy based on autonomous “authorized agents.” Artificial intelligence and online agents will be used to perform various tasks that can simply be done by booking a hotel. Or more complex tasks such as weather modelling or supply chain design effectively.
Benefits:
Through its 3-layer structure, Fetch.ai proved superior to other protocols with the following advantages:
The elements (people, hardware, services, …) inside Fetch.ai can operate separately and in parallel with each other but can be quickly connected.
Fetch.ai simplifies the deployment of algorithms, IoT and complex systems. By using the AI / ML architecture, it allows software devices and agents to find each other, learn from each other and exchange value with each other, enhance and optimize solutions for Daily problems through intelligent connectivity, ML and AI.
Applicable in many fields, from transportation to tourism , even heavy industries (like steelmaking) can use the Fetch.ai protocol to improve performance and productivity.
As a platform that combines technologies that are considered to be the “future”: blockchain, Machine Learning (ML), artificial intelligence (AI).

fetbtc 5X potansialThe fet appears to have climbed above the channel line and performed the re-test. Mainnet and Airdrop operations will take place in September A solid project and 5X potential available
is not investment advice.

resistances in the way of $3crab harmonic pattern:
AB=0.61 XA
BC=0.38 AB
tp1=2.6 BC=$3
tp2=3.6 BC=$17
tp3=1.6 XA=$36
resistances in the way of $3
R1=$0.722
R2=$1.1
R3=$1.77
R4=$2.5

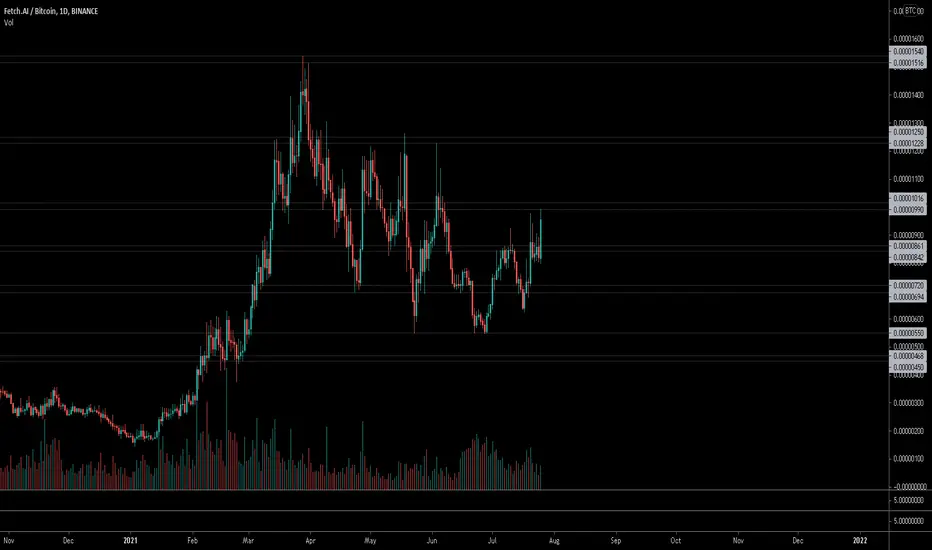
$FET 1st try above ~1250sats since April$FET
1st try above ~1250sats since April
Volume not that strong tho so looking for it to hodl/flip current level as a stronger signal of confirmation
If happens, then it may go back to 2020/21 highs
~50% since entry on UCTS 2D Buy signal back in July
patience
#FET

FET - Target 90% + Profit (4H)FET - Target 90% + Profit (4H) - Buy now and waiting plz
FET - Target 90% + Profit (4H) - Buy now and waiting plz

FETUSDFETUSD W, this is how could play in the long run in my personal opinion
This is not a financial advice. Thanks for watching

FET/BTC Buy opportunityHi followers,
FETBTC is breaking out of an important downtrend line, with higher lows which suggests a new and fresh uptrend.
Don't forget to manage your risk! 👌
Good luck and trade with care 🙏
If you like my content - 👍 Like, 💬 comment, 👆 follow and 👉 share!
❗❗❗
Disclaimer: This information is not a recommendation to BUY or SELL. It is to be used for educational purposes only!

FET ready to fly. Waiting on a breakout and hold above 1550I am mega bullish on Fetch.ai, Only a matter of time before this moons. Great project, great fundamentals, great team. Watch for a breakout of the 1550 area to prepare for an absolute rocket shot towards its all time high on the BTC pair. Will update this as it happens. Run seems to be starting now after accumulation over the past week. Should be a pretty easy trade to capitalize.
- 60k Defi Agent users announced today
- New Defi Agent update incoming
- Elon Musk AI Conference today
- much more...

Adam & Eve Bottom on FET/BTC #Fet $FET #FetchAIYou can see we have developed what appears to be an Adam & Eve Bottom on our FET chart . What's an Adam & Eve Bottom you might ask? Let's look at our 12 hour chart and see! Our first bottom happened about a month ago with that sharp V formation you see with the red V . Many of us thought it was gonna be an Inverse Head & Shoulders pattern but Crypto can change quickly ! Not all patterns play out . But you can clearly see we've made another more rounded Bottom now at the same sat range . This is the Eve Bottom you see on the chart with the curved blue line under it. This is a Bullish pattern and I expect upside here. There is a Neckline area you can see on the chart in the 1200 area and this is an obvious target ( though there will be steps along the way ) , and will also take us up through the Ichimoku cloud ( and that's Bullish too . ) So an Adam & Eve Bottom will be a pattern involving a first V shaped bottom followed ( probably a month later ) by a more rounded bottom in the very near same price area but with a neckline rise in-between . The distance from the neckline to the bottom is how much you add on top of the neckline to get a target . And again we see a probable target area in the 1900 sat area . I would love to see that happen . Maybe by end of July we see this beautiful upward rise ! Let's see . Wishing all the best to the FET Community !

fet/btc looks goodThe Fet/BTC Chart is about to light a green candle in memory, and the macd looks like it's going to move upwards. If the green breaks the falling trend, the expected big move may come.

FET DAILY CHART - POINTS TO WATCH AT!FET DAILY CHART
All prices and areas you should watch at FET!
Updates will follow!

Golden Cross & Kumo Twist FET/BTC #FET $FET #FetchAIHere we see our FET daily chart with that beautiful pump from yesterday . The neckline ( in red ) of our Adam & Eve Bottom has been hit and once we can consolidate for further upside we should hit that 1900 area which was the target of the Adam & Eve bottom. But also notice there are some other bullish indicators right now on this chart . We have a small Golden Cross happening with our light blue 50 MA line crossing up through our dark blue 200 MA line - and that should happen later today.And we had a Kumo twist on our Ichimoku cloud which has now gone from red to green. Everything is looking great with this chart ! I'll do an updated Gann Fan chart for FET very soon . Because FET has really been respecting it !
My Adam & Eve bottoms idea is linked below . Thank you !

FET +50%FET will most likely be retracing some time soon and then after some more accumulation will be going on another parabolic run...
I will have buy orders around ~0.29
Not financial advice

FETUSDT see and watch :)
After breaking the trend line, we will probably see good growth up to the specified range ...


FET BTC 1-D$fet / $btc
bought this EMA 100 retest zone at 850 sats
more bids to come if it comes down to 785 sats as well


🔥 FET Long-Term Opportunity: Bullish ChannelSince the corona sell-off over a year ago, FET has been trading inside a bullish channel, bouncing off either trend line over 2 times now.
With BTC's regained confidence and bullishness, it might be time to consider entering long-term trades again.
One of the tokens on my list is FET, because of the aforementioned reasons. At the moment, I'm eyeballing the green entry area for a potential buy into the market and keeping it till at least the end of the year.
On the other hand, if a bullish break out from BTC occurs, FET will naturally follow. A daily close above 0.43 would be a nice start to start looking for entries since we can assume that we're going to see a new bullish move soon.
Long-term target would be $2. Might be a stretch, but if we get another move like we've seen earlier this year it's definetely possible.
Happy trading!

$FET, Signals on this chart/timeframe are usually quite strong..$FET
Signals on this chart/timeframe are usually quite strong..
11% since latest 2D Buy already and facing 1st important level at ~1k sats
Looking for a breakout/flip above this area as continuation
#FET
FET retest on the 4hr, finally broke trend line placed since MayAs long as BTC keeps bussin ,FET along with almost every other alt coin will blow as well. But Fet lookin good right now, but so does every other alt right now to be honest. But Fet making perfect text book TA, finally broke trend and retested (though only on the 4hr). We shall wait and see but fet seems like a long term hodl to keep in a ledger in my opinion. Buy and never look back.
