#FET #FETCH Possible targets for 2021#FET #FETCH Possible targets for 2021
TARGET1: 0.50 $
TARGET2: 0.90 $
TARGET3: 3 $
TARGET4: 5.9 $
FET

April Jewels -3 Day Golden Cross in Apil ? FET/BTC #FetchAi $FETHere we see our FET 3 day chart on Binance . You can see our light blue 50 MA is looking to turn up into our dark blue 200 MA and that could mean a Golden Cross happening here on our 3 day chart as it just recently already happened on our 1 day chart ! In case you didn't know - a Golden Cross is extremely Bullish especially on higher timeframes like 1 day , 3 day , and 1 week charts . And a Golden Cross is when our 50 week moving average crosses up and through our 200 week moving average - which looks like it will happen on our chart sometime i n April where you see the rocket on my chart . This looks great already but add in the fact that FET is having a Mainnet at the end of March and you have an extremely great scenario for all of us who are trading or holding FET . I personally would like to see Fet approaching 5800 - 6000 sats in Summer but we almost certainly will go over 1000 sats soon and a target still seems to be that blue line on my chart near 1550 - which was our high from summer 2020 . Looks great and Good Luck !

Struggling but it looks goodOnce 0.44 is broken, were probably gonna pump big.
Look for ATH by Mar 15.
STONG BUY if 0.44 close on the 4h


FET/USD long limit entryBreakout retest
Long limit entry 0,322
SL 0,27
PT 4,49
BE 0,39
RRR 2,5:1
BINANCE:FETUSDT


Lovely Day FET/BTC #FetchAi $FET #FETHere we see our FET Btc 3 day chart from Binance . As you see we surged to 800 sats last night and we are now inside the 3 day Ichimoku cloud and that means we should almost certainly go to the top of this cloud near 875 sats where you see that pink arrow pointing . At that point I would expect to see a bit of consolidation before more rise - probably going up to revisit our high from last summer of 1550 sats - you can see that where the blue line is on my chart above us. Where this gets interesting is that when we get to the top of the 3 day chart near 875 that will have us wicking slightly into the weekly cloud ( the bottom of which is near 860 sats ! ) And it will be a truly lovely day when we enter that weekly cloud . Anyway FET looks great for the first half of 2021 and also has a Mainnet coming at the end of March .


$FETUSD - Diamond and Head and ShouldersHello everyone!
Another diamond pattern spotted here. This time for fetusd.
Short here or wait for a breakout from the dynamic support (pink).

High Hopes = FET Targets FET/BTC #FetchAi $FET #FETHere we see our FET BTC 3 day chart which shows our fib retracement levels . Fibs are generally good targets for upside on a bullish chart - and look to be our long-term targets for FET on Binance. You see that pink check mark on my chart ? That's a previous high near 1550 sats from last summer and looks like a good near-term target maybe sometime after the Mainnet of FET launches in March ( end of March,that is.) There can always be a pause and consolidation after that but the targets above us after that appear to be
3420 (there's strong resistance near here )
5443 - that's our .382 fib
7077 - that's our .5 fib
8712 - that's our .618 fib
9931 - that's our .706 fib
and there's still strong confluence near 5800 on the Kucoin chart. So hope you like my chart, thank you .

Hold The LIne FET/BTC #FetchAi $FET #FetHere we see our daily FET BTC chart from Binance . You see that pink arrow on my chart ? It's pointing at the dark blue 200 MA line .That's the 200 week moving average . It's a strong long-term indicator and you can see we are sitting on top of it . None of our candlesticks has closed below it . So we are still bullish in my opinion . I don't think we will break below that dark blue line , I believe FET will see a Golden Cross very soon ( a Golden Cross is when that light blue line which is the 50 MA will cross up and through that dark blue 200 MA . It'll break through . ) That will be a massive upside for us . FET looks fantastic so don't be worried by short-term pullbacks or a bit of ups and downs ,because in a volatile Bullmarket that's normal . Have a great day . Golden Cross idea linked below . Thank you .

FET Fetch.AI Expected Move - FETBTC FETUSD FETBUSD FETUSDT FETCHFET Fetch.AI Expected Move - FETBTC FETUSD FETBUSD FETUSDT FETCH


Legend of The Golden Cross FET/BTC #Fetchai $FET #fetHere we see our FET daily chart from Binance . You'll notice we are about to have a very Bullish event on this chart ! The Golden Cross . What is a Golden Cross ? Well,that's when our light blue 50MA ( or 50 week moving average ) is going to cross up and go through our dark blue 200 MA ( or 200 week moving average. ) These are long-term moving averages and are fairly good indicators of bullish upside coming when they cross like this ! You see the purple rocket on my chart ? That looks to be approximately where we will get a cross up , could be in early March . This should be extremely good for FET and remember FET also has a Mainnet coming in March ! All good stuff ! Looks great ( also I hope you are having a great day . )

Feeling really bullish about $FET Feeling really bullish about $FET
Parabolic move in the making w/ almost no red candles since mid Jan on the 2D
Volume making higher highs and UCTS bullish across all timeframes..
I think it's just a matter of time to see a move similar to July 2020..
#FET

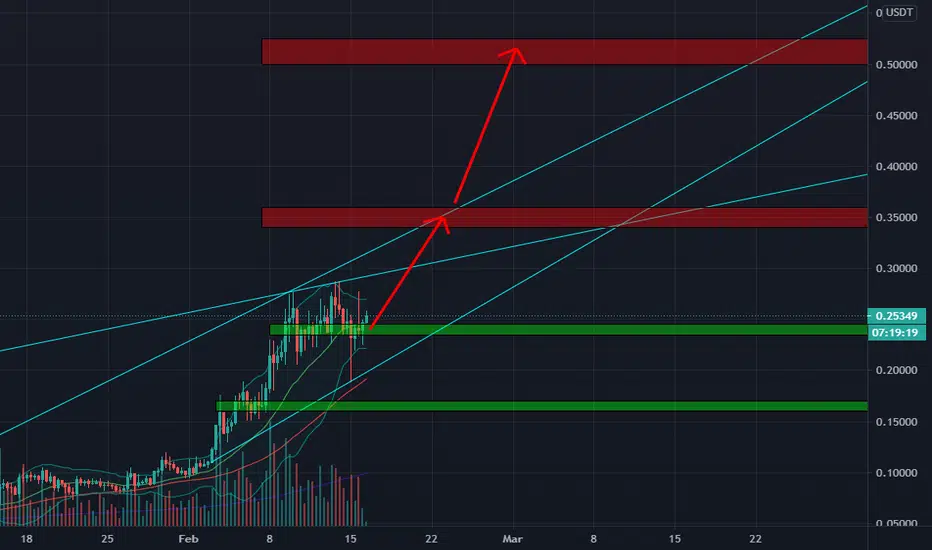
🆓Fetch.AI/USDT Analysis (16/2) #FET $FETFET is accumulating around $0.24 to be ready for a strong rally in the coming days to $0.35 and $0.5 zones.
📅EVENTS
👉Feb 18 : DMM Deep Dive and Q&A
👉Feb 19 : Phoenix Program Pool
👉Feb 28 : Autonomous Travel Agents
👉Mar 31 : Mainnet Launch
📈BUY
-Buy: 0.235-0.245$. SL if B
📉SELL
-Sell: 0.34-0.36$. SL if A
-Sell: 0.5-0.525$. SL if A
❓Details
Condition A : "If 8H candle closes ABOVE this zone"
Condition B : "If 8H candle closes BELOW this zone"
FET ATH BreakoutFET is currently in a ascending triangle looking to break its ATH.
If it can break the ~0.275 level its probable that it will strongly break out of the triangle to the upside.


FET/BTC Weekly FETCHAI BINANCE:FETBTC is one of my favourite coin. I'm super bullish on this project. It has been having a little uptrend for a couple of weeks. I expect more pump action IF BTC does not pull down the market.
It has formed a double bottom which makes it bullish
The MACD is bullish
The 10 and 20 EMA is having a squeeze, and there is about to be a cross over for more bullish trend
Stock RSI shows over bought, but there can be a flip up

FET/USDT Triangle BreakoutEntrance: $0,20500
Stop-Loss: $0,19900
1st Target: $0,23000
2nd Target: $0,29227
