FET possible 150% in 30Days R:R3Hello everyone,
FET looks on daily very interesting. If it can break threw the MA and hold it as support then 150% run is possible ( Might go even up to 300-500% within next weeks/months)
but we got a solid possible 150% in 30Days with R:R3
HERE is where I gave a free chat call
Mainnet 2.0 about to be launched
Weekly GOD had bullish cross
5D allready predicting a very likely trend into bull reversal (uptrend)
ChaChain
-------------
Disclaimer:
I´m not registered or licensed in any jurisdiction whatsoever to provide investing advice or anything of an advisory or consultancy nature, and therefore I´m unqualified to give investment recommendations. Always do your own research and consult with a licensed investment professional before investing. This communication is never to be used as the basis of making investment decisions, and it is for entertainment purposes only.
KEYWORDS
trading, bitcoin , bitcointrading, profitable trading, profittrading, profit trading, secret, divergence, bull divergence, bear divergence, divergencetrading, divergence trading, trading strategy, how to trade bitcoin , bitcoin trades, bitcoin trading, make profit, take profit, trading strategy, trading technique, successful, successful trader, successful technique, successful strategy, successful secret, how to trade, trend analysis, technical analysis , indicators, rsi , relative strenght index, let it rain, successful life, easy strategy, easy trading, easy technique, make money, crypto investing, investing, crypto, cryptocurrency, cryptocurrencies, mentoring, money, chartart, beyond technical analysis
FETBTC

FETUSDT: Update Analysis **************************
Price:0.1 USDT
TP_LVL I: 0.13 USDT
TP_LVL II: 0.15 USDT
TP_LVL III: 0.18 USDT
SL: 0.085 USDT
Expected Return: 24%- 48%- 81%
Reward/Risk: 2- 2.25
**************************

FETUSDT_DailyPrice:0.056 USDT
TP_LVL I: 0.07 USDT
TP_LVL II: 0.094 USDT
TP_LVL III: 0.13 USDT
SL: 0.042 USDT
Expected Return: 63 %
Reward/Risk: 4.45

FET - good entry after retestFET is one of the Binance IEO that saw a great pump after its release (SOS strenght signal) then dumped to the abyss.
What we like about it : it didnt really pumped yet and its ATH is still at 150% gain from now.
Compare it to REN and CRV, you will see the potential. Especially i dont think it will stop at ATH.
First target - 1 month - 0.19$

FET Fetch.AI Breaking out - FETBTC FETUSD FETBUSD FETUSDT FETCHFET Fetch.AI Breaking out - FETBTC FETUSD FETBUSD FETUSDT

$FET, Long way to the top...$FET
Long way to the top...
UCTS switching to green (buys) across 1D and every lower timeframe (didn't happen since July 2020 - 300%+ runup)
Still looking for it to flip current level at ~250 sats but it may be the start for a bigger movement..
#FET


FET / BTC by Rocket Bomb 🚀💣Hello, friends! FET/BTC looks like accumulating in the very bottom!
looks like not bad potential!
MY ADVICE to You , my dear💋
The price may not fall so low, that's why I always recommend splitting buy orders!!!Buy little now for don't miss entry point.If it goes lower, then you average the buying price - it will be great anyway!
Tell me, do you trade Alts vs BTC?
how are your results?
I try to be useful to You🧡
Always sincerely with You😊
Your Rocket Bomb🚀💣

FETUSDT LONG TIEMFETCT.AI It has the end of the descending wave and the rising wave has started
The currency has positive news in the medium term
The channel was breached and the secret key was breached

Fetch.AI (FET) Descending Channel Broken (Breakout)FETBTC (Fetch.ai) is another altcoin pair that is looking to profit/grow on this Bitcoin retrace...
We have a descending channel broken.
A volume breakout.
A very strong RSI.
Prices trading above EMA21 and EMA10.
EMA50 also being challenged today.
Strong bullish action taking place in the past three days is another bullish signal.
Closing below EMA50, 0.00000230, can send prices lower before more up.
Closing above this level can send FETBTC flying straight up.
Namaste.


Big Cup Of FET/BTC #Fetchai $FET #fet #cryptoHere we see our Binance FET weekly chart . It appears to be forming a massive cup structure . That would take us back up to the .706 fib near
9900 sats to form the top of the cup . A handle would form after that possibly taking us much higher.This obviuosly would not be happening until the later part of the year to reach these upper levels - but in a bullrun year it is very possible to get there . Also ETH is close to reaching its' previous All Time High of $1400 approx . So other coins may also revisit their All Time Highs , since ETH leads the way . FET All Time High was
above 14000 sats . That would be great ! Also it appears we are Blue Skies above 3250 on the weekly chart as that is our last resistance there . This looks good .


Fetch-BTC Attention à l'éxces baissier acceptable. Pour du long therme un bon trade est possible, mais -25% est toujours faisable .
DYOR
- Zone RSI de réaction
- Divergence haussière
- BB resserrer sur rsi.

FETBTC Bullish!!!Once the price gets over 27 daily MA price should rise!
on first call, we had 40% profit.
Try to buy below 265 sat.
stop loss should below that green line 240 sat.
target are on the chart

#FET/BTC Broke out! 95% Potential Profit Trade setup.FET BTC just broke out of the 21D MA and also the local trendline resistance.It bounced exactly from the bottom.
Expecting it to break the black trendline resistance and eventually go for a potential 95% rally.
ENTRY: 265 to 274
If somehow we get to see a dip we will buy back more putting a Stop Loss around 243.
TAREGTS:
324
356
411
439
490
512
SL : 243
If you like this setup please hit the like button and share your views in the comment section.
#PEACE

FETBTC Breakout setupprice made breakout above of the trend line also bullish divergence on daily chart where price is moving around support
good consolidation of price ready to move higher
Buy : 265 - 270
Stop : 238
Target : 300 , 350 , 385 , 445

FET Bullish reversal soonFetch ai is a solid project, probably one of the best one from the FA viewpoint. I would not sleep on it. Looking bullish to me.
First two short term targets : $0.076/$0.087
Mettalex launching Jan 2021
Atomix rewards in the next staking round
Mainnet March 2021

Bullish FET/BTC In the past i predicted a breakout from the resistance and it went ahead to do over 400% There is nothing much to say, but looking at the Stoch RSI it looks bullish, if history will repeat itself. We all home BTC does not have a major drop which would drastically affect all alts


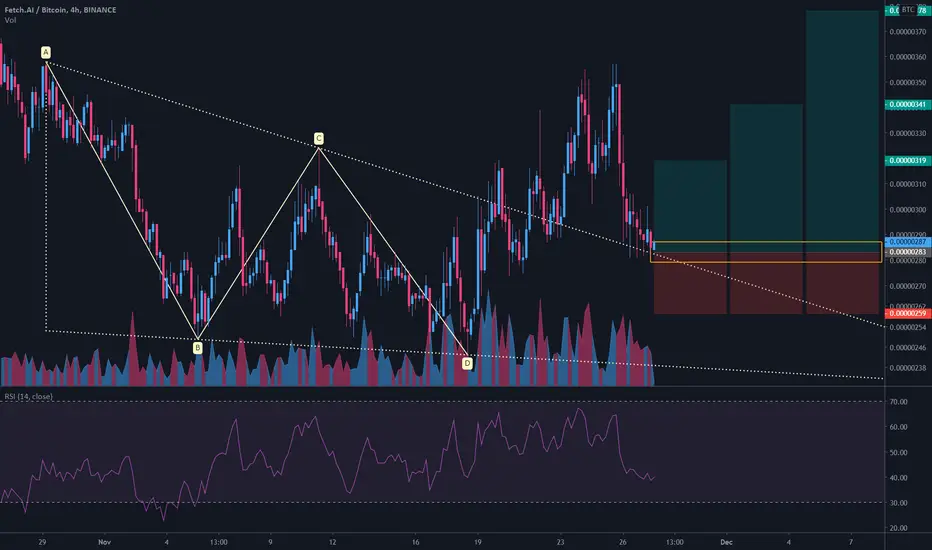
FET/BTC 4h (Binance Spot)Descending triangle breakout & pullbackFetch is looking ready for next move up, again.
Current Price= 0.00000287
Buy Entry= 0.00000287 - 0.00000279
Take Profit= 0.00000319 | 0.00000341 | 0.00000378
Stop Loss= 0.0000259
Risk/Reward= 1:1.5 | 1:2.42 | 1:3.96
Expected Profit= +12.72% | +20.49% | +33.57%
Possible Loss= -8.48%
Fib. Retracement= 0.5 | 0.786 | 1.272
Margin Leverage= 1x
Estimated Gain-time= 240h
Fetch.AI Now Above EMA200, 50% Target MappedFeatch.AI is now above EMA200 on the 4H timeframe, this with increasing volume... Notice the volume bars at the bottom of the chart.
I am looking at this "short-term", which means that the move that I am mapping here can happen fairly quickly if there is a bullish follow-up, in a matter of days.
This is just a prediction, of course, this doesn't mean that it will necessarily take place but the signals are pointing to FETBTC moving up next.
Thanks a lot for your support.
Namaste.
