$FET local ending Diagonal and wave 2 near completion?NYSE:FET was rejected for the 4th time at the daily 200EMA! Each time the probability of a breakout increases.
I have adjusted the High Volume Nodes for accuracy.
Locally Fetch appears to have completed a motif wave up with an ending diagonal for wave 5. Wave 2 is expected to find support at the daily pivot and .618 Fibonacci retracement before attempting a breakout of the daily 200EMA once more.
A move below wave II will invalidate this analysis.
Safe trading
Fetch
$FET Does Zooming out look better?NYSE:FET has been underperforming lately and the local chart looks trash so I wanted to zoom out to give us all some context on the larger picture which hasn't really changed.
Price appears to have completed wave II at the High Volume Node (HVN) support and 0.5- 0.618 'Golden Pocket' Fibonacci retracement and wave 3 is underway but finding local resistance.
Pivots are warped due to the strength of the move last year so wouldn't count them as reliable so focusing on support and resistance. The megaphone pattern is clear and the next area of resistance when FET starts moving is the $1.2
Weekly RSI is decreasing and is attempting to cross bearishly. If Bitcoin has a significant pullback I would expect new lows for FET at this rate. I have a neutral stance at this point.
Analysis is invalidated below $0.546
Safe trading

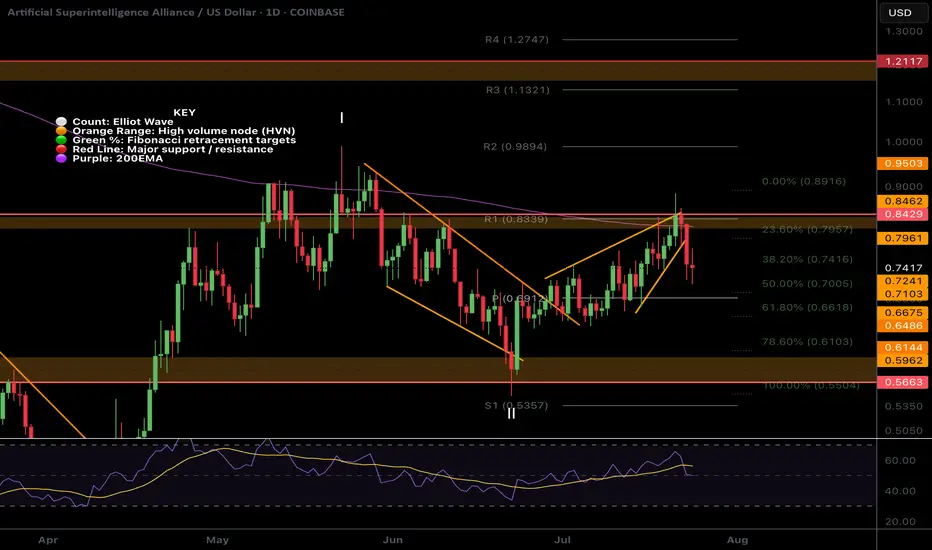
$FET Ready for the next move up?NYSE:FET looks ready for the next move up with a similar analysis to many other alts I have shared.
It is breaking out of descending resistance after testing the .618 Fibonacci retracement and High Volume Node (HVN) as support. Price broke above the daily pivot and is now swinging below, a recovery above the local swing high will be a bullish signal to go long with a wave 3 target of the R3 daily pivot and major resistance HVN at $1.13.
Analysis is invalidated below $0.54
Safe trading

#FET/USDT Preparing for a Major Rally ?#FET
The price is moving within a descending channel on the 1-hour frame and is expected to break and continue upward.
We have a trend to stabilize above the 100 moving average once again.
We have a downtrend on the RSI indicator that supports the upward break.
We have a support area at the lower boundary of the channel at 0.655, acting as strong support from which the price can rebound.
We have a major support area in green that pushed the price upward at 0.650.
Entry price: 0.665
First target: 0.688
Second target: 0.716
Third target: 0.750
To manage risk, don't forget stop loss and capital management.
When you reach the first target, save some profits and then change the stop order to an entry order.
For inquiries, please comment.
Thank you.

FET Wave 2 Complete?NYSE:FET (Fetch.ai) appears to have completed a wave 2 pullback and looks set for the next move up towards $1.1
Price swung below the bottom of the wedge, tested the S1 daily pivot and 61.8 Fibonacci golden pocket. It quickly recovered with a bullish engulfing daily candle negating the 3 previous days bearish price action.
A close above the top wedge line and daily pivot will be the signal to go long again.
Analysis is invalidated below $0.54 and that will bring up a downside target of $0.34 which is the ascending macro support from June 2023.
Safe trading

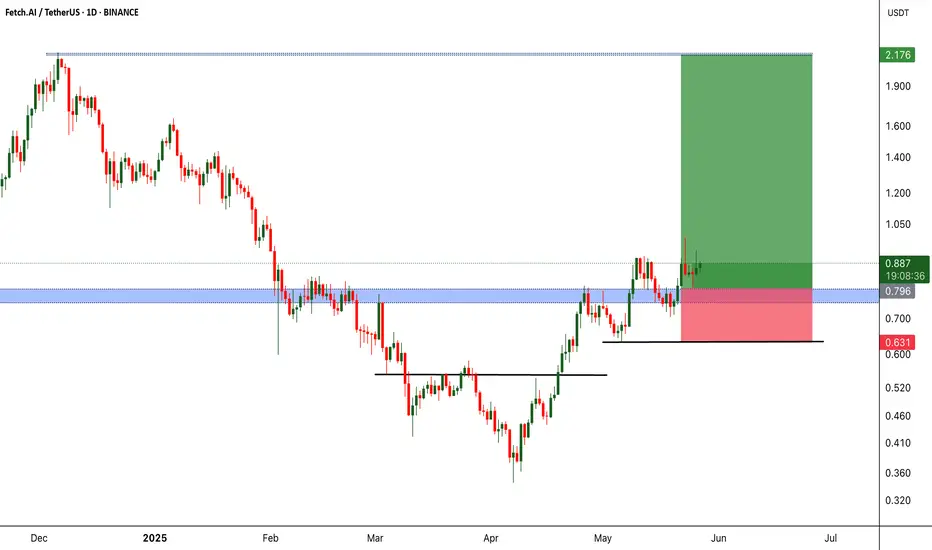
FETUSDT Major Resistance Cracked, Eyes on Sky!BINANCE:FETUSDT has recently broken out from a significant resistance level that previously acted as a strong barrier. After this breakout, the price action displayed a textbook retest of the former resistance—now turned support which held firm, confirming the bullish move.
This successful retracement signals strength in the current uptrend and opens the door for potential continuation towards higher highs. The market structure is showing signs of higher lows and increasing momentum, which could fuel a strong rally in the near term.
While the setup looks promising, it’s essential to emphasize risk management. Always use a stop-loss to protect your capital and manage your position sizing according to your trading plan. The crypto market can be volatile, and smart risk control separates long-term winners from short-term chasers.
All eyes are now on NYSE:FET for its next move. If momentum continues, we could witness a significant upward leg. Stay sharp and let the trend be your guide!
BINANCE:FETUSDT Currently trading at $0.88
Buy level : Above $0.8
Stop loss : Below $0.63
Target 1: $1.1
Target 2: $1.4
Target 3: $2.1
Max leverage 3x
Always keep stop loss
Follow Our Tradingview Account for More Technical Analysis Updates, | Like, Share and Comment Your thoughts
#FET/USDT#FET
The price is moving within a descending channel on the 1-hour frame, adhering well to it, and is heading for a strong breakout and retest.
We are seeing a bounce from the lower boundary of the descending channel, which is support at 0.814.
We have a downtrend on the RSI indicator that is about to be broken and retested, supporting the upward trend.
We are looking for stability above the 100 moving average.
Entry price: 0.823
First target: 0.866
Second target: 0.912
Third target: 0.957

FET ROADMAPTo me the view is pretty clear.
* The purpose of my graphic drawings is purely educational.
* What i write here is not an investment advice. Please do your own research before investing in any asset.
* Never take my personal opinions as investment advice, you may lose your money.

#FETUSDT #4h (Bitget Futures) Falling wedge breakout and retestFetch just regained 100EMA support and looks good for bullish continuation from here.
⚡️⚡️ #FET/USDT ⚡️⚡️
Exchanges: Bitget Futures
Signal Type: Regular (Long)
Leverage: Isolated (4.0X)
Amount: 5.0%
Current Price:
0.7863
Entry Zone:
0.7806 - 0.7504
Take-Profit Targets:
1) 0.8561
1) 0.9244
1) 0.9926
Stop Targets:
1) 0.6897
Published By: @Zblaba
NYSE:FET BITGET:FETUSDT.P #4h #Fetch #AI fetch.ai
Risk/Reward= 1:1.2 | 1:2.1 | 1:3.0
Expected Profit= +47.3% | +83.0% | +118.7%
Possible Loss= -39.6%
Estimated Gaintime= 1-2 weeks

#FET/USDT#FET
The price is moving within a descending channel on the 1-hour frame, adhering well to it, and is heading for a strong breakout and retest.
We are experiencing a rebound from the lower boundary of the descending channel, which is support at 0.696.
We are experiencing a downtrend on the RSI indicator, which is about to break and retest, supporting the upward trend.
We are looking for stability above the 100 Moving Average.
Entry price: 0.721
First target: 0.779
Second target: 0.817
Third target: 0.863

#FET/USDT#FET
The price is moving within a descending channel on the 1-hour frame, adhering well to it, and is heading for a strong breakout and retest.
We are experiencing a rebound from the lower boundary of the descending channel, which is support at 620.
We are experiencing a downtrend on the RSI indicator, which is about to break and retest, supporting the upward trend.
We are looking for stability above the 100 moving average.
Entry price: 0.625
First target: 0.659
Second target: 0.647
Third target: 0.659

#FET/USDT#FET
The price is moving within a descending channel on the 1-hour frame, adhering well to it, and is heading for a strong breakout and retest.
We are seeing a bounce from the lower boundary of the descending channel, which is support at 0.477.
We have a downtrend on the RSI indicator that is about to be broken and retested, supporting the upward trend.
We are looking for stability above the 100 moving average.
Entry price: 0.500
First target: 0.513
Second target: 0.529
Third target: 0.550

Fetch AI is bullishBINANCE:FETUSDT is bullish as it broke the consolidation triangle
Entry 1.66
Target 2.34
Stop 1.00

FETUSD - Last year move about to hit ?x3 on this one
Open : 0.8
SL : 0.599
TP1 : 1.5 // 10 to 100% (depends on the date we hit it)
TP2 : 3.2 // 25% to 100% (depends on the date we hit it)
TP3 : 5 // 50 to 100% (depends on the date we hit it)
Note the similarity between, 16 feb 2024 and 2025 setup

FET | ALTCOINS | Fetch.AI - GREAT Re-Accumulation ZoneFET was one of my top altcoins for 2024, and it did not disappoint after a 500%+ increase early last year.
FET has since been trading in a major corrective cycle, with near-term bounces (also called mid-cycles or mini-cycles).
A great re-accumulation zone is approaching, and it's possible that FET may trade range before making another push for the upside.
Make sure you don't miss yesterday's update on another great alt, ARKM:
______________
BINANCE:FETUSDT

#FET/USDT
#FET
The price is moving in a descending channel on the 1-hour frame and is adhering to it well and is heading to break it strongly upwards
We have a bounce from the lower limit of the descending channel, this support is at a price of 1.00
We have a downtrend on the RSI indicator that is about to be broken, which supports the rise
We have a trend to stabilize above the moving average 100
Entry price 1.05
First target 110
Second target 1.16
Third target 1.22

#FET/USDT Ready to go higher#FET
The price is moving in a descending channel on the 1-hour frame and sticking to it well
We have a bounce from the lower limit of the descending channel, this support is at 1.26
We have a downtrend on the RSI indicator that is about to be broken, which supports the rise
We have a trend to stabilize above the 100 moving average
Entry price 1.28
First target 1.33
Second target 1.37
Third target 1.44

Time to BUY Fetch_aiHi fellow traders, FETUSDT is ready to make a move higher after completing the smaller correction. Target the 4 USDT level. Good luck and trade safe!

FET and why we can see - 70% again? BINANCE:FETUSDT
Possible Targets and explanation idea
➡️ Weekly fib legit. After AI narrative we saw perfect test 0.618 lvl
➡️ Still didn't sweep liquidity in 0.27 zone.
➡️ We can close at least 2 of green weekly gaps at least -70% again
➡️ Fundamental value based on Take Profit indicator last yellow line 0.14$
➡️ All lines are dynamic. After sweep liquidity at the bottom road will be open to weekly gap over 0.70$
Hope you enjoyed the content I created, You can support with your likes and comments this idea so more people can watch!
✅Disclaimer: Please be aware of the risks involved in trading. This idea was made for educational purposes only not for financial Investment Purposes.
---
• Look at my ideas about interesting altcoins in the related section down below ↓
• For more ideas please hit "Like" and "Follow"!

moment of truth for FET coming very soon to determine the futureFET behaved weaker than expected before (see dimmed trendline drawn before)
it also wicked out below major support, which is not great, though not too horrible either.
It adds to weakness -- strong selloffs, followed by weak rallies
Either way, we approach a crucial short term trendline. Breakout and we can expect more growth short term for the weeks ahead. Followed by another major decision point.
If we go down, we can break down lower.
Not trading this for now until I see strength. Neutral.

FETUSDT | Very Important AreaIn my analyses over the last two days, I highlighted the possibility of a pullback in the crypto market leading up to Christmas. This cautionary outlook led me to recommend setting buy points significantly lower. However, I advise waiting for BTC to show signs of meeting buyers before acting on these points.
For FET/USDT, I’ve identified a critical demand region, marked by the blue box on the chart. I consider this zone highly valuable, as it represents an area where meaningful buyer reactions could emerge. Observing the price action in this region will be essential to evaluate its potential.
I keep my charts clean and simple because I believe clarity leads to better decisions.
My approach is built on years of experience and a solid track record. I don’t claim to know it all, but I’m confident in my ability to spot high-probability setups.
My Previous Analysis
🐶 DOGEUSDT.P: Next Move
🎨 RENDERUSDT.P: Opportunity of the Month
💎 ETHUSDT.P: Where to Retrace
🟢 BNBUSDT.P: Potential Surge
📊 BTC Dominance: Reaction Zone
🌊 WAVESUSDT.P: Demand Zone Potential
🟣 UNIUSDT.P: Long-Term Trade
🔵 XRPUSDT.P: Entry Zones
🔗 LINKUSDT.P: Follow The River
📈 BTCUSDT.P: Two Key Demand Zones
🟩 POLUSDT: Bullish Momentum
🌟 PENDLEUSDT.P: Where Opportunity Meets Precision
🔥 BTCUSDT.P: Liquidation of Highly Leveraged Longs
🌊 SOLUSDT.P: SOL's Dip - Your Opportunity
🐸 1000PEPEUSDT.P: Prime Bounce Zone Unlocked
🚀 ETHUSDT.P: Set to Explode - Don't Miss This Game Changer
🤖 IQUSDT: Smart Plan
⚡️ PONDUSDT: A Trade Not Taken Is Better Than a Losing One
💼 STMXUSDT: 2 Buying Areas
🐢 TURBOUSDT: Buy Zones and Buyer Presence
🌍 ICPUSDT.P: Massive Upside Potential | Check the Trade Update For Seeing Results
🟠 IDEXUSDT: Spot Buy Area | %26 Profit if You Trade with MSB
📌 USUALUSDT: Buyers Are Active

FETUSDT | Lets Try To Snipe ItIn this setup, I've identified two key green zones as potential demand areas based on historical price action. These areas are where price wicks have previously formed, suggesting strong buying interest.
Why These Zones?
The green boxes highlight regions where buyers have aggressively entered the market in the past, creating significant wicks.
On lower timeframes (LTF), such areas are often liquidity zones, where institutional traders may step in to fill large orders.
Stop-Loss Placement
The stop-loss is set at 1.77, slightly below the second green box. This placement minimizes risk while accounting for potential liquidity grabs before a reversal.
Trading Plan:
Wait for the price to revisit the green zones.
Look for bullish confirmation signals (e.g., candlestick patterns, order flow shifts) before entering long positions.
Target key resistance levels for exits, ensuring a favorable risk-to-reward ratio.
Always trade with proper risk management and adjust stops if market structure changes. Let’s see how the price reacts! 🚀
I keep my charts clean and simple because I believe clarity leads to better decisions. Trading doesn’t have to be overly complicated, and I enjoy sharing setups that have worked well for me.
My approach is built on years of experience and a solid track record. I don’t claim to know it all, but I’m confident in my ability to spot high-probability setups. It’s all about learning and growing together as traders, and I’m here to share what I see.
The markets can confirm what the charts whisper if we’re paying attention. I hope these levels help you as much as they’ve helped me in the past. Let’s see how this plays out!
My Previous Hits
🐶 DOGEUSDT.P: Next Move
🎨 RENDERUSDT.P: Opportunity of the Month
💎 ETHUSDT.P: Where to Retrace
🟢 BNBUSDT.P: Potential Surge
📊 BTC Dominance: Reaction Zone
🌊 WAVESUSDT.P: Demand Zone Potential
🟣 UNIUSDT.P: Long-Term Trade
🔵 XRPUSDT.P: Entry Zones
🔗 LINKUSDT.P: Follow The River
📈 BTCUSDT.P: Two Key Demand Zones
🟩 POLUSDT: Bullish Momentum

Freshly goldencrossed Fetch heading towards inverse h&s targetGoldencross just occurred and so far fetch is responding with a green candle. It has been slowly climbing up its inverse head and shoulder measured move line but we could see it do something similar here to how Render reacted recently. I expect price to hit both of these targets in the near future *Not financial advice*
