FET Joins the Bullish league can easily move +50%. BINANCE:FETUSDT Looks good to move.
Zoom into the chart for better view
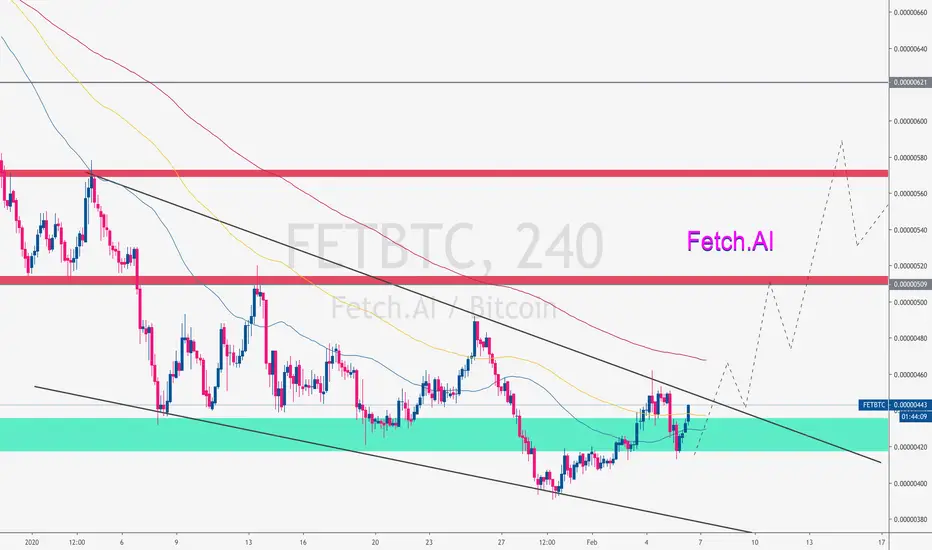
We are about to test the channel once more.
Volume is increasing with RSI rising and Potential MACD crossover is around the corner.
Use Ema 50 as stoploss, take profits on red lines.
Will share one more chart taking confluence of other indicators soon.
Happy trading.
Fetch


Ascending Triangle on FETCHHello, Traders.
FETCH/BTC is breaking out an ascending triangle, the entry point is on the pullback of the accumulation and the target will be the next important resistance around 0.00000413
Best regards, Sandro and Gustavo.
Feel free to visit my pages if you would like to know more

50% FETCH.AI GAIN POTENTIAL - Wyckoff Accumulation. Here I have drawn what I believe to be the potential Phase E wave on the Wyckoff accumulation phase of Fetch.AI
FOr those of you have been following along with us for the last year, you will remember that we saw CELR and ONE all move in similarity, which you can go check yourself now if you would like. It is uncanny. It appears one of the whales is back and has been taking their time accumulating.
I am not great at the Wyckoff analysis as it is new to me, so if anyone else has an insight to this analysis please do not hesitate to share.
Our Entry now has a position just above the phase D accumulation area, with a stop loss around 10% below that, AS this play continues I will ladder in, for now, this is a small play looking at a potential of 50% gains.
Here is some more information on these accumulation periods and what to look for.
school.stockcharts.com
BINANCE:FETBTC


$FET : accumulation area ...$FET is drawing a range of accumulation
Waiting for a break beacause bearish consolidation is possible and $BTC could retrace
Not a financial advice

FETCH.AI - investros come's back and look on development - 2020solid projects like Fetch.ai are not often on this market.
Most coins doing for Finance and trading sector, but this markets are heavy and also difficult to entry.
Fetch doing good with ai and Industry 4.0
many partnerships with solid companies on mobi platform. fetch is to me is a better stage than iota at the Moment.
we can see here next time 50-70% growth in Price.
In case of btc pump's hard, it can drop again or try new lows, but in usd$ found now a base Price.
Longterm GEM with x50-100 return possibility.

SimilaritiesThis pattern has been appearing across a wide range of alt coins including Fetch and District0x, district0x in which i am long on. Is this a bullish pattern? Alt coins may be on the VERGE of large growth. The pattern shows a clear top with an indistinguishable shoulder formation. Any comments on the formation would be helpful..
Cheers
Bixley

FET / BTC | Entry for ProfitsFET showing strong accumulation nature;) may breakout the resistance within few days and make 16-20% profits. Looking for entry on local retracement. SL below blue zone.
FETCH USD new wave up looks likelyFET has been in a down trend since its launch. The price is currently sitting below the moving average on the longer time frame charts (this is the 4 day chart)
However the price action is going sideways and slowly rising and has started to approach the EMA (Length 20)
Potential for at least 60% gains (resistance at the slower moving average (Length 50).
Trend lines on chart show support and resistance levels. We are close to crossing over major resistance channel and it could indicate a reversal in which case longer term targets could be as high as 700%.
RSI and Stoch RSI also show momentum is starting to swell upwards
Set stop loss and trade wisely, trade is marked on the chart with the long position.

$FET - Breaking Falling Wedge$FET breaking the falling wedge
Volume is increasing
Bottom triangle is in retest

Fetch.AI Breaks Falling Wedge | Bullish View Mapped + TargetsFetch.AI (FETBTC) just broke out of a falling wedge and is now trading above EMA10... We are looking at the bullish scenario here.
Prices for FETBTC peaked in early December, a strong correction followed and after a higher low the 0.786 Fib. retracement support for the last bullish wave has been conquered.
Now let's take a look a the MACD:
Here we have a bullish cross and the histogram now going green.
The RSI is also trending up:
Conditions for change
The above signals look pretty good but there isn't enough volume... Charts are always changing and all scenarios remain possible at all times. If prices for FETBTC go lower and close below 0.00000430, the above bullish scenario becomes invalid and a new analysis is needed. Going below the above level would turn this chart bearish.
Thanks a lot for reading.
Remember to hit LIKE for more articles, trades, and to show your support.
Namaste.

FETBTC Technical Analysis Overview ( Bullish broke out )FET/BTC Technical Analysis:
FET/BTC now Current price is 504 Satoshi.
And now Falling wedge Broke out also done.
We can see in Chart Broke out also confirmed with Good volume.
Support Level: 456-475 Satoshi Strong Support
and 407 Satoshi is All Time Support and Also we can say Last support.
If this also break then we can see free fall till 200-300 Satoshi.
Resistance: 600 Satoshi / 716 Satoshi.
Targets: 600/716 Satoshi is our initial Targets.
If Bitcoin will stable then 807 Satoshi is our last Target.
Why buy..? Technically also looking very good and bullish Brokeout Falling wedge.
Note: Not financial Advice.
Follow me and also share and like guys.


50% move for FETCH.AIPrice action has formed a falling wedge with a steep angle. once prices breakout of the wedge formation the measured move puts a profit target at 720sats which is about a 50% rise . i have also highlighted potential resistances as price ascend
This trade invalidates if prices break below 430sats

FETCHBTC Is this a bullish pattern? - EducationPosting this to see the outcome. Have been consistently seeing this pattern across a wide range of low cap cryptocurrencies.

$FET - Falling Wedge ...$FET is drawing a falling wedge without great sign of reversal
If this one could go on a very old low red support line, we will watch it
Not a Financial Advice

ZOOM: FETCH did like other coins after mainnet same patternlooks like, fetch chart doing the same as other coins after mainnet pump.
we had a H&S pattern, 600 looks like a support now.
10% gains should be from here easy.
In case of hard btc pump, stop loss it with 5%
re buy under 540sat.

