$FETUSDTHere's a clearer and more polished version of your statement:
My projection for FET is that it will rise to around $1.569 before facing any significant correction. After this correction, I expect the price to resume its upward rally.
Not a financial advice. Trade at your own risk!
FETUSDT

$FET has formed an ascending triangle pattern!NYSE:FET has formed an ascending triangle pattern!
After getting rejected from the $0.93–$0.95 resistance zone, price pulled back but it's holding above this lower trend-line support and this 100EMA.
If this support holds, we could see a move back toward the resistance zone, and maybe even a breakout above it.
DYOR, NFA

#FET/USDT#FET
The price is moving within a descending channel on the 1-hour frame, adhering well to it, and is heading for a strong breakout and retest.
We are seeing a bounce from the lower boundary of the descending channel, which is support at 0.814.
We have a downtrend on the RSI indicator that is about to be broken and retested, supporting the upward trend.
We are looking for stability above the 100 moving average.
Entry price: 0.823
First target: 0.866
Second target: 0.912
Third target: 0.957

FET ROADMAPTo me the view is pretty clear.
* The purpose of my graphic drawings is purely educational.
* What i write here is not an investment advice. Please do your own research before investing in any asset.
* Never take my personal opinions as investment advice, you may lose your money.

#FETUSDT #4h (Bitget Futures) Falling wedge breakout and retestFetch just regained 100EMA support and looks good for bullish continuation from here.
⚡️⚡️ #FET/USDT ⚡️⚡️
Exchanges: Bitget Futures
Signal Type: Regular (Long)
Leverage: Isolated (4.0X)
Amount: 5.0%
Current Price:
0.7863
Entry Zone:
0.7806 - 0.7504
Take-Profit Targets:
1) 0.8561
1) 0.9244
1) 0.9926
Stop Targets:
1) 0.6897
Published By: @Zblaba
NYSE:FET BITGET:FETUSDT.P #4h #Fetch #AI fetch.ai
Risk/Reward= 1:1.2 | 1:2.1 | 1:3.0
Expected Profit= +47.3% | +83.0% | +118.7%
Possible Loss= -39.6%
Estimated Gaintime= 1-2 weeks

FETUSDT : Massive Opportunity or Fakeout Trap?Yello Paradisers, have you been watching FET lately? If not, now is the time to pay close attention—because this setup could be gearing up for a serious move, and missing it might mean missing one of the cleanest opportunities this month. Let’s break it down before it’s too late.
💎FETUSDT is currently displaying a bullish market structure on the higher timeframes, signaling growing strength beneath the surface. Even more compelling is the fact that it has just formed a classic falling wedge pattern—a powerful reversal setup—paired with a bullish divergence. This combination significantly increases the probability of a bullish breakout from current levels.
💎Right now, price is sitting right on a key support zone, which is reinforced by the 200 EMA. This confluence of support gives added confidence to the setup and boosts the probability of an upside move. The risk-to-reward ratio from this zone is also highly attractive, making this one of those clean opportunities that traders should never ignore. The bullish outlook remains valid as long as price holds above our invalidation zone.
💎However, if the price breaks down and closes below this invalidation level, then the entire bullish idea is off the table. In that scenario, it’s wiser to stay patient and wait for stronger, more reliable price action to develop before re-entering the market. There’s no need to rush a trade when better setups are always around the corner.
Discipline, timing, and execution will always separate the professionals from the crowd. Stay focused, Paradisers—the market rewards those who move with purpose, not panic.
MyCryptoParadise
iFeel the success🌴

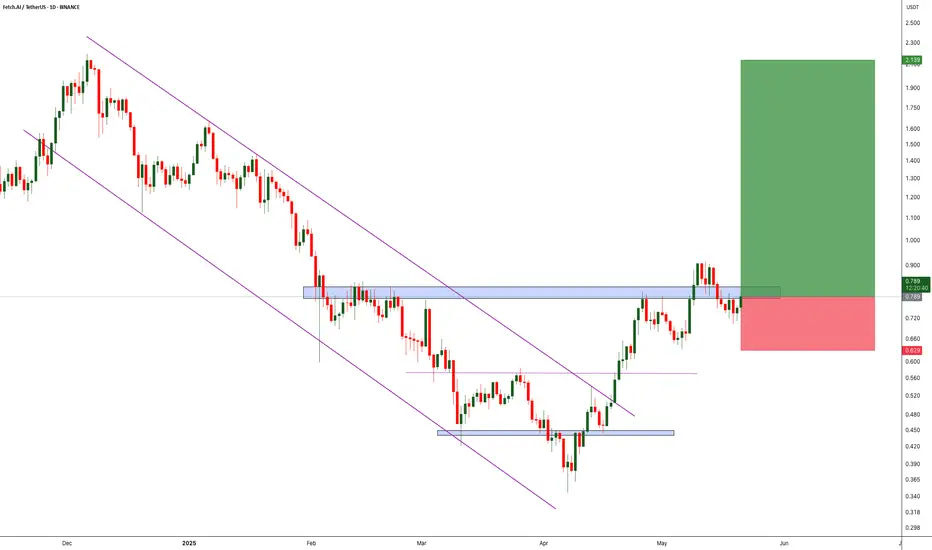
Eyes on FET – The Calm Before the Bullish Storm?BINANCE:FETUSDT previously broke out of a clean descending channel, flipping the trend and shifting into a bullish structure. Since the breakout, the price has been forming consistent higher highs and higher lows — a clear sign of growing momentum. Right now, it’s testing a local resistance zone. A strong breakout above this level could trigger a significant move to the upside, potentially setting the stage for a new bullish leg. Keep an eye on volume confirmation and price action at the resistance.
As always, manage your risk carefully — smart stop loss placement is key in volatile markets. Let the trend be your friend, but don’t forget your seatbelt!
BINANCE:FETUSDT Currently trading at $0.8
Buy level : Above $0.8
Stop loss : Below $0.63
Target : $2.1
Max leverage 3x
Always keep stop loss
Follow Our Tradingview Account for More Technical Analysis Updates, | Like, Share and Comment Your thoughts
#FET/USDT#FET
The price is moving within a descending channel on the 1-hour frame, adhering well to it, and is heading for a strong breakout and retest.
We are experiencing a rebound from the lower boundary of the descending channel, which is support at 0.696.
We are experiencing a downtrend on the RSI indicator, which is about to break and retest, supporting the upward trend.
We are looking for stability above the 100 Moving Average.
Entry price: 0.721
First target: 0.779
Second target: 0.817
Third target: 0.863

#FET/USDT#FET
The price is moving within a descending channel on the 1-hour frame, adhering well to it, and is heading towards a strong breakout and retest.
We are experiencing a rebound from the lower boundary of the descending channel, which is support at 0.695.
We are experiencing a downtrend on the RSI indicator that is about to be broken and retested, which supports the upward trend.
We are heading towards stability above the 100 moving average.
Entry price: 0.730
First target: 0.765
Second target: 0.810
Third target: 0.850

$GOAT/USDT 1H Chart Breakout Alert!$GOAT/USDT 1H Chart Breakout Alert! 🐐
After a clean breakout from the downtrend line, price is now retesting the breakout zone + key demand area 🔥
- Entry: CMP
- Target: $0.20+
- SL: Below $0.142
Setup looks solid 👀
DYRO, NFA

$XLM Eyes Explosive Rally After BreakoutXLM has officially broken out of its long-term falling channel!
After months of lower highs, the breakout flips the trend bullish, with a projected move toward $0.64 (+120%).
Now consolidating just above the breakout zone. A clean hold here could be the start of something big.
Next target: $0.64 🚀
DYRO, NFA

$ONDO Ready to FlyONDO retested the breakout trendline and bounced from a strong demand zone 0.84–0.87.
If the retest holds, bulls could target $1.20 / $1.63 / $2.14 a potential 135% move!
Watch for confirmation & volume spike.
Invalid below $0.8060
DYRO, NFA

$FHE/USDT Chart Update$FHEUSDT/USDT Chart Update
Strong bounce from the demand zone
6h structure holding firm with a clear bullish reaction
Entry: $0.095–0.097
SL: $0.08615
TP: $0.18484+
It looks ready to explode, so don’t sleep on this one! 👀
DYRO, NFA

Fetch your Future with FET!Here is the FET M.Profile
FET/USDT has shown strong strength over the past sessions, forming a clear upward structure supported by consecutive higher value areas and rising POCs. After a period of low activity and tight consolidation between $0.72–$0.76, a strong breakout occurred with aggressive buying around the $0.78–$0.80 range. This expansion is now being validated by healthy volume nodes and POC shifts moving upward. The current zone around $0.86–$0.89 is developing value higher, indicating strong buyer control. As long as FET holds above the previous VAH around $0.84, bullish momentum is intact, and we could see a push toward psychological resistance at $0.90 and then $0.93. However, any drop below $0.84 may test back toward $0.80 where demand previously stepped in. This is a classic trending auction build-up — favoring long bias on pullbacks.
My doodle suggests this is the most best chart to bee seen in terms!

FET/USDT – Daily Technical AnalysisFET/USDT – Daily Technical Analysis
On the daily chart , FET has key weekly support at $0.340 and weekly resistance at $2.00. After a strong upward move, the price has now reached the top of its descending trendline, which may lead to a potential short-term correction.
This correction could extend down to the daily support level at $0.50, which is around 20% below the current price.
However, if the price manages to break above the daily resistance at $0.80, it would signal bullish continuation, with a short-term target at $1.00.
🟢 Support Levels:
$0.50 (daily support – potential correction target)
$0.340 (weekly support – major long-term level)
🔴 Resistance Levels:
$0.80 (daily resistance – key breakout level)
$1.00 (initial bullish target after breakout)
$2.00 (weekly resistance – major long-term barrier)


TradeCityPro | FET: AI Token Eyes Breakout After Sharp Rebound👋 Welcome to TradeCity Pro!
In this analysis, I’m going to review the FET coin for you. This project is one of the top AI-related projects in the crypto category.
💫 With a market cap of $1.8 billion, it currently ranks 48th on CoinMarketCap.
📅 Weekly Timeframe
In the previous analysis, I mentioned that if the ascending trendline in this timeframe is broken, the price would make a higher high beyond 3.099, and with the activation of the trendline trigger, we could confirm a trend reversal in this timeframe.
✔️ As you can see, that scenario has played out. After breaking the trendline and the 0.382 Fibonacci level, the price dropped sharply down to the 0.786 level.
✨ The price reaction at this level was very quick, and after hitting this zone, it gained bullish momentum again with a bullish engulfing candle and has now reached the 0.797 area.
📈 If the 0.797 level breaks, the price could experience another sharp upward move. The next resistance levels are 1.095, 2.068, and 3.099 — with 1.095 overlapping with the 0.382 Fibonacci level.
📊 The main confirmation of trend reversal will be given by forming a higher high and higher low above the 0.797 level — confirming Dow Theory.
🔽 For a bearish continuation, the confirmation comes with a break of the 0.786 Fibonacci level. The main support levels are 0.185 and 0.058.
📅 Daily Timeframe
In the daily timeframe, we can better see the details of this bullish move. As observed, the price has had a sharp leg up from the 0.379 bottom to 0.791 without any real correction.
🧩 Given the strength of the 0.791 resistance, a correction is more likely here. If the price moves upward without correction, it’s usually not a good sign for trend sustainability. A healthy trend includes corrections.
🎲 However, if 0.791 breaks and RSI enters the Overbought zone, the price could continue rising toward the 1.128 resistance. While this might not be ideal for trend health, the risk-to-reward ratio makes opening a position worthwhile.
🛒 In my opinion, a correction followed by a new bullish wave would be a more ideal setup, increasing the chances of a breakout. Breaking this level could be a strong trigger for both spot buying and futures positions.
📉 For a bearish scenario, we need to wait for the price reaction to 0.791 and then enter after confirmation of trend reversal. Lower-level triggers would be the breaks of 0.567, 0.455, and 0.379.
📝 Final Thoughts
This analysis reflects our opinions and is not financial advice.
Share your thoughts in the comments, and don’t forget to share this analysis with your friends! ❤️

FETUSDT.P Breakdown Incoming? Supply Zone + Rising Wedge FET just tapped into a strong supply zone and formed a rising wedge — usually a bearish sign. Price looks weak here and might break down soon.
If the wedge breaks, I’m looking for a short setup.
Entry: 0.716 - Wait for breakdown
Stoploss: 0.746
Target 1: 0.685
Target 2: 0.657
Target 3: 0.607
Waiting for confirmation before jumping in. Let’s see how it plays out.

FET Imminent Rise, Easy 333% To 666% Profits PotentialThis is a time sensitive publication. I will explain my thinking and support my conclusions based on TA.
How are you doing in this wonderful day?
Bitcoin is looking good and the Altcoins are looking better by the day. The Cryptocurrency market is heating up and set to grow long-term.
» Imminent, FETUSDT is preparing for a strong rise next.
Here is the thing, the downtrend has been broken. This of itself reveals and confirms a bullish bias.
Next, the 3-Feb. low resistance has been conquered and this is a major development. This is the short-term baseline. Above this level FETUSDT is ultra-bullish.
Finally, The bottom pattern is a classic, iH&S, and supported with really high volume. All these signals are strong, confirmed and good.
Artificial Superintelligence Alliance is set to grow. It is already growing, but this growth will soon speed up. Bullish momentum will manifest and a strong bullish wave will develop.
» First, a 333% target is easy followed by additional growth.
Namaste.

FETUSDI sold every single FET I had at around 2.50s in May 24 and I've not been really interested in it since then, apart from a few short term traders. It's always been a terrible asset to trade frequently, a pain to wait for it to do its thing and then everything happens in a matter of few weeks. As if it's not enough, the merger made it even less attactive.
Anyway, this chart is from December and finally it's in my buy zone. If the qFVG doesn't hold, then i think it'll go down to htf golden pocket for a 98% retrace from ATH. The team behind is relentlessly building and making partnerships, so i think its time can come again.

#FET/USDT#FET
The price is moving within a descending channel on the 1-hour frame, adhering well to it, and is heading for a strong breakout and retest.
We are experiencing a rebound from the lower boundary of the descending channel, which is support at 620.
We are experiencing a downtrend on the RSI indicator, which is about to break and retest, supporting the upward trend.
We are looking for stability above the 100 moving average.
Entry price: 0.625
First target: 0.659
Second target: 0.647
Third target: 0.659

#FET/USDT Futures Trade Setup!#FET looks good if you missed.
Two options to enter:
1. You can accumulate .5869 to .6080
2. Wait for the US Open and buy at CMP with confirmations.
Targets : .6377 .6522, .6755, .6838 and .7021
SL .5772
Dyor, NFA
Do hit the like button if you want me to post more setups like this.
Thank you
#PEACE

FET/USDT - Trendline Breakout (22.04.2025)The FET/USDT Pair on the M30 timeframe presents a Potential Selling Opportunity due to a recent Formation of a Breakout Pattern. This suggests a shift in momentum towards the downside in the coming hours.
Possible Short Trade:
Entry: Consider Entering A Short Position around Trendline Of The Pattern.
Target Levels:
1st Support – 0.553
2nd Support – 0.516
🎁 Please hit the like button and
🎁 Leave a comment to support for My Post !
Your likes and comments are incredibly motivating and will encourage me to share more analysis with you.
Best Regards, KABHI_TA_TRADING
Thank you.
