#FET/USDT 1HOUR UPDATE BY CRYPTOSANDERS !!Hello, dear traders welcome you to this FET/USDT 1hr chart analysis.
I have tried my best to bring the best possible outcome in this chart.
Hello dear traders, If you find our charts helpful then support our ideas with your LIKE and COMMENT, also be free to ask any question in the comments, and we will try to answer for all, thank you, guys.
ENTRY:-$0.1810,$0.1850
TARGET:-10%
STOP LOSS:-$0.1720
LEVERAGE:-10X TO 20X
FET/USDT rising wedge pattern creates and buys the dip and green zone.
Thanks for your time, we hope our work is good for you, and you are satisfied, we wish you a good day and big profits.
THANK YOU.
FETUSDT

FET isn't looking too hot...Hey Traders,
Like the TOTAL crypto market cap, FET on the weekly has formed an Elliot Wave Impulse. These are of course bearish and paired with the RSI indicate the bears are gaining strength. Although I don't think this will happen soon, BTC will have to go into a bear market during the summer for this to occur. However, on the daily, a breakout is soon mainly due to the MACD hinting a small uptrend.
Safe Trading,
-Pulkanator

FET/USDT#FET/USDT ANALYSIS
###################################################################################################################################################+
It is holding above horizontal and trendline support. MACD crossover is loosing bearish momentum. As it is currently creating a higher low, so a good volume will confirm a bullish move from here and a sustain breakdown of the support would confirm bearish move. FET has real great project. you can buy it under 0.35
BUY ORDER < 0.344
SELL ORDER >= 0.37-0.70
Targets:
T1: 0.37
T2: 0.42
T3:0.47
T4: the moon
If u agree & like my trading still give me some like and follow me boss! love all of u !!!
HAPPPY TRADING!!!
FETUSDTBINANCE:FETUSDT
those who wanna join fetch.Ai 200% ride . i think its time to join now
but one condition:-
take entry if btc holds 40k otherwise this will be more risky
holding period Max 90days or 3Months
note :
This is not a financial advice

FETUSDT BINANCE:FETUSDT those who wanna join fetch.Ai 200% ride . i think its time to join now
but one condition:-
take entry if btc holds 40k otherwise this will be more risky
note :
This is not a financial advice

FET on Binance - Breakout+Retest & preparing to move toward 1$Fetch Ai (FET) On Binance Daily Chart
Successeful Breakout + Retest Done.. Patience is Key.
Aggressive entry now at 0.327
Stoploss after a Daily Close Below 0.25
Safe entry after a Daily Close above 0.43
TP1 0.60
TP2 0.75
TP3 0.99
TP4 2.00
DYOR.

FET BREAKOUT! READY TO PUMP 200%Hi guys, This is CryptoMojo, One of the most active trading view authors and fastest-growing communities.
Do consider following me for the latest updates and Long /Short calls on almost every exchange.
I post short mid and long-term trade setups too.
Let’s get to the chart!
I have tried my best to bring the best possible outcome in this chart, Do not consider it as financial advice.
FET breaking out from the defending channel like structure in 2days time frame. I'm expecting a 200-300% pump from here.
Buy some here and add more in dips.
Entry range:- $0.427 - $0.48
Target- 200%
SL:- $4
This chart is likely to help you in making better trade decisions, if it did do consider upvoting this chart.
Would also love to know your charts and views in the comment section.
Thank you

Fetch.AI FETUSDT - Breaking out! + Channel + Head and Shoulders- FET looks very strong on the daily time frame!
- We have a breakout (Head and shoulders + Descending channel).
- Profit target slightly below all time high level

FET - Wait For The Trigger!Hello TradingView Family / Fellow Traders. This is Richard, as known as theSignalyst.
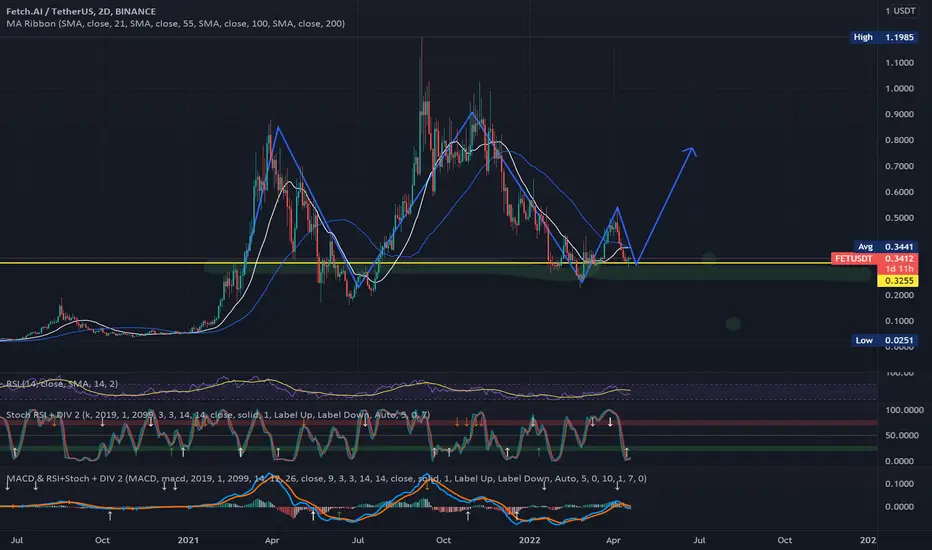
FET is overall bullish trading inside the brown rising broadening wedge pattern.
FET is now approaching the lower brown trendline and green support so we will be looking for buy setups.
on DAILY: The sellers seem to be exhausted, as the last swing couldn’t push lower, instead resulting in a higher lower. This gives us an early alert that a potential shift in momentum might occur soon!
Moreover, FET formed a valid wedge pattern in red and inverse head and shoulders pattern.
But it doesn’t mean that the bulls took over yet.
Trigger => For the bulls to take control, before we buy, we need a candle close above the gray neckline.
Meanwhile, until the buy is activated, FET can still trade lower inside the green support before trading higher.
Good luck!
All Strategies Are Good; If Managed Properly!
~Rich

Fetch.ai (FET) formed bullish Gartley for upto 22% pumpHi dear friends, hope you are well and welcome to the new trade setup of Fetch.ai (FET) with BTC pair.
Previously we had a nice trade of FET:
On a daily time frame FET has formed bullish Gartley pattern.
Note: Above idea is for educational purpose only. It is advised to diversify and strictly follow the stop loss, and don't get stuck with trade

$FET 3-4x opportunity Mid term (3-6 month)
Take profit 1: 1.2$
Take profit 2: 1.5$
Stop loss: 0.2$
Do your own research.

We might $FETCH this up.$FET :
Looks like a cup & Handle - IMO
Might do an Upward till the Black dotted.,
to dip further so as to complete the Cup & Handle pattern
This looks really pretty poised
Hope the pattern gets completed to understand its Future trends.
Happy trading

FETUSDT TECHNICAL ANALYSISFetch.Al ready to jump over 19%. How about you?
We have received multiple signals from @EngineeringRobo and candle break out down trendline right now. Not only that, MA changed direction as well. It is another an opportunity for buy as well. Lets follow up our chart/analysis together and don't forget the follow me.
"NFA"

fetusdtAccording to the main event that is going to happen tomorrow (independent network)
A cross-sectional profit can be obtained from this currency

$FET$FET
Looks a bit week after last night's minor pump (in Short Time)
Might drop further down to reach the major bullish support level (around 0.2 to 0.3)
Mighty resistance at HTF.
Might get heavy volumes to broke its ATH may be in a span of 2 to 3 months - IMO.

Time to rock and roll Fetch.ai FETFET looks ready to fly. Potential areas shown, take profits on the way up!
Good luck everyone!

Fetch.io #fetusdtEN :
- End traingle pattern FETUSDT
- Trend following long term
FR :
- Fin de triangle pour FETUSDT
- Continuation de la tendance long terme
- Canal haussier clair


Looking for a strong move higher in FETUSDT, in wave iiiHello and Welcome,
I expect that FET/USDT ended his correction in "(w)(x)(y)" formation and targeting a new high.
invalidation at 0.43

Fetch.AI FETUSDT - Elliott Wave +Ascending Channel breaking out!- Impulse Elliott Wave has been completed with 5 successful waves.
- Now the main ascending channel is being destroyed by bears.
- Looks like the bull market is over for 90% of all altcoins.
- Only few altcoins can survive long term, maybe FET can be one of them, but we need a correction first before another push to the upside.
- HODL Is a bad strategy for altcoins, HODL can work only with Bitcoin. Altcoins need to be traded instead.

🚀 FET 🚀 KEEP YOUR EYES ON IT 🚀FET is above $0.58 horizontal resistance and 200 EMA.
If he can break the resistance, his targets will be;
$0.68
$0.88
$1.20 ath.
This is NOT financial advice, you are responsible for your own trading decisions.
** If you enjoyed the idea please LIKE and FOLLOW **
Let me know what you think below!

FET USDT FET USDT
Cup & Holder 4H chart
targets are shown
stop loss in red
scalping , for swing trading make sure u dca

FET/USDT case study with Livermores speculative chart - updateWell I'm still keeping track of this. The last count seems a bit off but lets see how it plays out.
This is not financial advice. Please do you own research. Protect your capital at all cost.
