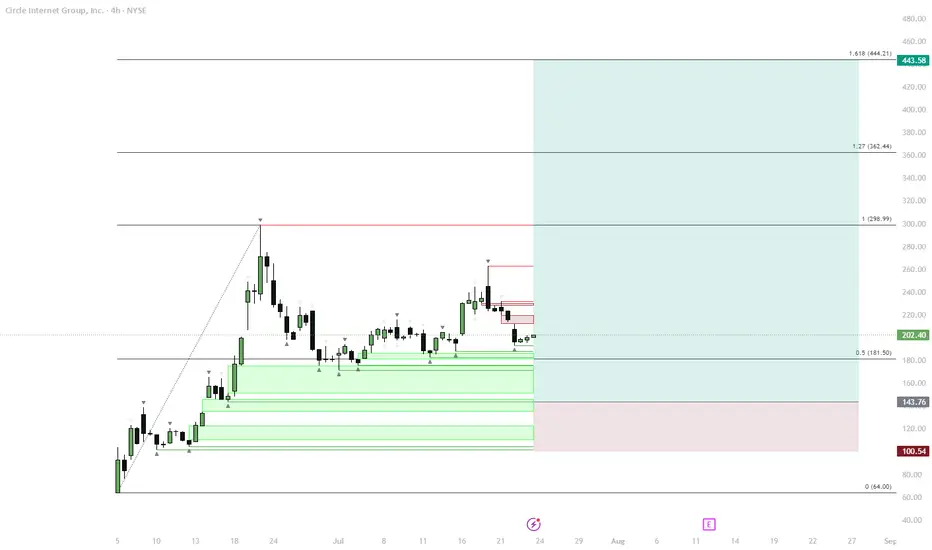
CRCL – Classic Crypto IPO Fractal in Play?Initial Pump:
Price launched rapidly after listing, forming a local high.
Sideways Phase:
Market settled into a sideways consolidation, typical after the first pump.
Retrace:
A retrace toward the 0.5 Fibonacci zone (~$181.50) is developing. Typical retracement in similar "crypto stonks" ranges from 60-80%.
Accumulation in Demand Zone:
Multiple support levels are stacked between $180–$140, indicating a strong demand zone for accumulation.
True Move Potential:
If the support holds, a new bullish leg could start, targeting Fibonacci extensions ($299, $362, $444). If the support is lost, the next levels are $143 and $100.
This scenario is based on the repeating behavioral fractal seen in high-profile crypto listings: explosive initial move, multi-week consolidation, and a deep retracement before the real trend emerges. Current price is entering the key demand area, which aligns with previous market structure seen on token launches. The risk/reward for new longs becomes attractive here if buyers defend the zone. However, invalidation is clear if price breaks below $140.
Fib
SOL — Breakout Watch & Range Play1. Watch for breakout above trendline
2. Hold support 151–147 for bullish scenario
3. Target: 168.4 (pre month high)
4. Stop: below 125.9 (pre month low)

Gold: Will 3,260 Flip From Supply to Springboard?Micro Gold Futures — 30 min chart
BULLISH ABOVE 3,260 | BEARISH BELOW
🗺️ Structure in Focus
Macro bias (4 h/1 D): remains bearish — lower highs & lows since late‑April.
Intraday context: price climbing in a rising channel; buyers defend each channel low since 1 May.
Grey zone 3 255‑3 260:
• 61 %‑78 % Fib retrace of the last leg down
• Breakdown base now acting as supply
• Mid‑channel + intraday VWAP overhead
A decisive H1 close above 3 260 plus a bullish retest flips the bias long toward ≈ 3 280.
🧭 Trade Map
🔴 Base‑case short
• Trigger – bearish reaction inside / below 3 255‑60
• Targets – 3 230, then 3 210 (-27 % Fib extension)
• Invalidation – H1/H4 close > 3 260
🟢 Flip‑bull plan
• Trigger – H1 close above 3 260 and zone holds as support
• Target – 3 280 supply (channel top + prior S/R)
• Invalidation – H1 close back under 3 250
(Risk ≤ 1 % per idea; scale out at interim levels.)
📊 Narrative to Watch
Fed speakers & US data could jolt real yields and gold flow.
Asia session often sets the tone—watch Shanghai physical premium chatter.
Softening DXY gives the upside‑break thesis a tail‑wind.
What’s your play—fade the zone or ride the breakout? Smash the boost 🔥 and follow for live updates!
Not financial advice; just sharing my plan.
Tags: #Gold #XAUUSD #Futures #PriceAction #Fib #TechnicalAnalysis

eurusd chart: trade idea 1 - go towards breaker blockeurusd chart: trade idea 1 - go towards breaker blockeurusd chart: trade idea 1 - go towards breaker blockeurusd chart: trade idea 1 - go towards breaker blockeurusd chart: trade idea 1 - go towards breaker blockeurusd chart: trade idea 1 - go towards breaker blockeurusd chart: trade idea 1 - go towards breaker blockeurusd chart: trade idea 1 - go towards breaker blockeurusd chart: trade idea 1 - go towards breaker blockeurusd chart: trade idea 1 - go towards breaker blockeurusd chart: trade idea 1 - go towards breaker blockeurusd chart: trade idea 1 - go towards breaker blockeurusd chart: trade idea 1 - go towards breaker blockeurusd chart: trade idea 1 - go towards breaker blockeurusd chart: trade idea 1 - go towards breaker blockeurusd chart: trade idea 1 - go towards breaker blockeurusd chart: trade idea 1 - go towards breaker blockeurusd chart: trade idea 1 - go towards breaker blockeurusd chart: trade idea 1 - go towards breaker blockeurusd chart: trade idea 1 - go towards breaker blockeurusd chart: trade idea 1 - go towards breaker blockeurusd chart: trade idea 1 - go towards breaker blockeurusd chart: trade idea 1 - go towards breaker blockeurusd chart: trade idea 1 - go towards breaker blockeurusd chart: trade idea 1 - go towards breaker blockeurusd chart: trade idea 1 - go towards breaker blockeurusd chart: trade idea 1 - go towards breaker blockeurusd chart: trade idea 1 - go towards breaker blockeurusd chart: trade idea 1 - go towards breaker block

$ROOT: TRENDING BULLISHLY. POTENTIAL SQUEEZE. 🚀🚀🚀Hello, everyone!
We're seeing promising signals for $ROOT. If its price maintains above our key monthly indicator, we anticipate an uptrend. A very bullish trend will be confirmed when the daily indicator rises above the monthly one. Should this happen, we'll be on the lookout for the weekly indicator to follow suit. Our first price target (PT) is set at $76, with a strong move to $180 on the cards once the weekly crosses the monthly threshold. NASDAQ:ROOT has already made a massive move up, but this is only the start of something huge. However, if we see the hourly indicator fall below the monthly, this would need to be reassessed, as it could invalidate our current forecast.
NFA! Good luck, everyone!

relief pumpSeems like election bull was already priced in, new money got washed.
Bonds are making a comeback, cash is a position.
Expecting more downturn after a relief pump, coinciding with yields retracement.
Yields trending with equity price are usually signs of either economical expansion or economical fears, such as slowdown or recession, during up and downs. The markets just jumped from one narrative to the other:
expansion(trump gets in office) ---> slowdown(tariffs imposed)
I think the expansion narrative will take a while to settle back(end of Q2 at least) after all the executive orders signed.
Although, I'm still long for the month of March, nice opportunity for a relief pump, before resuming of slowdown narrative.

GU SELLhigh probability opportunity, OB + F + P, could see some volatility once price enters that zone

Gold is merely pulling back to FIB levels. 2649 is Poss.
FIB trading is for the patient trader to get in at a lower price level, which incidentally does not include me, I am like a wounded bull getting into trades for most of the time.
I think 2649 and just below is possible.
I will try and put a call out here when momentum upwards starts to occur. It wont be long now.

GBPUSD Short and Longs (News) Scenario 1: Both PMIs Better than Forecast
Actual Manufacturing PMI: 49.5 (Better than 48.8 forecast)
Actual Services PMI: 56.0 (Better than 55.2 forecast)
EUR/USD: Down - If both sectors perform better than expected, this might signal a stronger US economy, potentially leading to a stronger Dollar.
GBP/USD: Down - Similar to EUR/USD, a stronger US economic outlook could weaken GBP against USD.
USD/JPY: Up - Improved US PMI data might strengthen USD against JPY, especially if this leads to expectations of a tighter Fed policy.
Scenario 2: Both PMIs Worse than Forecast
Actual Manufacturing PMI: 48.0 (Worse than 48.8 forecast)
Actual Services PMI: 54.0 (Worse than 55.2 forecast)
EUR/USD: Up - If both sectors disappoint, this could indicate economic weakness in the US, leading to a weaker USD.
GBP/USD: Up - Weaker US data might make GBP relatively stronger, especially if UK economic indicators are not as disappointing.
USD/JPY: Down - A disappointing PMI might lead investors to question the US economic recovery, potentially weakening USD against JPY.
The Fib is just an example if we was to see a sell off it may come into play. If we not seeing a sell off the Fib will be non existent.

BTC Macro Outlook (Regression, SMA)Long-term price analysis using confluence of Log regression bands, SMA's, and Fibonacci retracements.
Possible case for a test of the 400w SMA, based on % distance to previous all-time highs.

Go Woke Go Broke TATA Motors. TATA Motors.
Are we going to be selling a huge push to the downside of TATA Motors, who The company produces cars, trucks, vans, and buses.
Subsidiaries include British Jaguar Land Rover and South Korean Tata Daewoo.
Due to Jaguars recent advertisement that has caused out rage on the Social media platforms. Do we see high stake investors leaving?
Fib is showing to us it can go all the way back down to $314 per share. This would be a massive 60% sell off.
Now of course TATA motors don't just do Jaguars but other motors as well.

USD CADTHIS IS MY SETUP FOR USD CAD
I use Fibonacci to get these extreme points and my preferred one is 75% retracement, with a risk-reward of 1:3.
Trade carefully
This is not financial advice, DYOR.

GBPUSD view for next weekBit of a messy chart here, but we can see the pink bullish trendline being broken and retested earlier today. Price has been trending inside the black channels, forming a flag pattern.
What I'm looking for next week is price to drop to 1.30500 and look to buy around that area, which was previous support + we have the 38.2% Fib retracement there.
Target would be 1.31777.

GBP NZDTHIS IS MY SETUP FOR GBP NZD
I use Fibonacci to get these extreme points and my preferred one is 75% retracement, with a risk-reward of 1:3.
Trade carefully
This is not financial advice, DYOR.

LDO BullishI am not a financial advisor. This is not meant to be and does not constitute financial, investment, trading, or any other types of advice or recommendation.

EUR AUDTHIS IS MY SETUP FOR EUR AUD
I use Fibonacci to get these extreme points and my preferred one is 75% retracement, with a risk-reward of 1:3.
Trade carefully
This is not financial advice, DYOR.

How to Use Fibonacci Retracements to Find Entry and Exit PointsAlright, traders, let’s talk about Fibonacci Retracements — the tool that’s part math, part mysticism, and all about finding those sweet spots for entry and exit. If you’ve ever wondered how seasoned traders seem to know exactly when to jump in and when to cash out, chances are they’ve got Fibonacci retracements in their toolbox (or they’re insider trading).
What Are Fibonacci Retracements?
Fibonacci Retracements are based on the famous Fibonacci sequence — a string of numbers discovered in the 1200s by the medieval Italian mathematician Leonardo of Pisa (later nicknamed Fibonacci, meaning "son of Bonacci"). The sequence of numbers starts with 1, 2, 3, 5 and grows by adding the sum of the two previous numbers.
These mystical numbers show up everywhere from pinecones and seashells to the human hand and the Apple logo and, of course, the charts. It all comes down to 61.8%, the golden child of market moves and corrections. But before you go off believing Fibonacci is some sort of market sorcerer, let’s break it down.
The Key Levels
23.6%, 38.2%, 50%, 61.8%, 78.6% : These are the Fibonacci retracement levels you’ll see on your chart when you whip up the Fibonacci Retracement. They’re acting as the market’s pit stops — areas where the price could take a breather or reverse altogether.
Traders use these levels to predict how far a price might pull back before resuming its trend. Put simply, it’s like finding the market’s sweet spot where it says, “Enough with the chit-chat, let’s bounce.”
How to Use Fibonacci Retracements
Identify the Trend : First, you need a clear trend — trace a price trajectory and make sure there is a well-defined and sustained move either up or down with a clear reversal at the end. No trend? No Fibonacci.
Draw the Retracement : Stretch the Fib tool from the start of the move (swing low) to the end (swing high). If the trend is up, draw from low to high. If it’s down, high to low. Watch as those golden ratios light up your chart like a Christmas tree. Now you’ve got your levels mapped out and you can easily start looking for the potential turning points.
Spot the Bounce : The series of horizontal lines on your chart — these are your Fibonacci levels, and they’re not just pretty—they’re potential support and resistance zones. When the price retraces to a Fib level, it’s decision time. Will it bounce, or will it break? The 61.8% level is the big one — the golden ratio. If the price holds there, it may be a sign that the trend could continue. If it breaks, well, it’s time to reassess. Think of it as the market’s line in the sand.
Finding Entry Points
Here’s where it gets interesting. Imagine the market’s been on a bull run, but then starts to pull back. You’re itching to buy, but where? This is where Fibonacci levels shine.
When the price retraces to a key Fibonacci level (say 38.2% or 50%), it’s like the market is pausing to catch its breath. That’s your cue to consider entering a position. You’re aiming to ride the next wave up once the market finishes its coffee break at one of these levels.
Nailing Exit Points
On the flip side, if you’re already in a trade and looking to lock in profits, those same Fibonacci levels can be your guide for exiting. If the price is approaching a key level from below, it might be time to secure your gains before the market pulls another U-turn.
For the bold and brave, you can even set your sights on the 161.8% level — this is where Fibonacci extensions come into play. It’s a target for when the market decides it’s not just going to bounce, but rocket into the stratosphere.
Pro Tip: Fib Confluence
Looking to up your game? Combine Fibonacci with other indicators like moving averages or trendlines. When multiple signals converge around a Fib level, it may be a strong confirmation that the trend could turn. Pay attention and always do your own research — fakeouts are real.
Why It Works (and Why It Doesn't)
Some say Fibonacci levels work because they’re rooted in natural mathematics. Others believe it’s a self-fulfilling prophecy because so many traders use them. And just like any strategy, it doesn’t work 100% of the time. The market has a mind of its own, and sometimes it just doesn’t care about your Fibonacci levels. But when they do work, they can give you a serious edge.
The Bottom Line
Fibonacci Retracements aren’t just a bunch of lines on a chart — they’re your reminder that maybe everything is indeed one from the universe’s perspective and there are naturally occurring patterns everywhere.
Whether you believe in the math and the or just like the results, one thing’s for sure: Fibs can give you an edge in spotting when to hold back or lean forward. So next time you’re stuck wondering when to buy or sell, try the Fibonacci.

Saudi wants production cuts, America doesn'tAlthough everyone is cutting down production, even SHELL, we are seeing the narrative of higher prices for longer. OPEC wants to cut beginning October 2024 until 25.
This might be for a multitude of reasons, which makes it quite unclear what the goal is. After falling demand and easing in production, my narrative is that we might see prices fall instead of rise, even though we are trying to limit supply, I think markets are going to want to lower prices as energy scarcity becomes vulnerable and volatility will rise. Geopolitical risks has not eased.
US SPR is lower than a quarter of its peak in 2021. My bet of dropping prices lies on that. As well as Trump having 70% chance of coming into office, I expect a welcoming gift from MBS giving us discounts on gas!

BTC retracement dumpAs you can see, potential final Elliot wave lower high on daily.
Like to see final discounts before potential rate cut cycle.
(FED spoke yesterday and seemed bullish for rate cuts during 2025, coinciding with elections and time variable with potential price action picking back up during then)

Bearish Short/Medium termI am not a financial advisor. This is not meant to be and does not constitute financial, investment, trading, or any other types of advice or recommendation.

Currently in a nice level of FIB on IBM.🔉Sound on!🔉
Thank you as always for watching my videos. I hope that you learned something very educational! Please feel free to like, share, and comment on this post. Remember only risk what you are willing to lose. Trading is very risky but it can change your life!

Virgin Galactic -Top and Bottom-Top and Bottom are 203.84 and 0.80
Above 203.84 the chart is worthless until we revisit the area below 203.84

🚨$DJT: It's Not Over Yet! 🚀🚀🚀Hi everyone,
Despite a significant drop of 21% today, our indicators suggest the downtrend might not persist. A rebound above the daily level could signal a bullish trend, potentially leading to a weekly cross above the monthly. This could aim the price towards the $63 mark, aligning with the 0.618 Fibonacci resistance level. Conversely, if the price dips below the daily level, the monthly level could offer support. Let's see where this goes in the next few weeks.
Good luck!
