NEAR// Near New ATHs!Nothing complicated...break & retest...following volume along with riding the BTC momentum.
Got a good rejection from the broken resistance now support. Would be best to wait on a second bullish candle and then look for entries. As of right now, everything is bullish.
Fib

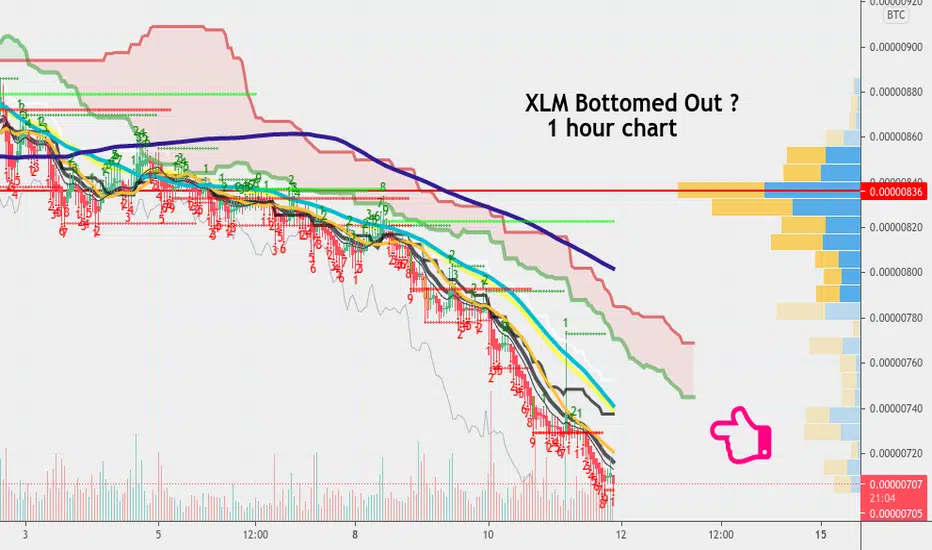
Digging Deep XLM/BTC #Stellar #XLM $XLM Here we see our XLM Btc 1 hour chart on Binance . As you see we have dipped way down here into the 700 area. We have hit another TD Sequential 9 in red here and should really see a turnaround come soon . I'd wait for confirmation but a target above us seems to be 836 - which would be that red line above us. That's part of our VPVR indicator and the red line is an area of confluence and should be a target above us where we will be going at some point. I still think there is a large Cup and Handle structure forming on this XLM chart on the higher timeframes but here we see the chart is bottomed out . When this finally turns up the targets above should be our fibs which are =
1926 - that's our .236 fib
2862 - that's our .382 fib
3619 - that's our .5 fib
4375 - that's our .618 fib
4939 - that's our .786 fib
there may be a pullback somewhere near 37xx since that could be the lip of the cup - but Xlm can see returns to All Time Highs this year . Thank you.
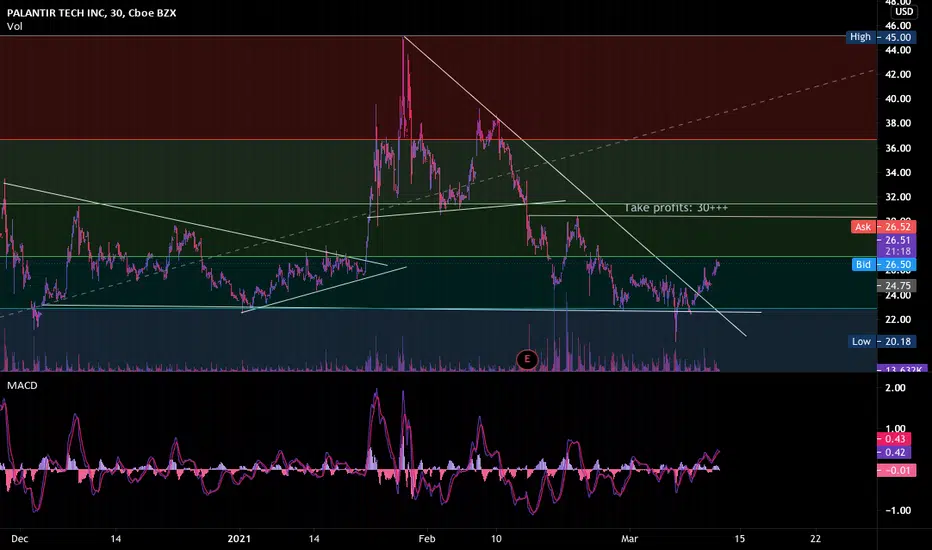
PLTR Coming up on Fib LevelLast time PLTR was in a wedge at this Fib level, we saw huge gains. I am looking for the same thing to happen. If the market is good I think this stock can keep running. Always remember to do your own research. Happy trading!!
Mid-day Play on APREAPRE is hitting resistance at Fib levels again, I it breaks through, I can see a large upside. This trade is mostly for today or within the next 3 days. Keep an eye on it. Good Luck


BTC-USD still waiting to complete measured move fib short setupFib measured move short setup still intact and waiting to hit its target at 41,657.73.
This will be valid until the 61.8% fib is broken at 53,193.92.
Short setup target also should be support for the retest of the recent all time high at 42,000

Anticipation ... VRA/BTC #Verasity #VRA $VRAHere we see our VRA BTC daily chart from Kucoin. RIght on track our light blue 50 MA is going to cross up into our dark blue 200 MA . That's the Golden Cross we've been talking about. I'll link the related chart below . This is still very Bullish for our chart and as you see we wicked up to touch that red line ( that's the VPVR indicator .) If Altseason is starting then what are the possible targets here for VRA ? Well , our fibs could be the targets and next one above us is this :
4827 - that's our .236 fib
7728 - that's our .382 fib
10072 - that's our .5 fib
12416 - that's our .618 fib
Let's see how this does in 2021 - thank you for reading !


26x Possible in One Year ? GVT/BTC #GenesisVision #GVT $GVTHere we see our GVT weekly chart and after that massive downside during the bearmarket it could be looking up now. You see there is a massive Ichimoku cloud above us ( the top of which is 13500 sats .) That's 13x up from where we are now - 13 times ! That's already a good result but let's look at the fibs to see other possible targets . Our fib targets on the way up could go like this =
10300 - that's our .236 fib
13500 - that's our top of cloud target , remember
16500 - that's our .382 fib
21400 - that's our .5 fib
26400 - that's our .618 fib
that last one is about 26 times up from where we are now , but that could take a year to get there . In my opinion that might be possible in early 2022 if the Bullmarket carries this up .

Dollar Dreams VRA/USDT #Verasity $VRA #VraHere we see our Vra weekly chart from Kucoin with a tether pairing . You'll notice we are at a third of a cent now . On our fib extension you can see the target for end of 2021 or early 2022 appears to be 1 and a half cents or about 5x up from where we are now on the 4.236 extension . But this is a Bullrun year and the Moonboys want their 1 dollar target ! That would be 300x from where we are now and in my opinion won't happen . But sometimes insane runs happen in crazy bullish scenarios so I won't rule anything out for VRA ! Especially since Twitter gurus also love this project. But $1 may have to wait . See my related chart for VRA BTC pair below . Thank you .

LLKKFLake broke down, I sold at .33c entry was .22c so nice win & this trade strayed up through the entire stock market correction. This was my only profitable trade over the stock market correction I used the funds to. buy every dip down to 3780. I think Lake will come back from here and I would buy at these levels and look for .49c

BTC is about to BOOMThere will be selling opportunities at the confluence zones marked. But don't get this mistaken for an exit strategy. The bulls are clearly taking control and we will be seeing a surge this weekend.

/ES Possible Buy PointJust a chart on where I think /ES might go based on Elliot waves. and fibonacci levels.

GBPNZD// Head & Shoulders 🤷🏾♂️Potential H/S Pattern. Currently retesting strong support and showing price rejection at 61.8%.

Pitchforks Ready BAT/BTC #basicattentiontoken $BAT #BAT Here we see our BAT BTC weekly chart from Binance . You can see BAT had a massive downside here from last summer. But it's recovering nicely and looks great for upside . You see we have drawn a large pitchfork indicator on this chart and it seems to fit. The top of that first pitchfork line up seems to be near 2600 and that also is where you see that long red line . That's an indicator called a VPVR and there's an obvious area of confluence near 2598 , so this appears to be a target in the near future. You can see our first target area - it's where the black arrow is pointing . The target above that appears to be the .382 fib near 3687 . Above that is our middle pitchfork line near 4600 . Above that is very bullish and targets would be
5859 - that's our .618 fib
6669 - that's our .706 fib
7405 - that's our .786 fib
8700 - that's the top of the pitchfork end of year 2021
thank you for having a look ! And fyi this is technically a Schiff pitchfork , it's one of the free indicators in your left side panel on Trading View.

Make It Rain ZIL/BTC #ZilliqaCommunity #ZIL $ZILHere we see our weekly ZIL BTC chart from Kucoin with that big pink Ichimoku cloud on it . As you can see we have closed weekly candles inside this cloud since the start of the year . This is extremely bullish in my opinion because once a coin enters into the weekly Ichimoku cloud it is almost certainly going to continue up to the top of that cloud and probably eventually break though it ( and maybe continue upside from there . ) Now you see that red line on my chart ? That's an area of big resistance on the weekly chart near 713 . It's also right above the .236 fib line. So this seems like a near term target for Zil .But obviously having broken through the cloud at that point it would be bullish for more upside. Potential targets above that would be our fibs at
1067 - that's our .382 fib
1376 - that's our .5 fib
1684 - that'sour .618 fib
1915 - that's our .706 fib
obviously Zil can continue higher after that too, but let's see ! Also thank you to any Zilliqa Community members who see this .

LT Disjointed EURUSD Channel with FibJust a musing, now translating the EURUSD from a LT bearish wedge into a newly forming megaphone. Volatile to the downside if so, but in a tight range for now. Will post the close-up next. Retracing to the 1yr MA on the cards before resumption to the upside maybe.

Stuck in a bearish market ready to explode to 90$Still stuck in a bearish market and ready to explode.
According to the fibonacci I can see the 90$. EOS is now for years stuck in the bearish market, ADA, BTC, DOGE, ETH, they all got out of it.
There are still coins waiting down there like BCH or ZCASH. They have massive potential.
Why buy ETH for a 20% gain if you could buy BCH for example for a 1000% gain. From 1800$ ETH to 2000$ ETH is only a 22% gain.
I wish y'all good luck!
:D

ADAUSDT ABC Correction EntryENTRY FOR ADAUSDT @ $1.075
The A and C Waves are IMPULSIVE in nature as per Elliot Wave Theory and therefore has 5 WAVES. They are highlighted in YELLOW.
The B highlighted in BLUE, follow after Wave A, in CORRECTIVE 3 WAVES. This could be a good scalp entry @ $1.16 for an exit at $1.30.
After C wave ensues, we would like to enter at the END of WAVE C, purported by the 0.618 @ $1.07.
Thank you for reading and I hope this helps your trading/investings!
*If you happen to make bank on this, any Donations would be highly appreciated, thank you <3*
ADA Address : addr1q8tk3ra5fndaeggs6sk6ageqh2lmkhdztcgcg22cwh3tkjkftz34c04fcmqlzr4ky5mxeksqehl4eqskx36adjhpe7psqmfdyk

Attempting to find a relationship between Support and ResistanceAn idea for XRPBTC
Using Fib circles to view areas of support and resistance
It is in my view that if there is an equal number of support / resistance touches on the same fib ring, a cancellation occurs
Upon 1.618 there are 2 resistance touches, while 1 support touch
Using this we can assume the rest of the .618 touches or (uneven) support / resistance touches (XYZ) will act as the basis for the next move
I wish I could delve into this deeper, if anyone is more informed about Fib let me know!!
I find these patterns very interesting and explorable.
Regardless, I am long XRP

DASH ready to explode!DASH is ready to explode!
DASH is since the last bullcycle in bearish market. Other Altcoins like ETH got out of it.
I think when BTC is again moving upwards, we can see an altseason and DASH surpassing it's ATH. The Fib Tool shows, that we can see 6500$ per DASH this year!
Wish y'all good luck! :D
20% DISCOUNT on Binance:
URK3CM0E

High Hopes = FET Targets FET/BTC #FetchAi $FET #FETHere we see our FET BTC 3 day chart which shows our fib retracement levels . Fibs are generally good targets for upside on a bullish chart - and look to be our long-term targets for FET on Binance. You see that pink check mark on my chart ? That's a previous high near 1550 sats from last summer and looks like a good near-term target maybe sometime after the Mainnet of FET launches in March ( end of March,that is.) There can always be a pause and consolidation after that but the targets above us after that appear to be
3420 (there's strong resistance near here )
5443 - that's our .382 fib
7077 - that's our .5 fib
8712 - that's our .618 fib
9931 - that's our .706 fib
and there's still strong confluence near 5800 on the Kucoin chart. So hope you like my chart, thank you .

16K Dollar Fib Target 3200% gainBCH is now since the last bull cycle in a bearish market. BTC, ETH and Co. got out of it and hit almost there Fib levels. Altseason hasn't even started yet!
We can expect a massive upwards trend after this correction in those Alt's which are still very low like BCH or ZCASH.
I can see a 16K Dollar BCH in this altseason that would be a gain of 3200%!
Buy the dip, sell high ;D
I wish y'all good luck!
:D
